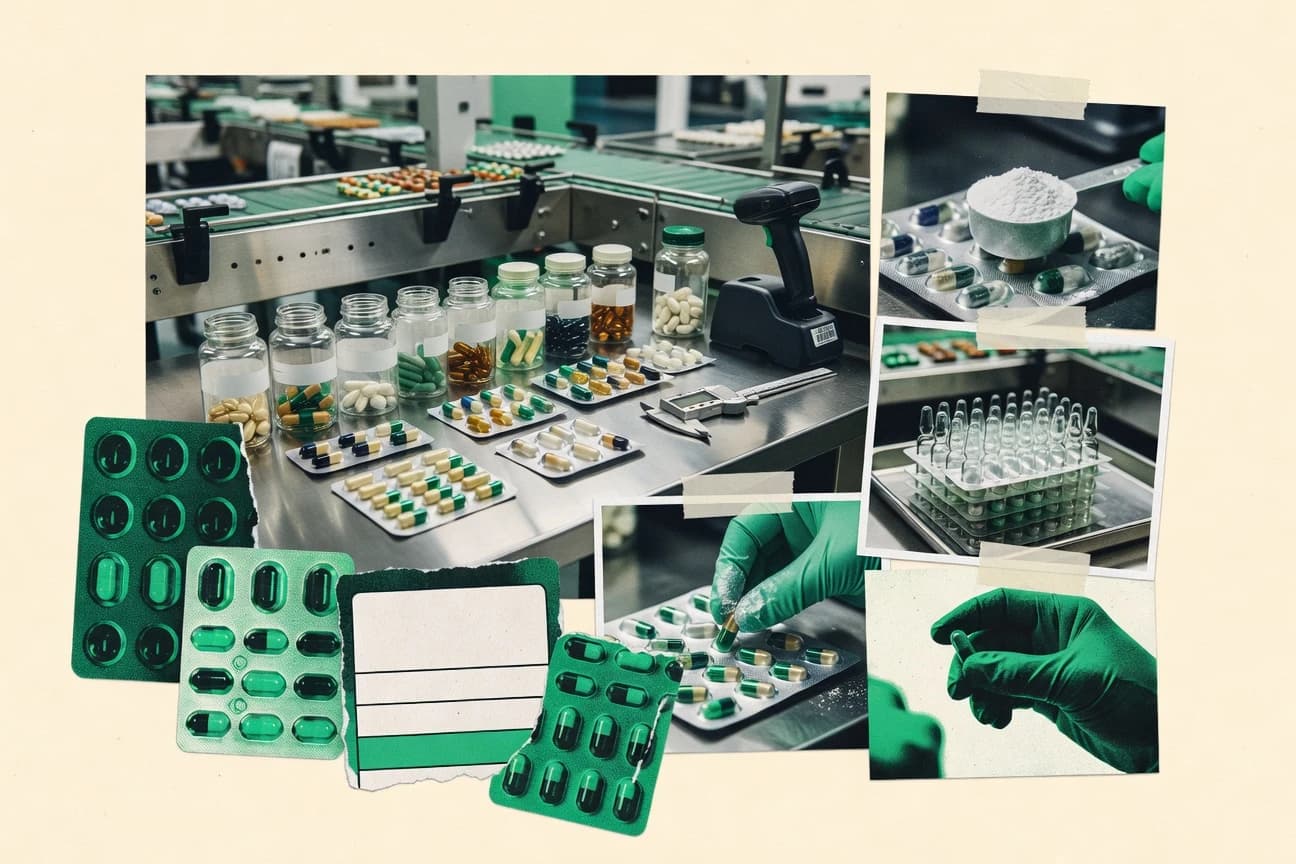

Recent signals are rewriting what “normal” looks like in the Nutritional Supplement Industry. The global supplements market is projected to reach about USD 177.5 billion in 2023 and keep climbing at a 9.1% CAGR through 2030, while everyday behavior is shifting at the same time, from 43% of U.S. adults aged 18 to 34 taking supplements daily to remote workers increasing use by 20% during 2020 to 2023. The mix of who buys, which ingredients trend, and how regulation and quality testing keep pace is where the real tension sits.
Key Takeaways
- 43% of U.S. adults aged 18-34 use dietary supplements daily, the highest usage rate among age groups.
- Women represent 62% of dietary supplement users in the U.S., compared to 38% men.
- 75% of U.S. adults over 50 take at least one dietary supplement regularly.
- The global nutritional supplements market was valued at USD 177.5 billion in 2023 and is expected to grow at a CAGR of 9.1% from 2024 to 2030, driven by rising health consciousness.
- U.S. dietary supplement sales reached $61.6 billion in 2022, marking a 9.9% increase from the previous year.
- The vitamins and supplements segment in North America generated $28.3 billion in revenue in 2023.
- Multivitamins dominate with 40% usage among U.S. supplement takers.
- Protein powders account for 25% of global sports nutrition supplement sales.
- Omega-3 fish oil supplements represent 15% of U.S. sales volume in 2023.
- 75% of U.S. supplement facilities are FDA-registered.
- Adverse event reports for supplements rose 15% to 25,000 in 2022.
- 98% of supplements tested pass USP quality standards voluntarily.
- Online channels accounted for 42% of U.S. supplement sales in 2023.
- Amazon holds 35% market share of U.S. online supplement retail.
- Mass market channels (Walmart, Costco) represent 28% of U.S. sales.
With supplements used by growing shares across ages and markets, the global industry is booming fast.
Related reading
01 · Category
Consumer Demographics29 stats
01
43% of U.S. adults aged 18-34 use dietary supplements daily, the highest usage rate among age groups.
02
Women represent 62% of dietary supplement users in the U.S., compared to 38% men.
03
75% of U.S. adults over 50 take at least one dietary supplement regularly.
04
Millennials (aged 27-42 in 2023) account for 35% of U.S. supplement purchases.
05
Hispanic consumers in the U.S. have a 55% supplement usage rate, above the national average of 48%.
06
68% of parents give supplements to children under 12 in the U.S.
07
Baby boomers (aged 59-77) spend 28% more on supplements than younger generations.
08
Urban dwellers use supplements 15% more frequently than rural residents in the U.S.
09
52% of college students in the U.S. report regular supplement consumption.
10
African American adults have a 49% dietary supplement usage rate in the U.S.
11
40% of U.S. consumers aged 18-24 prioritize personalized supplements.
12
High-income households (>$100k) use supplements 22% more than low-income ones.
13
61% of fitness enthusiasts aged 25-44 take protein supplements daily.
14
Seniors over 65 account for 25% of total U.S. supplement market spend.
15
55% of vegan consumers in Europe use nutritional supplements regularly.
16
Male supplement usage rose 12% among Gen Z in the U.S. from 2020-2023.
17
47% of U.S. healthcare professionals recommend supplements to patients.
18
Employed full-time adults use energy supplements 18% higher than unemployed.
19
70% of pregnant women in the U.S. take prenatal vitamins.
20
LGBTQ+ individuals report 58% supplement usage rate vs 48% general population.
21
36% of U.S. teens aged 13-17 use supplements, up 10% since 2019.
22
Athletes represent 15% of high-dose supplement consumers globally.
23
62% of U.S. women over 40 use calcium supplements.
24
Remote workers increased supplement use by 20% during 2020-2023.
25
50% of diabetics in the U.S. take chromium or alpha-lipoic acid supplements.
26
Gen X (43-58) holds 30% share of U.S. supplement consumer base.
27
65% of U.S. yoga practitioners use herbal supplements.
28
Low-carb dieters have 45% higher supplement intake.
29
Vitamin D supplements are used by 57% of U.S. adults aged 18+
Interpretation
Consumer Demographics Interpretation
While we're all trying to buy our way to health, the supplement industry’s customer base reads like a hyper-targeted census, proving that from cradle to cane, and from gym to office, everyone’s convinced they’re uniquely deficient.
02 · Category
Market Size and Growth30 stats
01
The global nutritional supplements market was valued at USD 177.5 billion in 2023 and is expected to grow at a CAGR of 9.1% from 2024 to 2030, driven by rising health consciousness.
02
U.S. dietary supplement sales reached $61.6 billion in 2022, marking a 9.9% increase from the previous year.
03
The vitamins and supplements segment in North America generated $28.3 billion in revenue in 2023.
04
Global sports nutrition market size was USD 45.24 billion in 2022, projected to reach USD 81.10 billion by 2030 at a CAGR of 7.7%.
05
The dietary supplements market in Asia Pacific is anticipated to grow at a CAGR of 10.2% from 2023 to 2030 due to increasing disposable incomes.
06
European nutritional supplements market valued at EUR 18.5 billion in 2022, with a forecasted CAGR of 7.8% through 2028.
07
U.S. online supplement sales surged 12.5% to $12.4 billion in 2023.
08
The global weight management supplements market was worth USD 24.5 billion in 2023, expected to expand at 7.9% CAGR.
09
Herbal supplement sales in the U.S. grew by 8.7% to $11.6 billion in 2022.
10
Probiotics market globally reached USD 84.2 billion in 2023, with a projected CAGR of 14.1% to 2030.
11
The meal replacement supplements market size was USD 13.6 billion in 2022, growing at 5.8% CAGR.
12
Latin America dietary supplements market projected to grow from USD 11.2 billion in 2023 at 8.4% CAGR to 2030.
13
U.S. multivitamin sales totaled $8.9 billion in 2022, up 5.2% year-over-year.
14
Global omega-3 supplements market valued at USD 2.9 billion in 2022, expected to hit USD 4.6 billion by 2030.
15
The nutraceuticals market in India reached INR 45,560 crore in 2023, with 15% YoY growth.
16
China's dietary supplements market size was CNY 350 billion in 2022, growing at 12% CAGR.
17
Middle East & Africa supplements market to grow from USD 7.8 billion in 2023 at 9.2% CAGR.
18
U.S. gummy vitamins sales reached $3.2 billion in 2023, up 15% from 2022.
19
Global protein supplements market was USD 28.15 billion in 2023, projected CAGR 8.4% to 2032.
20
The immune health supplements market grew to USD 22.4 billion globally in 2022 at 9.5% CAGR.
21
Australia nutritional supplements market valued at AUD 5.6 billion in 2023, 7.1% growth.
22
Brazil supplements market hit BRL 12.4 billion in 2022, expected 10% CAGR to 2028.
23
Global collagen supplements market size USD 9.9 billion in 2023, CAGR 9.2% forecast.
24
U.S. senior nutrition market reached $7.1 billion in 2023.
25
Japan functional foods and supplements market USD 45 billion in 2022.
26
The global sleep aids supplements market was USD 5.8 billion in 2023, growing 7.3% CAGR.
27
Canada dietary supplements sales $4.2 billion CAD in 2023.
28
South Korea nutraceuticals market valued at KRW 7.5 trillion in 2023.
29
Global bone & joint health supplements market USD 11.3 billion in 2022.
30
UK vitamins and supplements market £1.2 billion in 2023, 6.8% growth.
Interpretation
Market Size and Growth Interpretation
It appears the global population has concluded that wellness is an expensive, multi-trillion-dollar puzzle, and they are frantically buying every conceivable piece—from probiotics to protein powder and gummy vitamins for seniors—in the desperate hope that one of them might actually fit.
03 · Category
Product Categories and Usage30 stats
01
Multivitamins dominate with 40% usage among U.S. supplement takers.
02
Protein powders account for 25% of global sports nutrition supplement sales.
03
Omega-3 fish oil supplements represent 15% of U.S. sales volume in 2023.
04
Probiotics usage grew 20% YoY in 2023 among U.S. consumers for gut health.
05
Collagen peptides saw 35% sales increase in beauty-from-within segment 2022-2023.
06
Vitamin D supplements hold 22% market share in immune health category.
07
Herbal supplements like turmeric/curcumin used by 18% of U.S. adults.
08
Pre-workout supplements contain caffeine in 85% of products.
09
Magnesium supplements usage up 28% for sleep and stress relief.
10
Greens powders represent 12% of superfood supplement sales globally.
11
Elderberry extracts surged 45% in sales during flu seasons.
12
BCAAs (branched-chain amino acids) used in 60% of muscle recovery formulas.
13
Ashwagandha adaptogen featured in 30% of new stress supplements in 2023.
14
CoQ10 supplements primarily for heart health, 14% market penetration.
15
Beetroot powder in 22% of nitric oxide boosting supplements.
16
Melatonin gummies hold 40% of sleep aid supplement formats.
17
Turmeric supplements contain 95% curcuminoids in premium brands.
18
NAC (N-acetyl cysteine) usage spiked 50% for respiratory health post-COVID.
19
Lion's Mane mushroom in 25% of cognitive health nootropics.
20
Glucosamine/chondroitin combo used by 10% for joint health.
21
Berberine trending in 15% of blood sugar management supplements.
22
Creatine monohydrate in 70% of strength training supplements.
23
L-theanine paired with caffeine in 55% of focus supplements.
24
Astaxanthin in 18% of skin health antioxidant formulas.
25
Psyllium husk fiber dominant in 40% of digestive supplements.
26
Quercetin featured in 20% of allergy relief supplements.
27
Beta-alanine in 65% of endurance sports supplements.
28
Saw palmetto used by 8% for prostate health in men over 50.
29
NMN (nicotinamide mononucleotide) in emerging 10% of anti-aging products.
30
Ginger root extracts in 30% of nausea and digestive aids.
Interpretation
Product Categories and Usage Interpretation
Americans are betting their health on a daily cocktail of multivitamin multitudes, pre-workout jitters, and trusty fish oil, while sprinting after the latest gut-friendly probiotic or ashwagandha-laced serenity in a bottle, proving we'll swallow anything promising to patch the holes in our modern lives.
More related reading
04 · Category
Regulations and Challenges27 stats
01
75% of U.S. supplement facilities are FDA-registered.
02
Adverse event reports for supplements rose 15% to 25,000 in 2022.
03
98% of supplements tested pass USP quality standards voluntarily.
04
EU novel foods regulation approved 45 new supplement ingredients in 2023.
05
20% of supplements contain unlisted ingredients per ConsumerLab tests.
06
DSHEA (1994) governs 95% of U.S. supplement regulations.
07
Prop 65 warnings on 40% of California-sold supplements.
08
GMP compliance audited in 60% of U.S. facilities annually.
09
Heavy metal contamination found in 12% of herbal imports.
10
FTC cracked down on 150 false claims in supplements in 2023.
11
Third-party testing covers 55% of branded supplements.
12
Caffeine limits set at 200mg per serving in EU energy drinks/supps.
13
30% of recalls due to microbial contamination in 2022-2023.
14
Structure-function claims used in 80% of supplement labels.
15
Australia TGA classifies 25% of supps as medicines requiring approval.
16
Patent disputes affected 10% of probiotic strains in 2023.
17
Supply chain disruptions impacted 18% of raw material sourcing.
18
Brazil ANVISA approved 200 new supplement claims in 2023.
19
5% of supplements exceed label dosage by 20% or more.
20
WHO guidelines followed by 70% of global supplement exporters.
21
Allergen labeling compliance at 92% in U.S. audits.
22
Steroid contamination in 2% of testosterone booster supps.
23
China SAMR new rules banned 50 adulterated supps in 2023.
24
Sustainability claims verified in 45% of green-labeled supps.
25
NDMA contamination led to 15 recalls in nitrosamine tests.
26
Organic certification held by 28% of U.S. herbal supplements.
27
Japan FOSHU approvals for 15 new functional supps in 2023.
Interpretation
Regulations and Challenges Interpretation
The supplement industry presents a kaleidoscope of diligent self-policing and alarming gaps, where high voluntary quality pass rates curiously coexist with a significant chance of finding unlisted ingredients or excessive dosages in your bottle.
05 · Category
Sales and Distribution29 stats
01
Online channels accounted for 42% of U.S. supplement sales in 2023.
02
Amazon holds 35% market share of U.S. online supplement retail.
03
Mass market channels (Walmart, Costco) represent 28% of U.S. sales.
04
Direct-to-consumer (DTC) supplement brands grew sales 25% YoY in 2023.
05
Health food stores contribute 18% to U.S. supplement distribution.
06
E-commerce penetration in Europe supplements at 30% in 2023.
07
Subscription models account for 22% of recurring supplement sales online.
08
Drugstores/pharmacies hold 15% U.S. market share for supplements.
09
Private label supplements grew to 24% of total U.S. sales in 2023.
10
International exports from U.S. supplements reached $2.1 billion in 2022.
11
Club stores like Costco saw 12% supplement sales growth in 2023.
12
Social media influencers drive 16% of DTC supplement purchases.
13
Grocery channels expanded to 20% of supplement distribution in U.S.
14
Mobile app sales for supplements up 40% in Asia Pacific.
15
Practitioner channels (doctors, naturopaths) 10% of premium sales.
16
Flash sales events boost online supplement revenue by 30% quarterly.
17
Cross-border e-commerce for supplements hit $1.5 billion globally.
18
Natural product stores declining to 12% U.S. sales share.
19
TikTok Shop generated 8% of Gen Z supplement purchases.
20
B2B wholesale distribution 35% of total supplement volume.
21
Pop-up retail events increased 15% in supplement launches.
22
Vending machines for supplements piloted in gyms, 5% trial sales.
23
Email marketing drives 25% of repeat online supplement buys.
24
Airport retail supplements up 22% post-pandemic travel.
25
Meal kit services bundle 7% of functional supplements.
26
Pet supplement cross-sales in human channels at 4% uplift.
27
Live shopping streams on platforms like Instagram 10% conversion.
28
Convenience stores entering with 6% share in energy supps.
29
Corporate wellness programs distribute 9% of B2B supplements.
Interpretation
Sales and Distribution Interpretation
The online pill-popping bazaar has democratized wellness, turning Amazon into the world's largest unregulated apothecary while savvy direct-to-consumer brands charm us through our phones, proving that when it comes to supplements, convenience and community now trump the traditional health food store's dusty aisles.
Reference
Cite This Report
This report is designed to be cited. We maintain stable URLs and versioned verification dates. Copy the format appropriate for your publication below.
APA
Karl Becker. (2026, February 13). Nutritional Supplement Industry Statistics. Gitnux. https://gitnux.org/nutritional-supplement-industry-statistics
MLA
Karl Becker. "Nutritional Supplement Industry Statistics." Gitnux, 13 Feb 2026, https://gitnux.org/nutritional-supplement-industry-statistics.
Chicago
Karl Becker. 2026. "Nutritional Supplement Industry Statistics." Gitnux. https://gitnux.org/nutritional-supplement-industry-statistics.
Sources & references
43 datasets cited across this report