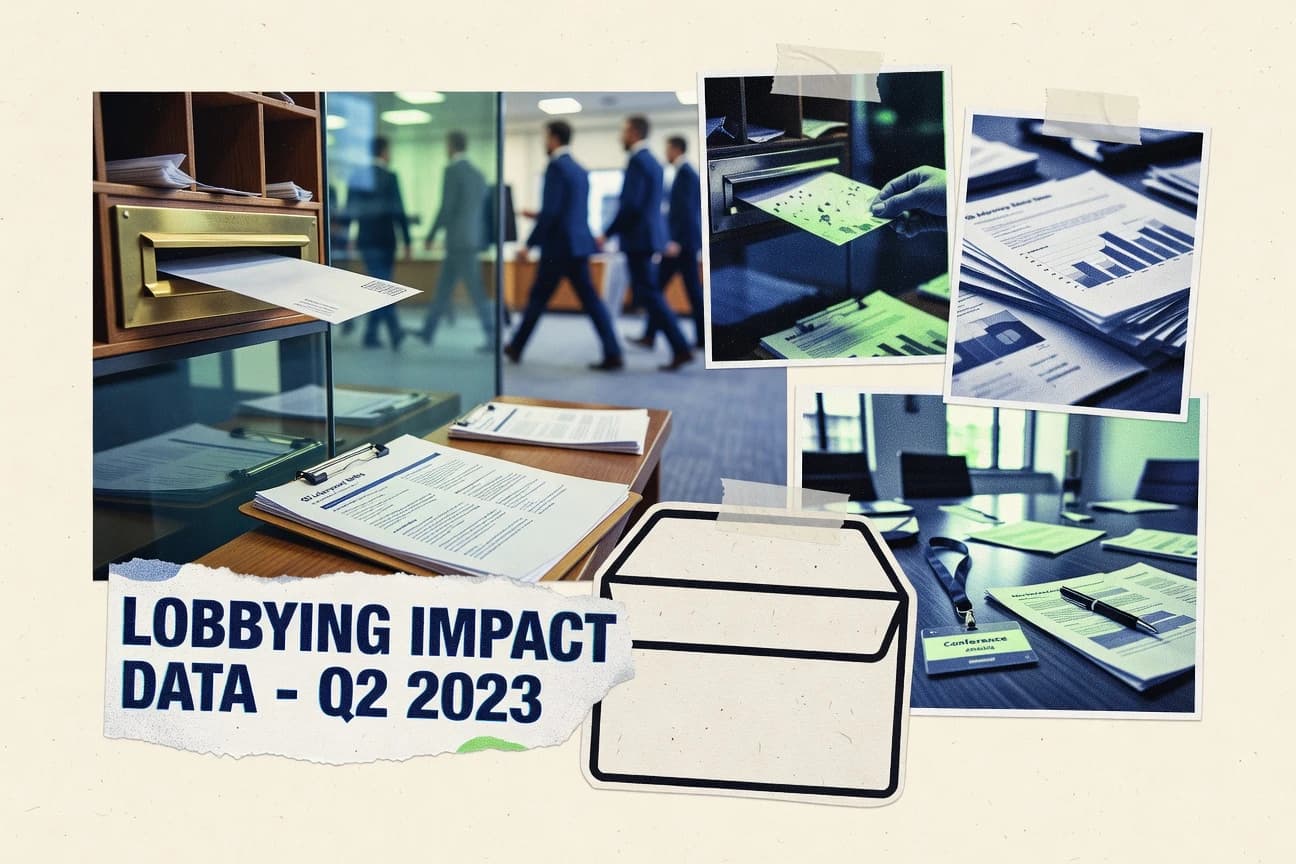

More than 6.3 million lobbying meetings are estimated to happen with US federal officials each year, yet the paper trail is far thinner than you might expect. Just 2.7% of US lobbyists reported at least one indirect lobbying activity category in 2023 disclosures. When you stack that against 8,014 active foreign principal registrations under FARA and the growing reliance on monitoring and compliance tools, you start to see why lobbying data can feel inconsistent and worth a closer look.
Key Takeaways
- 2.7% of US lobbyists reported at least one ‘indirect lobbying’ activity category in their disclosures in 2023 (share from disclosure dataset analytics)
- 8.0% of US federal lobbyist reports in 2023 cited ‘trade associations’ as the primary client type (from disclosure dataset analysis)
- 2.6 million unique individuals are estimated to participate in lobbying and associated public affairs activities in the US (estimate from industry survey summarized in a peer-reviewed report on political advocacy labor)
- 2,000+ lobbying reports were filed for US Senate in 2023 (LD-2 forms and related disclosures)
- A total of 8,014 active foreign principal registrations were reported to the US Department of Justice in 2023 under FARA (Foreign Agents Registration Act)
- 2,200+ new FARA filings were made in 2023 (new registration or supplemental filings as tracked in DOJ public reporting)
- 52% of US lobbyists reported using centralized case-management or compliance software to manage disclosure requirements (industry survey estimate in a vendor research report)
- 28% of lobbying professionals reported adopting AI-assisted research tools for issue tracking in 2024 (vendor survey figure)
- 25% of EU citizens reported being aware of the EU Transparency Register in 2022 (Eurobarometer evidence reported in EC transparency evaluation)
- 40% of US lobbyists indicated they spend more time on compliance-related tasks than on relationship-building in the post-disclosure era (industry survey figure)
- 52% of lobbying firms reported that clients demand real-time monitoring of regulatory and legislative developments (vendor survey figure in 2024)
- 2.0% of legislative hearings in the US in 2022 included at least one witness who is a lobbyist (analysis from a legislative transcript dataset study)
- 3.8% annual growth in the US lobbying services market between 2022 and 2024 (forecast figure from industry market analysis)
- 39% of lobbyists reported that their disclosures include multiple issue areas (measured as share of lobbyists with multi-issue disclosures).
- 13.2% of registered lobbyists reported having a former government role (measured as share of lobbyists with “former government” experience reported in survey panel data).
In 2023, lobbying and foreign influence activity expanded across US and EU disclosure systems, with growing compliance and monitoring.
Related reading
01 · Category
Compliance & Rules1 stats
01
2.7% of US lobbyists reported at least one ‘indirect lobbying’ activity category in their disclosures in 2023 (share from disclosure dataset analytics)
Interpretation
Compliance & Rules Interpretation
In the Compliance & Rules arena, only 2.7% of US lobbyists reported at least one indirect lobbying activity category in their 2023 disclosures, suggesting that such indirect conduct is comparatively rare in the compliance reporting data.
02 · Category
Lobbyist Supply2 stats
01
8.0% of US federal lobbyist reports in 2023 cited ‘trade associations’ as the primary client type (from disclosure dataset analysis)
02
2.6 million unique individuals are estimated to participate in lobbying and associated public affairs activities in the US (estimate from industry survey summarized in a peer-reviewed report on political advocacy labor)
Interpretation
Lobbyist Supply Interpretation
In the Lobbyist Supply category, trade associations make up the primary client type for 8.0% of US federal lobbyist reports in 2023, and with 2.6 million unique individuals estimated to work on lobbying and related public affairs, the supply of lobbying activity appears broadly distributed rather than limited to a narrow set of major client relationships.
03 · Category
Lobbying Activity8 stats
01
2,000+ lobbying reports were filed for US Senate in 2023 (LD-2 forms and related disclosures)
02
A total of 8,014 active foreign principal registrations were reported to the US Department of Justice in 2023 under FARA (Foreign Agents Registration Act)
03
2,200+ new FARA filings were made in 2023 (new registration or supplemental filings as tracked in DOJ public reporting)
04
6.3 million annual ‘lobbying meetings’ in the US are estimated to occur with federal officials (meeting counts summarized in a peer-reviewed study of lobbying interactions)
05
17.5% of US Congress members met at least once with a registered lobbyist in 2022 (documented in a study analyzing disclosed meeting patterns)
06
1.5 million pages of legislative texts were published in the EU in 2022 (baseline volume used in estimating stakeholder interaction frequency)
07
9,800+ FARA filings were made in 2023 total across registrations and supplements (DOJ FARA annual report totals)
08
1,300+ lobbying-related meetings were reported in a sample study of US agency interactions in 2021 (peer-reviewed study sample count)
Interpretation
Lobbying Activity Interpretation
In the Lobbying Activity category, US lobbying appears highly sustained and wide-reaching, with 6.3 million estimated federal official meetings and 2,200 plus new FARA filings in 2023, alongside 2,000 plus Senate LD-2 reports and 9,800 plus total FARA submissions.
04 · Category
User Adoption5 stats
01
52% of US lobbyists reported using centralized case-management or compliance software to manage disclosure requirements (industry survey estimate in a vendor research report)
02
28% of lobbying professionals reported adopting AI-assisted research tools for issue tracking in 2024 (vendor survey figure)
03
25% of EU citizens reported being aware of the EU Transparency Register in 2022 (Eurobarometer evidence reported in EC transparency evaluation)
04
46% of EU citizens said they would use transparency registers to check who influences EU policies (Eurobarometer-derived from EC transparency surveys)
05
38% of lobbying firms use media-monitoring services daily (trade survey reported in industry publication 2024)
Interpretation
User Adoption Interpretation
User adoption is uneven but clearly growing, with 52% of US lobbyists already using centralized compliance software and 38% of firms using daily media monitoring, while only 25% of EU citizens are aware of the Transparency Register, showing that awareness and intended use have to catch up even as tools for disclosure and issue tracking spread.
05 · Category
Industry Trends3 stats
01
40% of US lobbyists indicated they spend more time on compliance-related tasks than on relationship-building in the post-disclosure era (industry survey figure)
02
52% of lobbying firms reported that clients demand real-time monitoring of regulatory and legislative developments (vendor survey figure in 2024)
03
2.0% of legislative hearings in the US in 2022 included at least one witness who is a lobbyist (analysis from a legislative transcript dataset study)
Interpretation
Industry Trends Interpretation
In industry trends, the post-disclosure era has shifted lobbying toward compliance work and speed, with 40% of US lobbyists spending more time on compliance than relationship-building, 52% of firms needing real-time regulatory monitoring, and only 2.0% of 2022 hearings featuring lobbyist witnesses.
More related reading
06 · Category
Market Size1 stats
01
3.8% annual growth in the US lobbying services market between 2022 and 2024 (forecast figure from industry market analysis)
Interpretation
Market Size Interpretation
The US lobbying services market is forecast to expand at a 3.8% annual rate from 2022 to 2024, signaling steady growth in market size within the Lobbying category.
07 · Category
Disclosure Patterns1 stats
01
39% of lobbyists reported that their disclosures include multiple issue areas (measured as share of lobbyists with multi-issue disclosures).
Interpretation
Disclosure Patterns Interpretation
In Disclosure Patterns, 39% of lobbyists report multi-issue disclosures, suggesting that a substantial share of lobbying activity is packaged across several issue areas rather than being kept narrowly focused.
08 · Category
Workforce Demographics2 stats
01
13.2% of registered lobbyists reported having a former government role (measured as share of lobbyists with “former government” experience reported in survey panel data).
02
31% of lobbying professionals reported having 6–10 years of experience (measured as experience-band distribution from a workforce survey).
Interpretation
Workforce Demographics Interpretation
In workforce demographics, 13.2% of registered lobbyists bring prior government experience while 31% have 6 to 10 years of experience, suggesting a blend of established public sector connections and mid career professional depth.
09 · Category
Regulatory Influence4 stats
01
1.8 million comments were submitted to US federal agencies in 2023 (measured as total public comments received by agencies for rulemaking tracked in a federal rulemaking dataset).
02
7,200+ distinct rulemaking dockets were opened in 2023 (measured as number of rulemaking dockets initiated in the year).
03
27% of surveyed lobbyists reported using coalition-building as a primary strategy for major rule changes (measured as survey share by top strategy).
04
64% of organizations reported that they submit written materials (policy papers, testimony, or comment letters) at least quarterly (measured as reported frequency).
Interpretation
Regulatory Influence Interpretation
In the regulatory influence arena, the flood of 1.8 million public comments and 7,200-plus rulemaking dockets in 2023 shows how heavily agencies face external input, while 64% of organizations submitting written materials at least quarterly and 27% of lobbyists relying on coalition building suggest that sustained, coordinated engagement is a defining trend.
Reference
Cite This Report
This report is designed to be cited. We maintain stable URLs and versioned verification dates. Copy the format appropriate for your publication below.
APA
Leah Kessler. (2026, February 13). Lobbying Statistics. Gitnux. https://gitnux.org/lobbying-statistics
MLA
Leah Kessler. "Lobbying Statistics." Gitnux, 13 Feb 2026, https://gitnux.org/lobbying-statistics.
Chicago
Leah Kessler. 2026. "Lobbying Statistics." Gitnux. https://gitnux.org/lobbying-statistics.
Sources & references
27 datasets cited across this report · attribution is report-level
+5 additional datasets cited (not shown individually)