
In the ever-evolving world of investments, staying on top of your financial game is vital for success. One reliable way to assess your investment portfolio’s performance and make informed decisions is through the utilization of key performance indicators (KPIs). These quantifiable measures allow investors to evaluate their investment choices and track progress against their financial goals.
In this comprehensive blog post, we will delve into the crucial Investment KPIs that every investor should be well-versed with, equipping you with the essential tools to optimize your portfolio and make smarter investment decisions. So, buckle up as we navigate the world of Investment KPIs and unlock the key to achieving your financial objectives.
Investment KPIs You Should Know
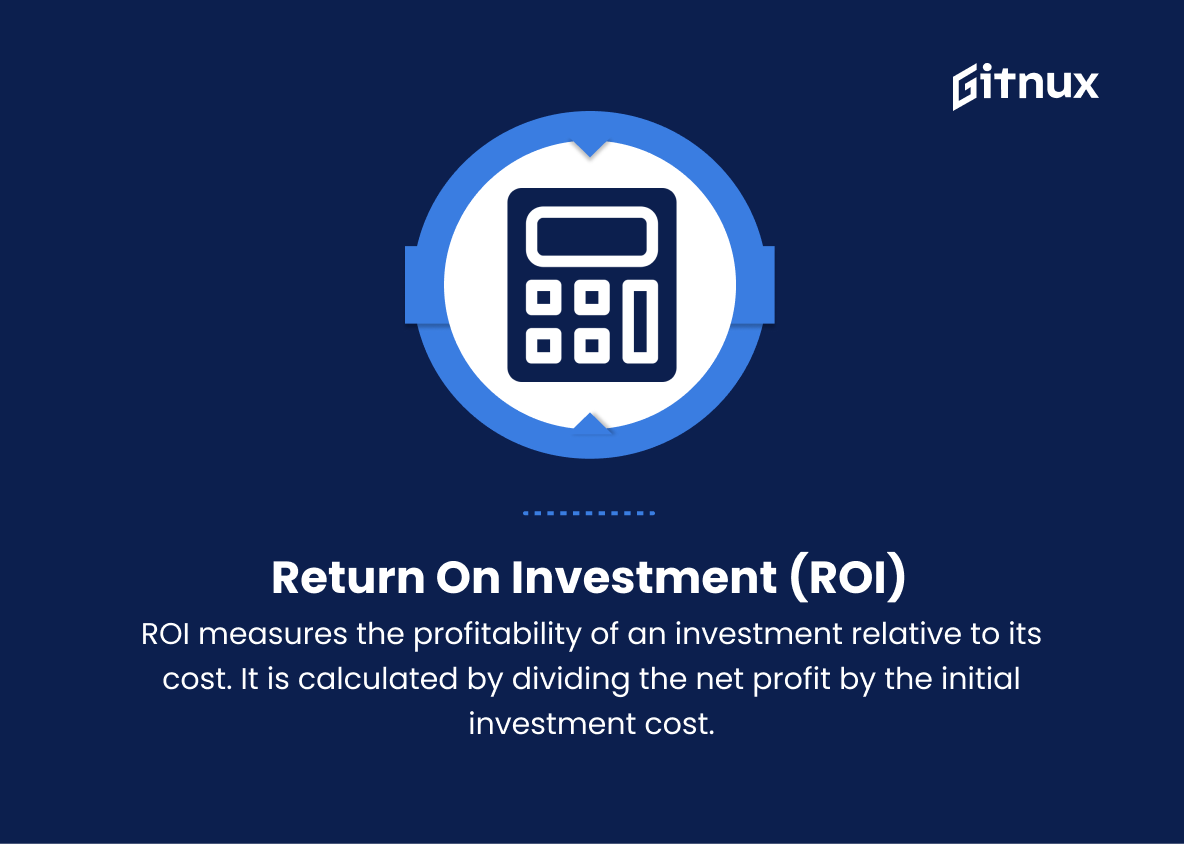
1. Return on Investment (ROI)
ROI measures the profitability of an investment relative to its cost. It is calculated by dividing the net profit by the initial investment cost.
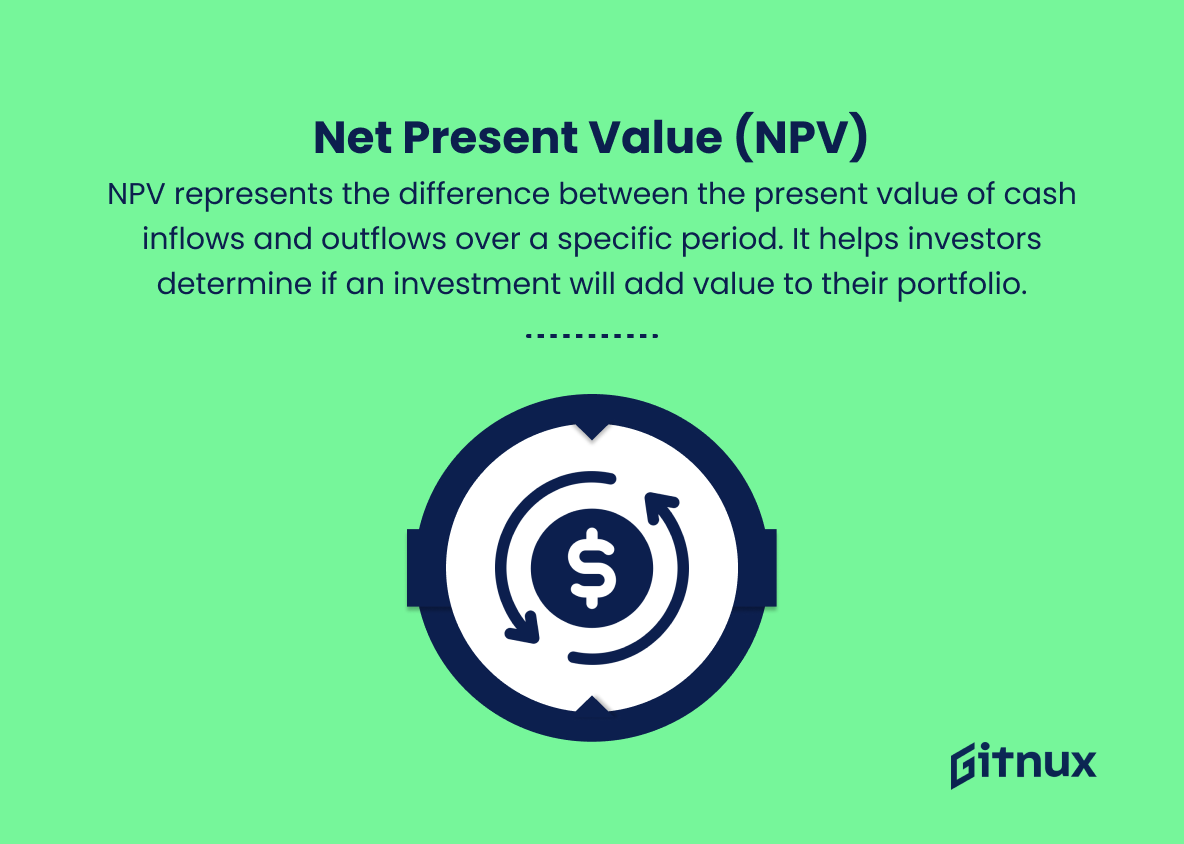
2. Net Present Value (NPV)
NPV represents the difference between the present value of cash inflows and outflows over a specific period. It helps investors determine if an investment will add value to their portfolio.
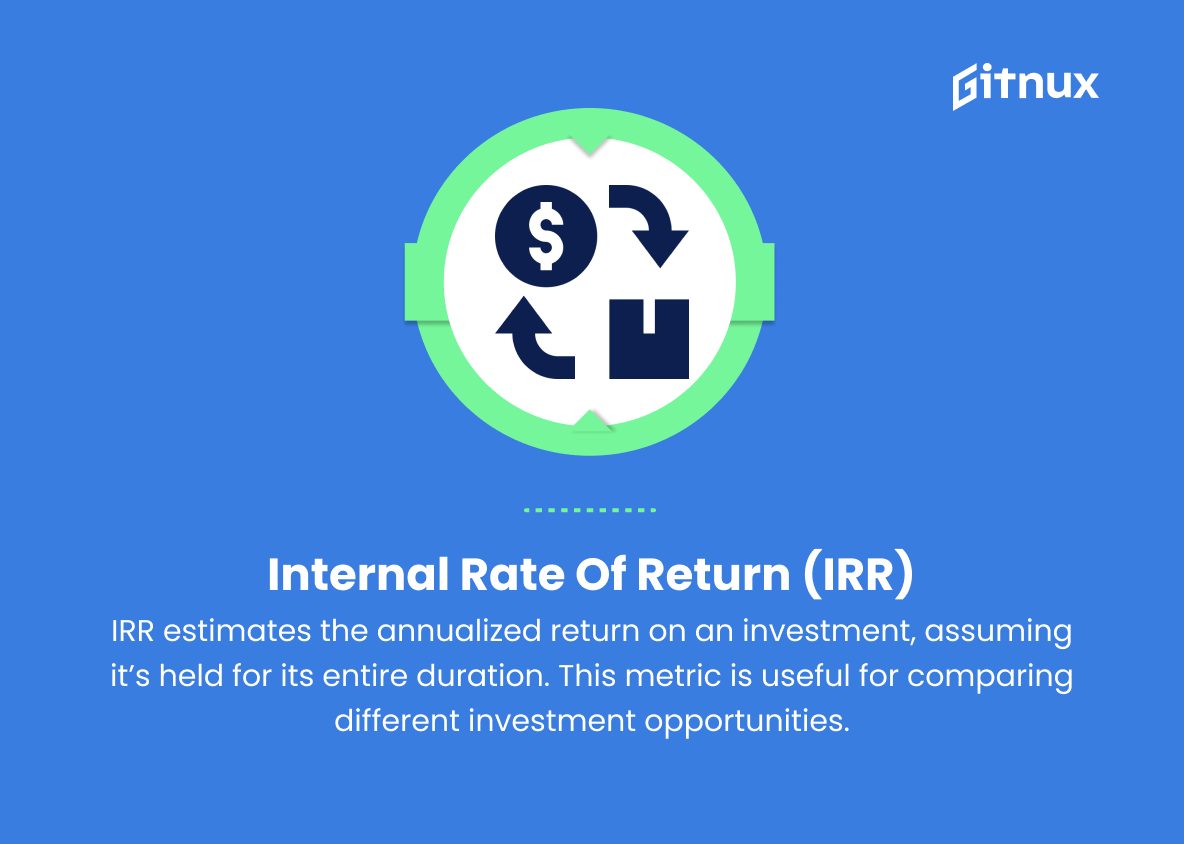
3. Internal Rate of Return (IRR)
IRR estimates the annualized return on an investment, assuming it’s held for its entire duration. This metric is useful for comparing different investment opportunities.
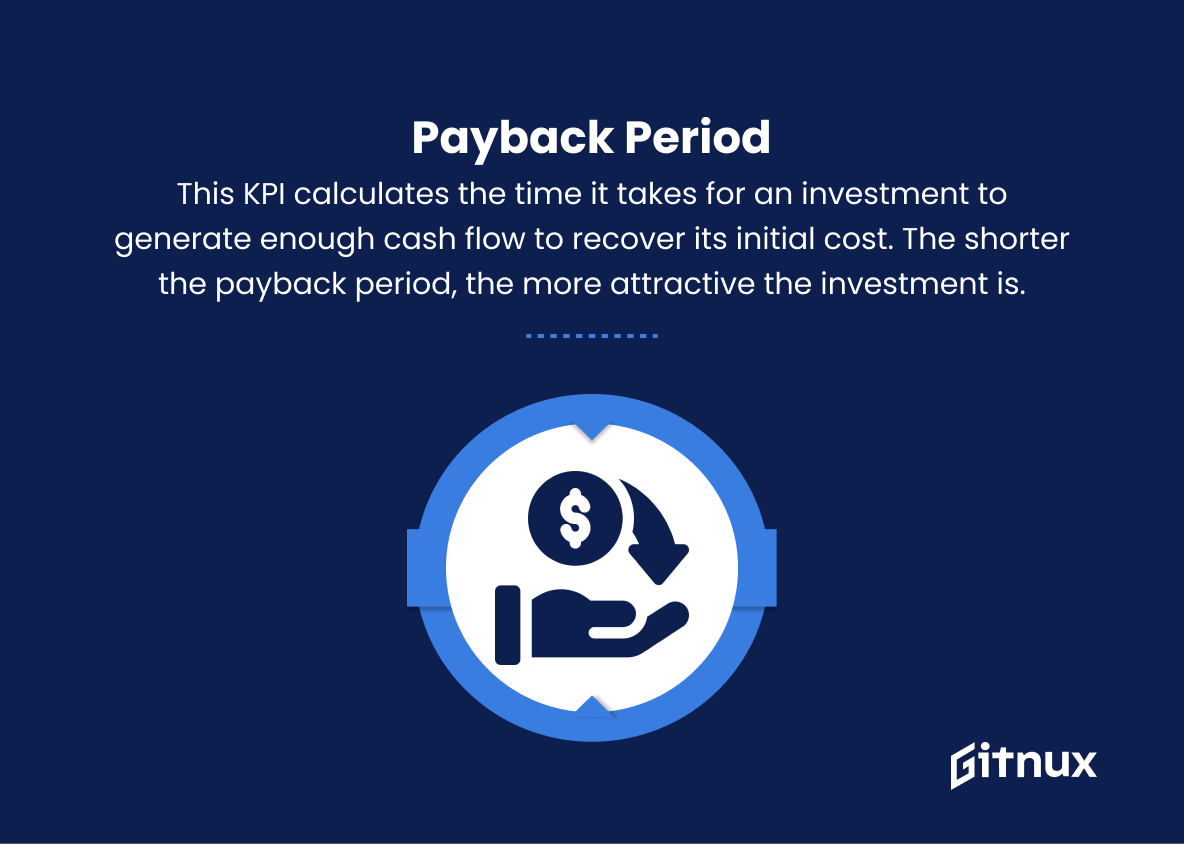
In the ever-evolving world of investments, staying on top of your financial game is vital for success.4. Payback Period
This KPI calculates the time it takes for an investment to generate enough cash flow to recover its initial cost. The shorter the payback period, the more attractive the investment is.
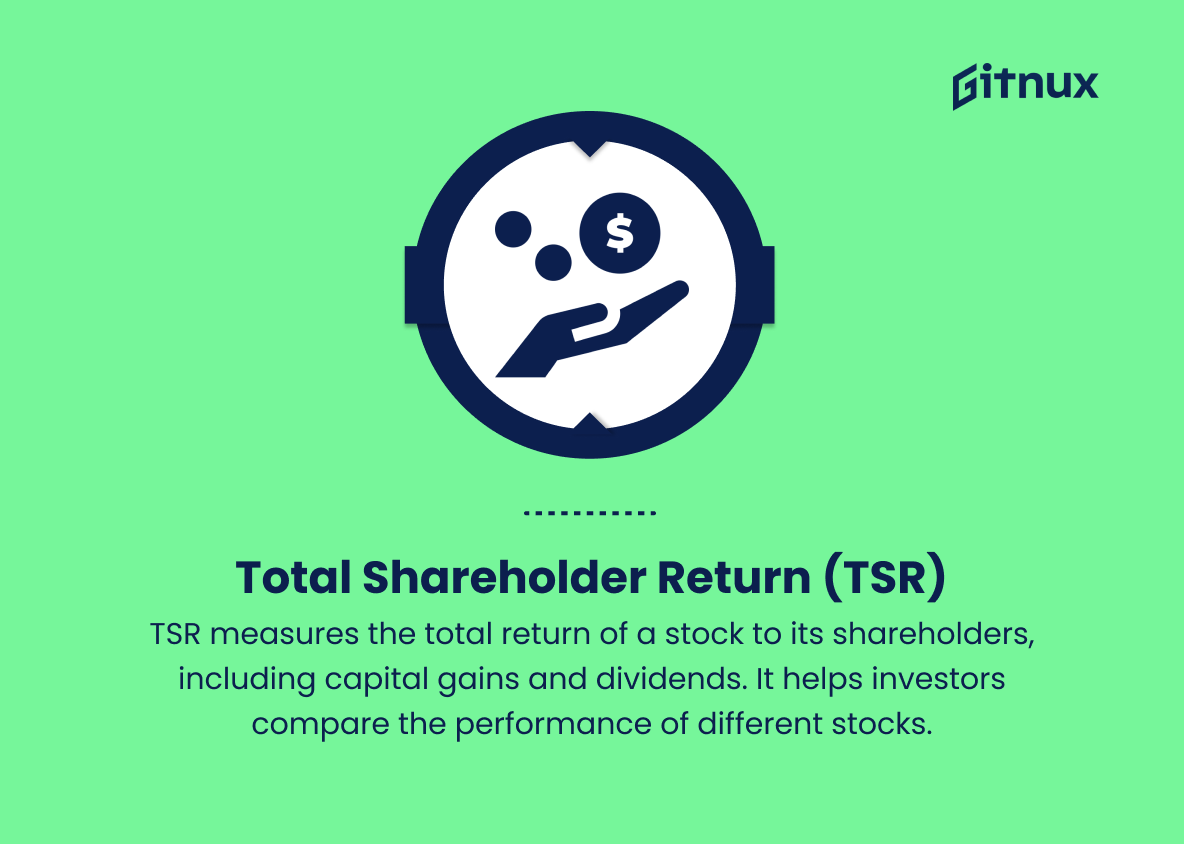
5. Total Shareholder Return (TSR)
TSR measures the total return of a stock to its shareholders, including capital gains and dividends. It helps investors compare the performance of different stocks.
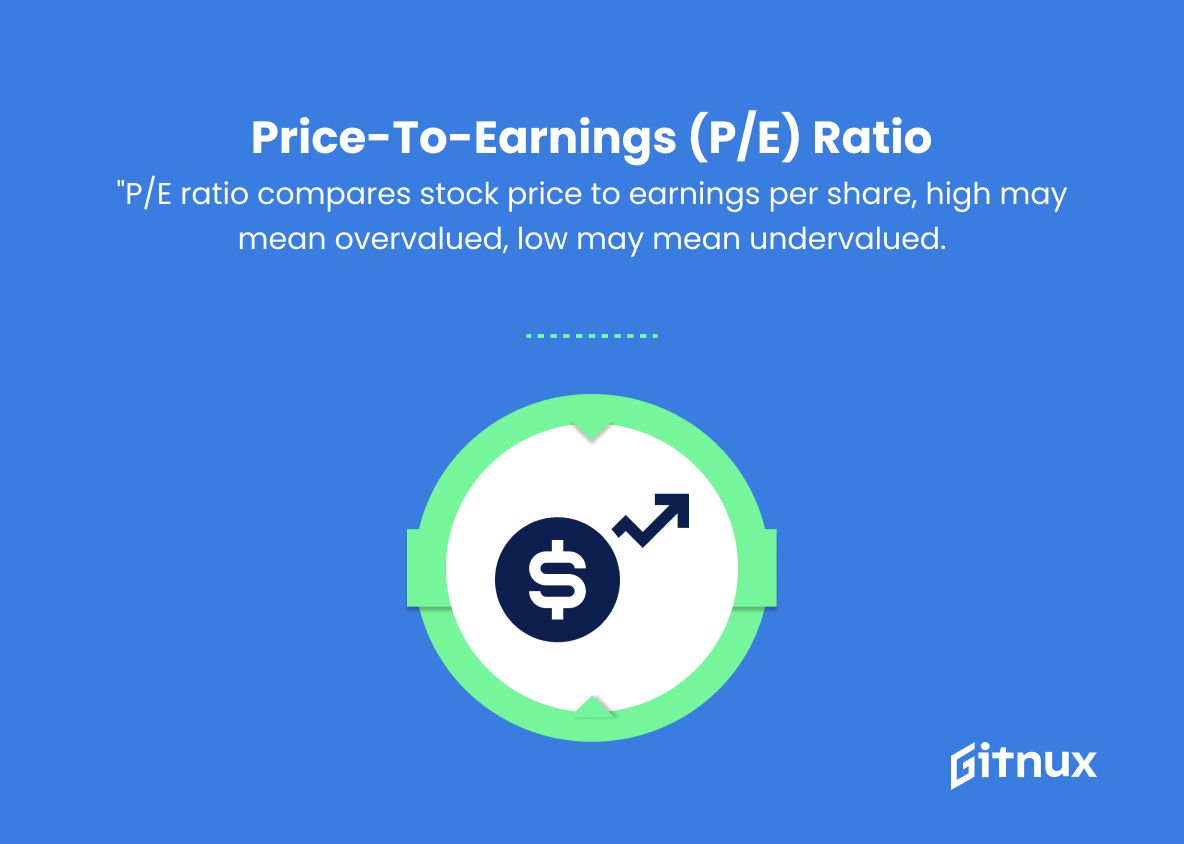
6. Price-to-Earnings (P/E) Ratio
P/E ratio compares a company’s current stock price to its earnings per share. A high P/E ratio may indicate that a stock is overvalued, while a low P/E ratio may suggest an undervalued stock.
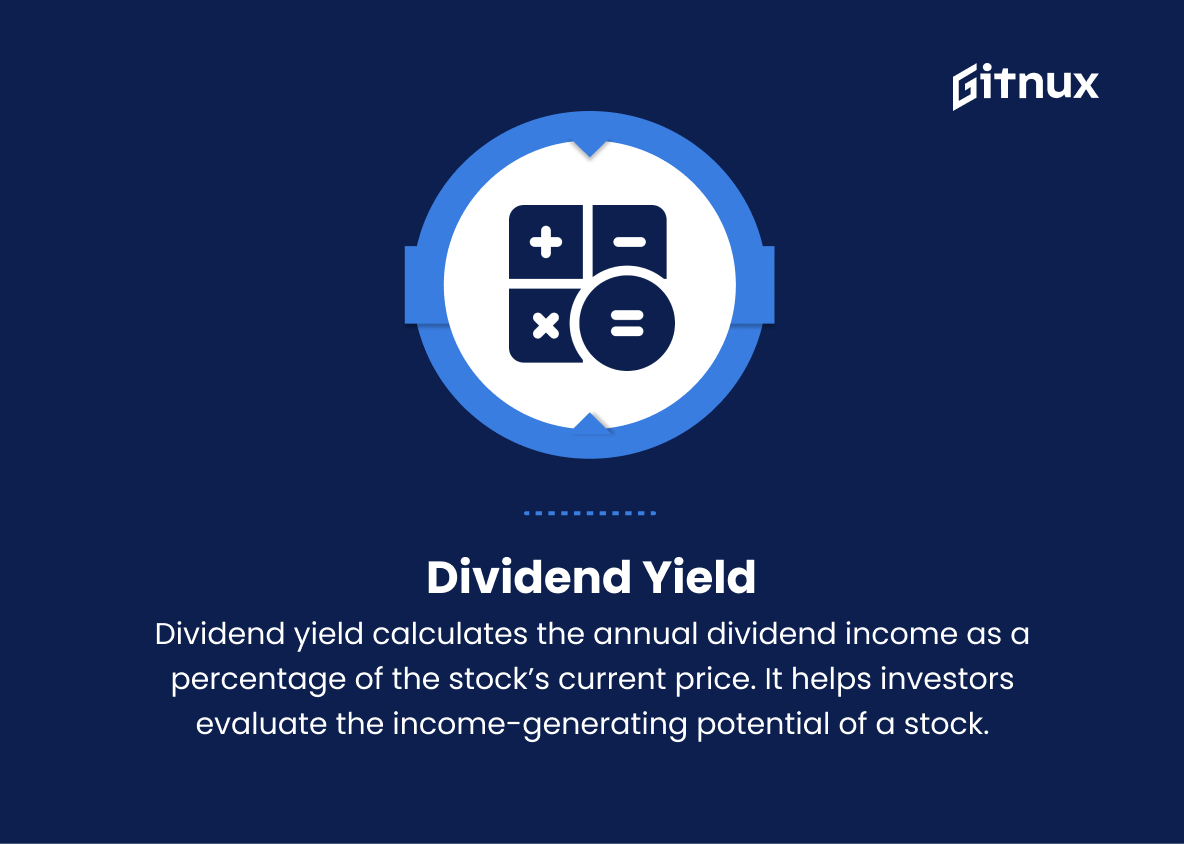
7. Dividend Yield
Dividend yield calculates the annual dividend income as a percentage of the stock’s current price. It helps investors evaluate the income-generating potential of a stock.
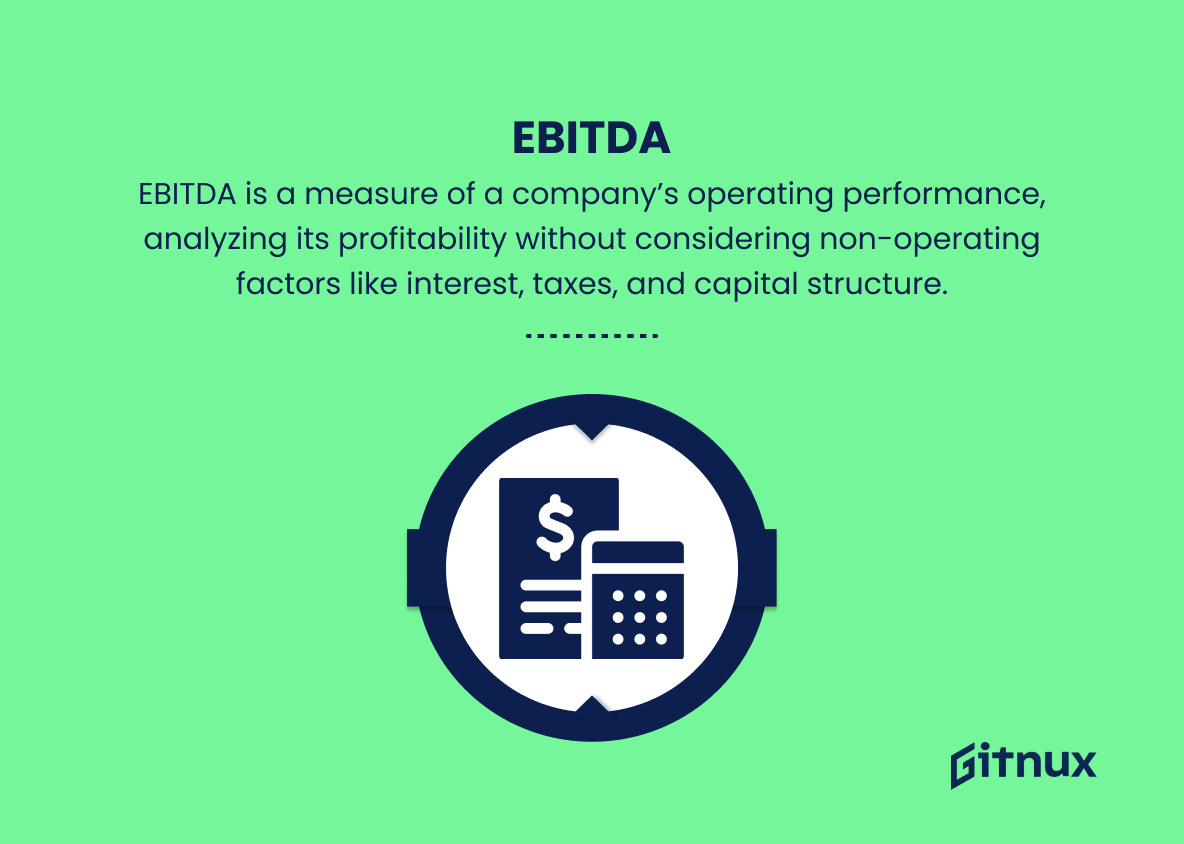
One reliable way to assess your investment portfolio’s performance and make informed decisions is through the utilization of key performance indicators (KPIs).8. Earnings Before Interest, Taxes, Depreciation, and Amortization (EBITDA)
EBITDA is a measure of a company’s operating performance, analyzing its profitability without considering non-operating factors like interest, taxes, and capital structure.
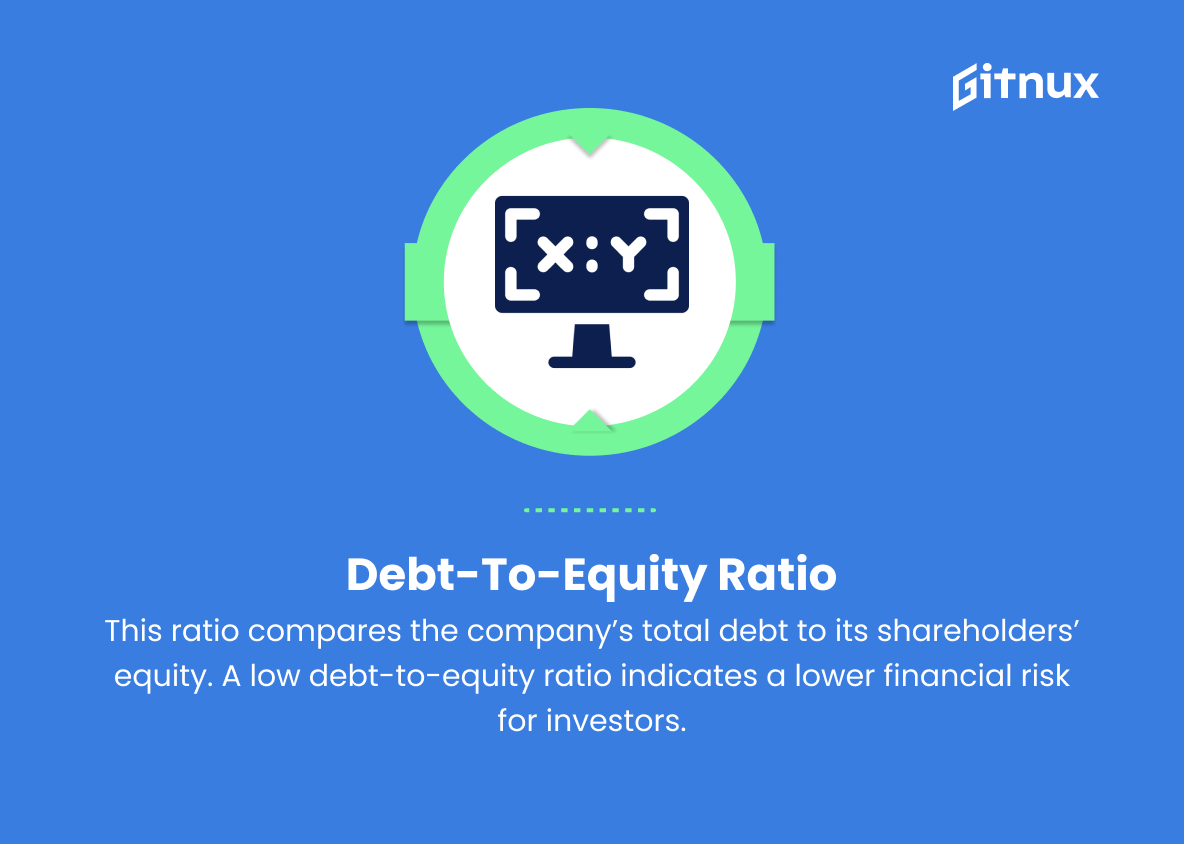
9. Debt-to-Equity Ratio
This ratio compares the company’s total debt to its shareholders’ equity. A low debt-to-equity ratio indicates a lower financial risk for investors.
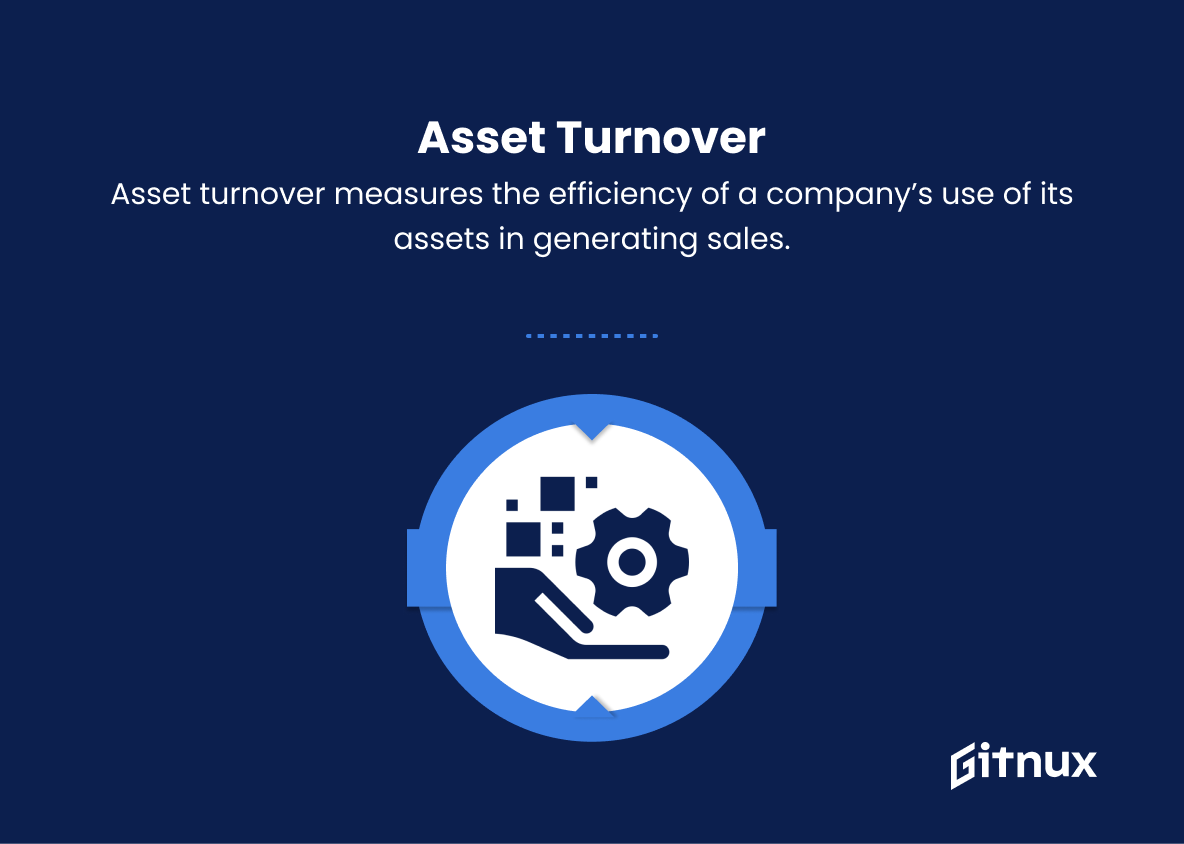
10. Asset Turnover
Asset turnover measures the efficiency of a company’s use of its assets in generating sales. Higher asset turnover indicates better management of assets and increased operational efficiency.
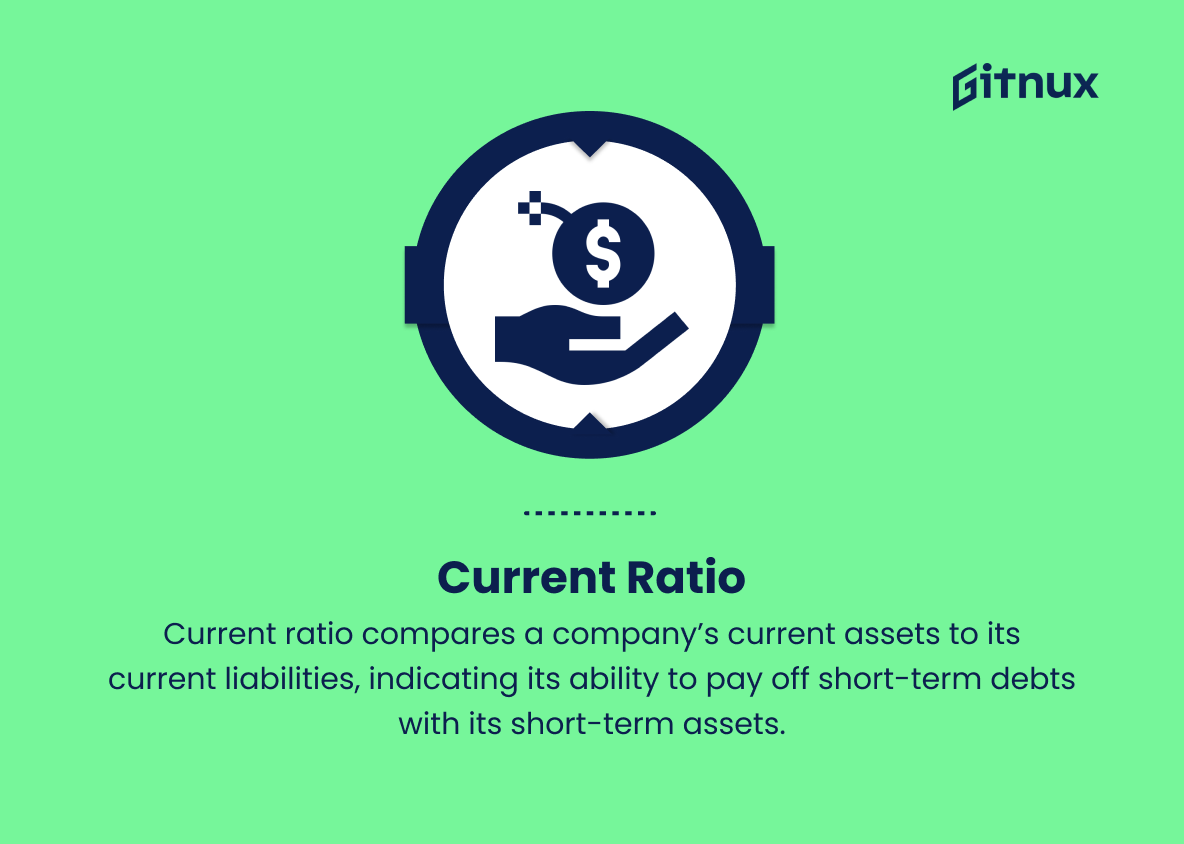
11. Current Ratio
Current ratio compares a company’s current assets to its current liabilities, indicating its ability to pay off short-term debts with its short-term assets.
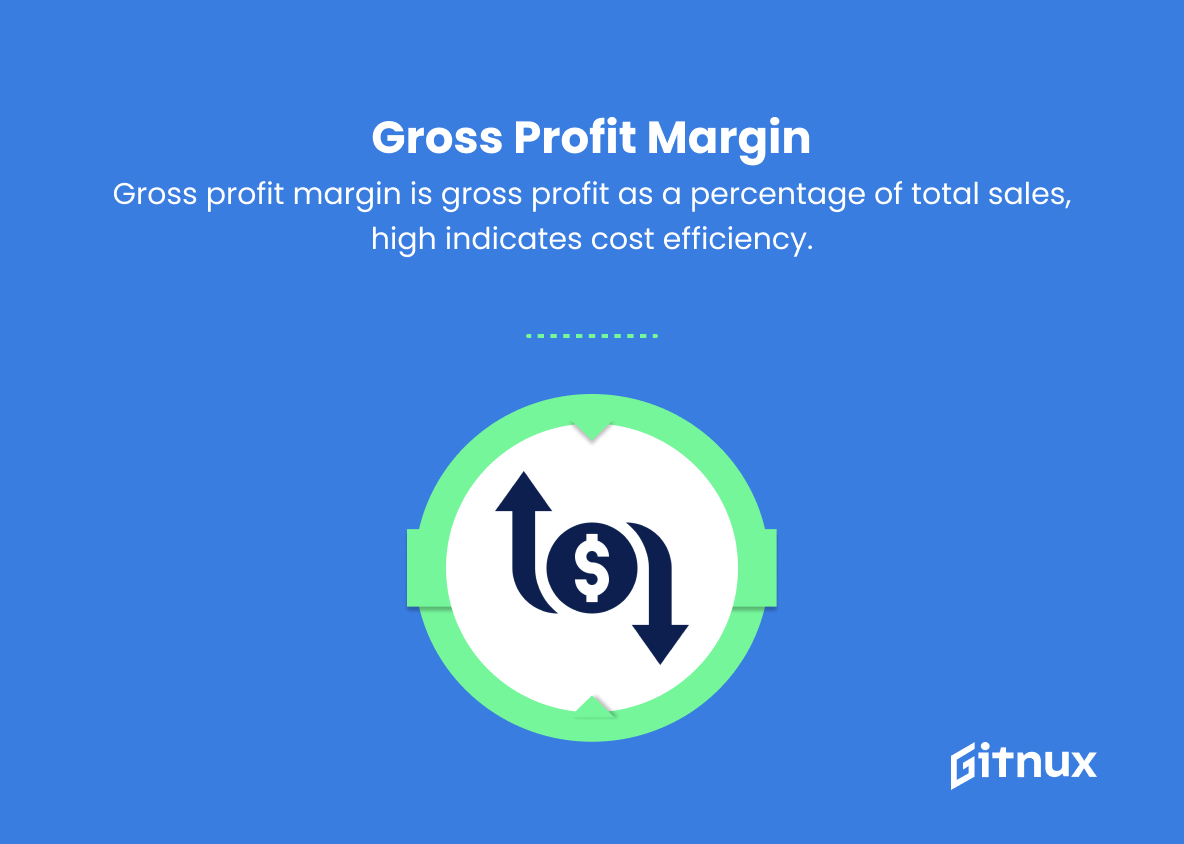
12. Gross Profit Margin
Gross profit margin expresses the company’s gross profit as a percentage of its total sales revenue. A high gross profit margin indicates that a company is efficient at managing its costs of goods sold.
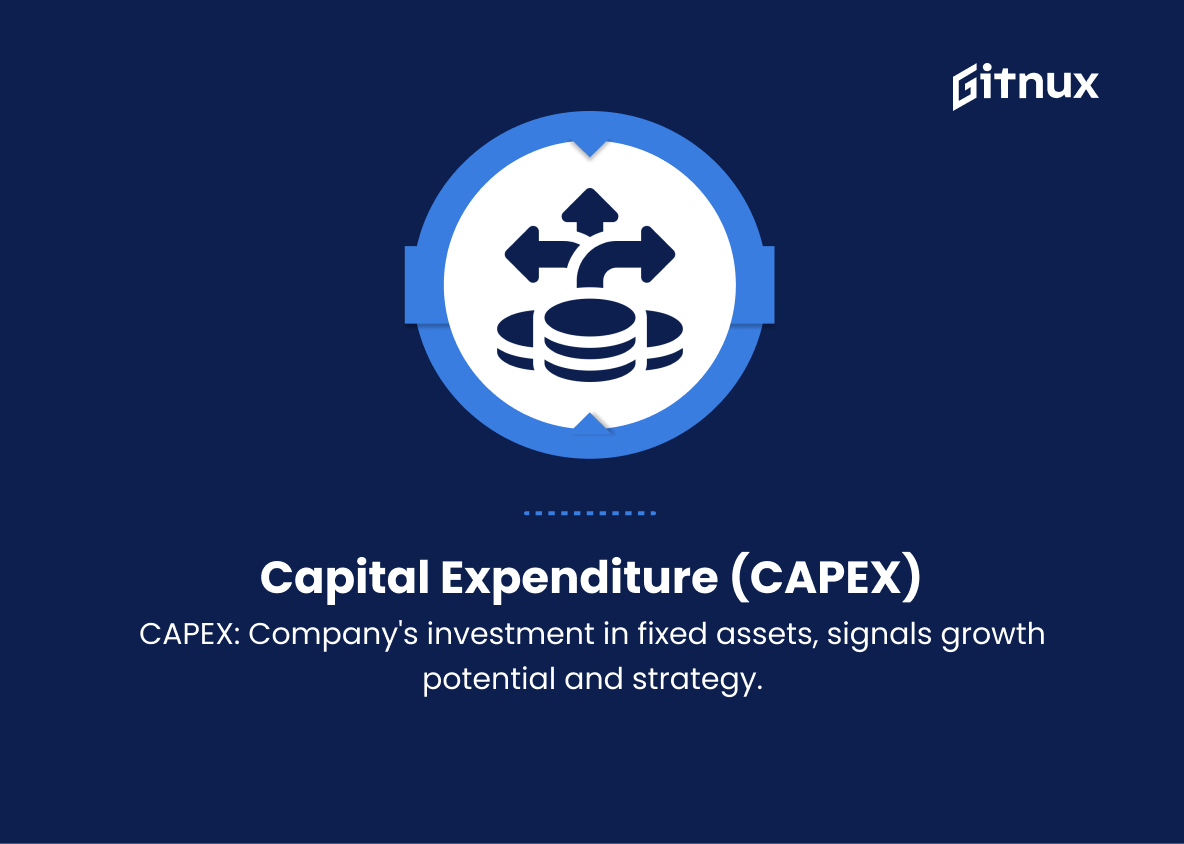
13. Capital Expenditure (CAPEX)
CAPEX is the amount a company invests in acquiring or maintaining fixed assets, such as property, plant, and equipment. This KPI helps investors understand a company’s growth potential and strategic investments.
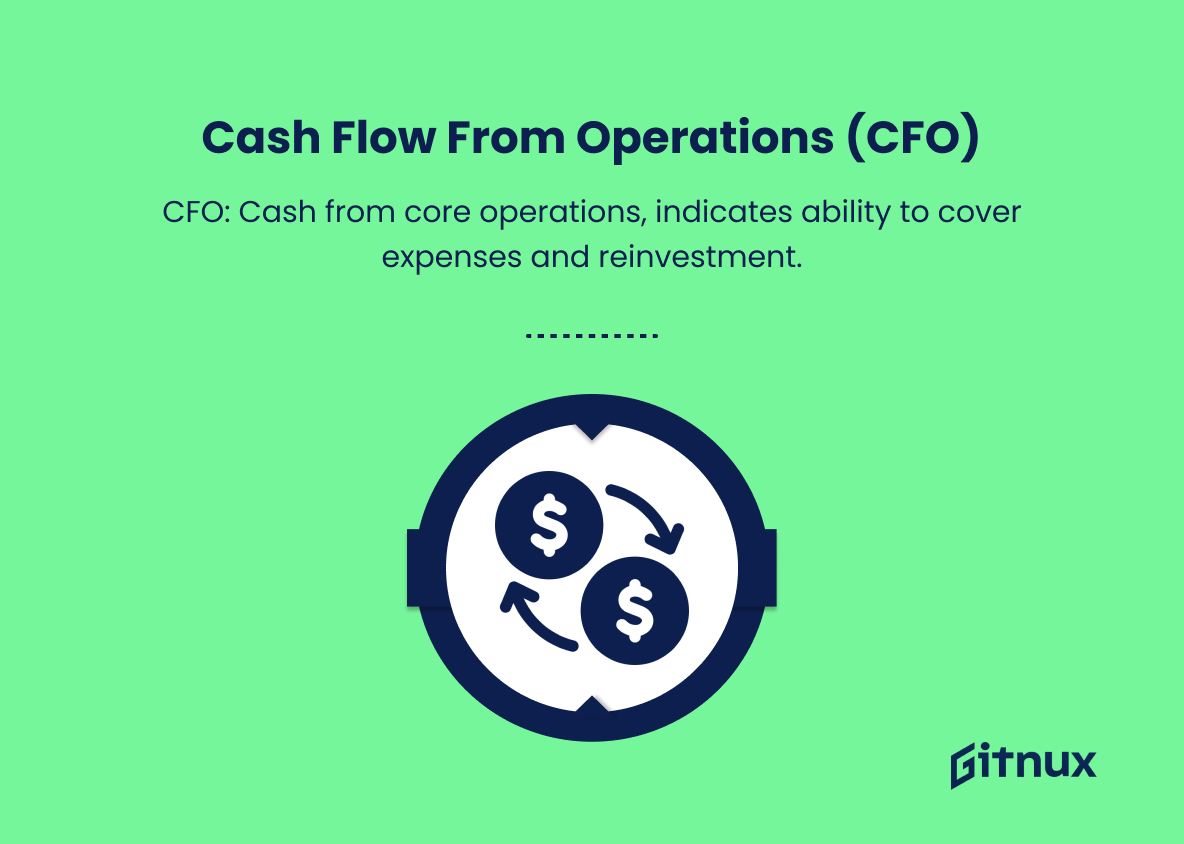
14. Cash Flow From Operations (CFO)
CFO measures the cash generated through a company’s core business operations. It helps investors determine if the company’s operations are sufficient to cover its expenses and reinvestment needs.
Investment KPIs Explained
Investment KPIs play a vital role in evaluating and comparing various investment opportunities, ensuring that investors make informed decisions that align with their financial goals. Return on Investment (ROI) showcases an investment’s profitability while Net Present Value (NPV) and Internal Rate of Return (IRR) help determine if an investment adds value to a portfolio. Payback Period and Total Shareholder Return (TSR) provide insights into the attractiveness and performance of investments.
Price-to-Earnings (P/E) Ratio and Dividend Yield assist in determining stock valuation and income-generating potential, while EBITDA highlights a company’s operational efficiency. Debt-to-Equity Ratio, Asset Turnover, and Current Ratio help assess a company’s financial risk, management effectiveness, and short-term solvency.
Finally, Gross Profit Margin, Capital Expenditure (CAPEX), and Cash Flow from Operations (CFO) offer insights into cost management, growth potential, and a company’s ability to cover its obligations and reinvestment needs, contributing valuable knowledge for investors in pursuit of the most suitable investments.
Conclusion
In conclusion, understanding and utilizing Investment KPIs is crucial for investors to make informed decisions and maximize returns. By monitoring vital metrics such as ROI, IRR, NPV, and multiples, investors can gain invaluable insights into the performance of their investments, allowing them to adjust their strategies, mitigate risks, and capitalize on opportunities.
In a rapidly evolving investment landscape, staying informed and adaptable is essential for long-term success, and Investment KPIs serve as the compass which guides investors through the complexities of the financial world.
