

In today’s highly competitive and data-driven banking industry, staying ahead of the curve is imperative for financial institutions seeking growth, stability, and overall success. One of the most effective ways to drive performance and boost customer satisfaction is by using Key Performance Indicators (KPIs) as a strategic tool to measure, analyze, and optimize banking operations.
This blog post aims to not only provide insight into vital Bank KPIs but also delve into their significance, implementation practices, and impact on a bank’s ability to thrive in an ever-evolving financial landscape. Let’s embark on a deep-dive exploration of Bank KPIs in order to enhance our understanding and empower financial institutions to achieve their objectives with precision and efficiency.
Bank KPIs You Should Know
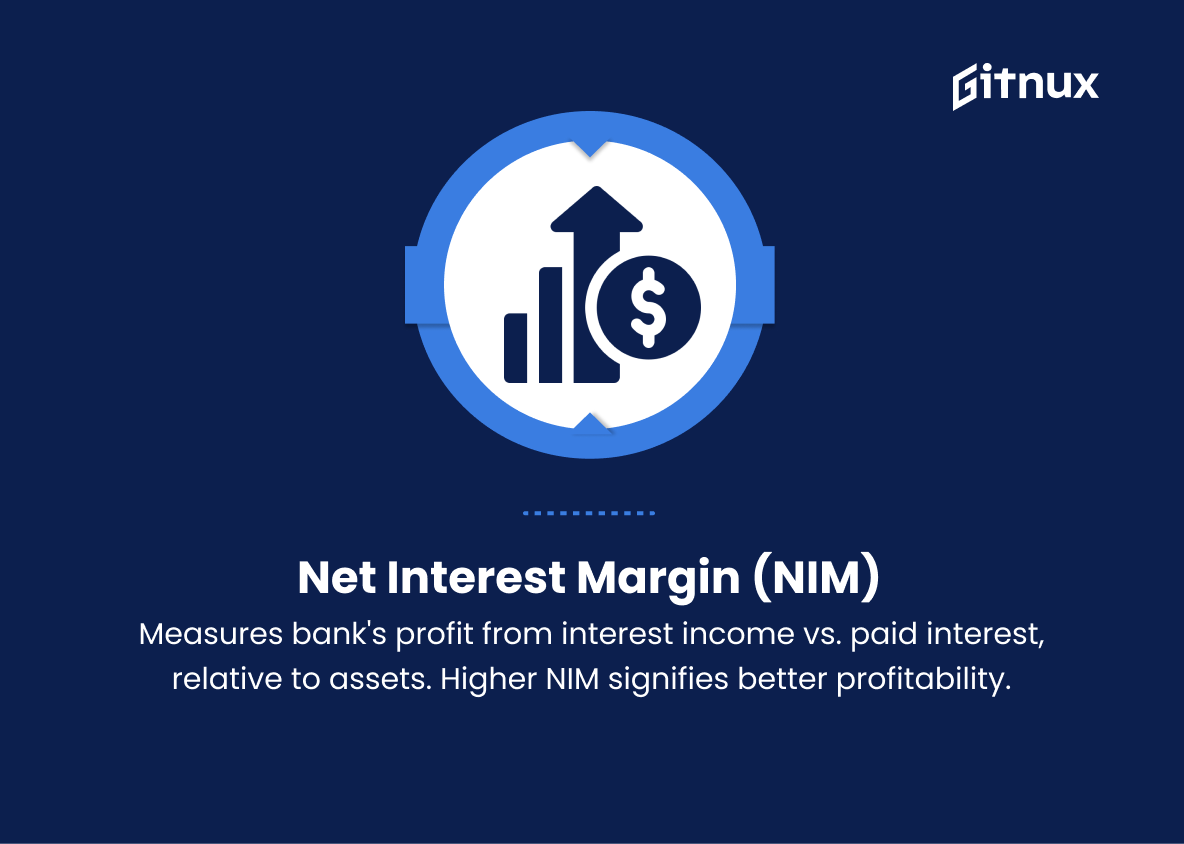
1. Net Interest Margin (NIM)
This KPI measures the difference between the interest income earned by the bank and the interest paid to depositors, relative to the bank’s interest-earning assets. A higher NIM indicates better profitability.
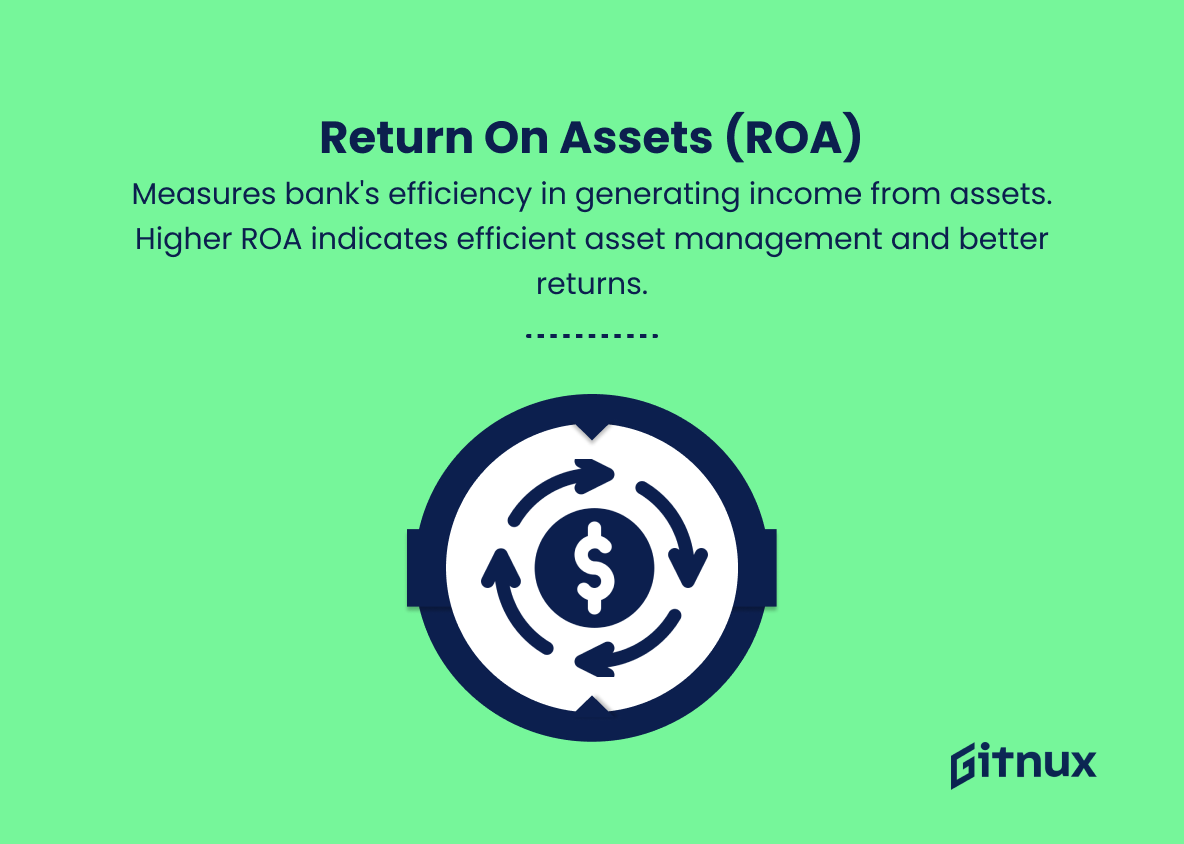
Cost-to-Income Ratio measures the operating efficiency of a bank by comparing its operating costs to its net operating income.2. Return on Assets (ROA)
This KPI is a profitability ratio that shows how effectively a bank uses its assets to generate income. A higher ROA indicates that the bank is efficiently managing its assets to achieve better returns.
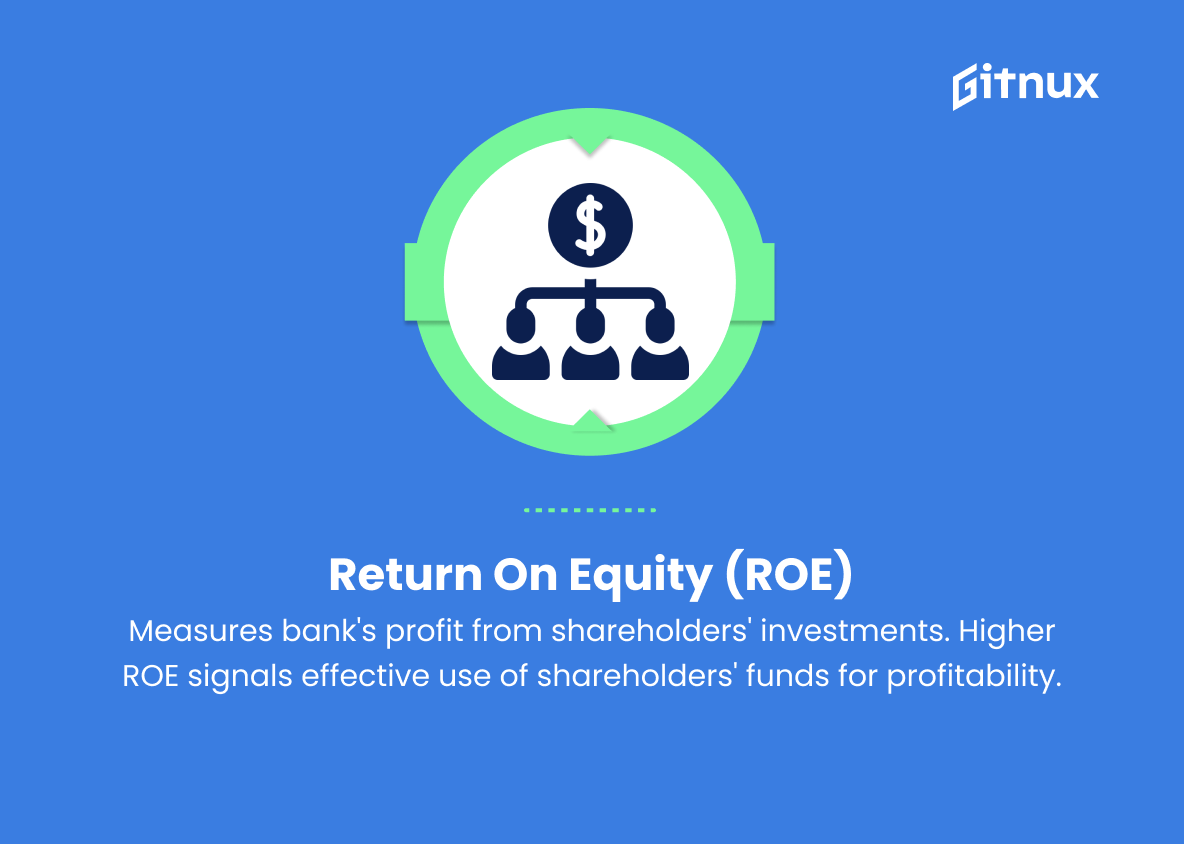
3. Return on Equity (ROE)
This KPI measures a bank’s profitability by showing how much profit it generates with the money invested by shareholders. Higher ROE indicates the bank is using shareholders’ funds effectively.
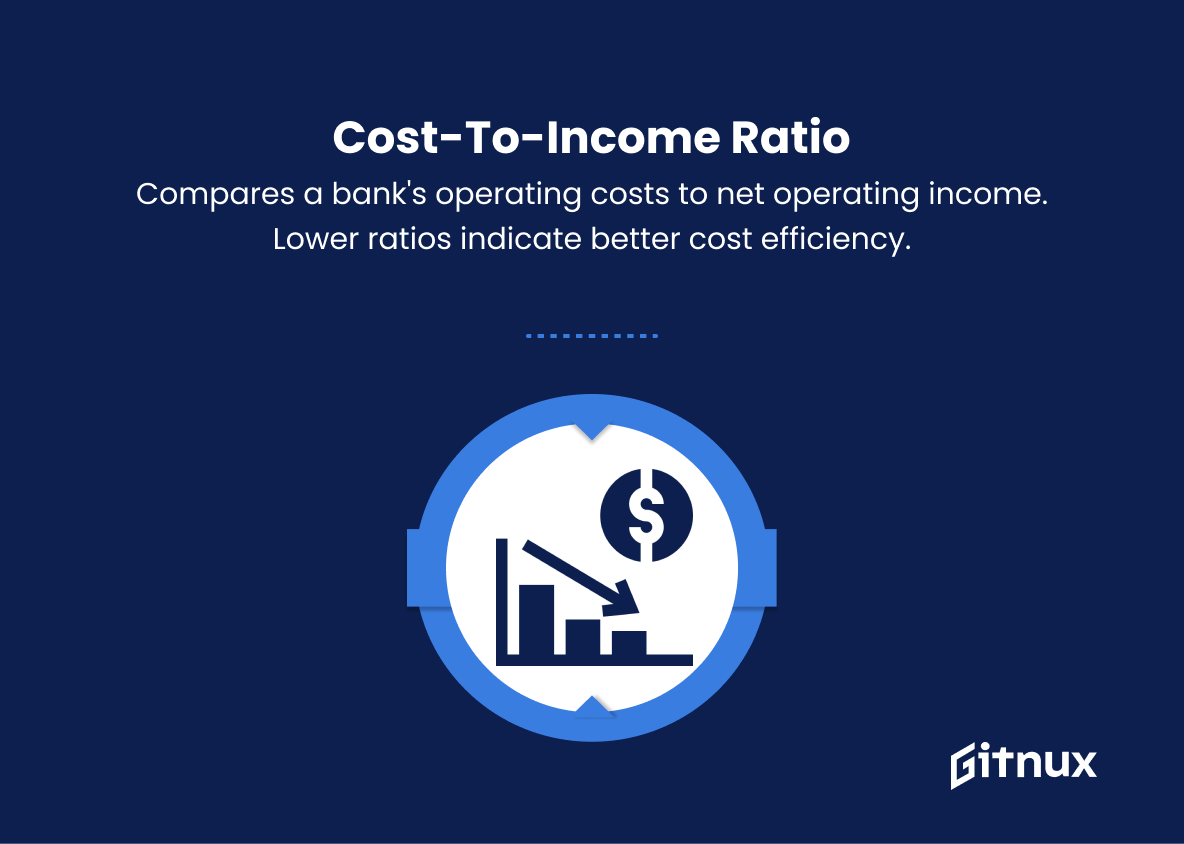
4. Cost-to-Income Ratio
This KPI measures the operating efficiency of a bank by comparing its operating costs to its net operating income. Lower ratios indicate better cost efficiency.
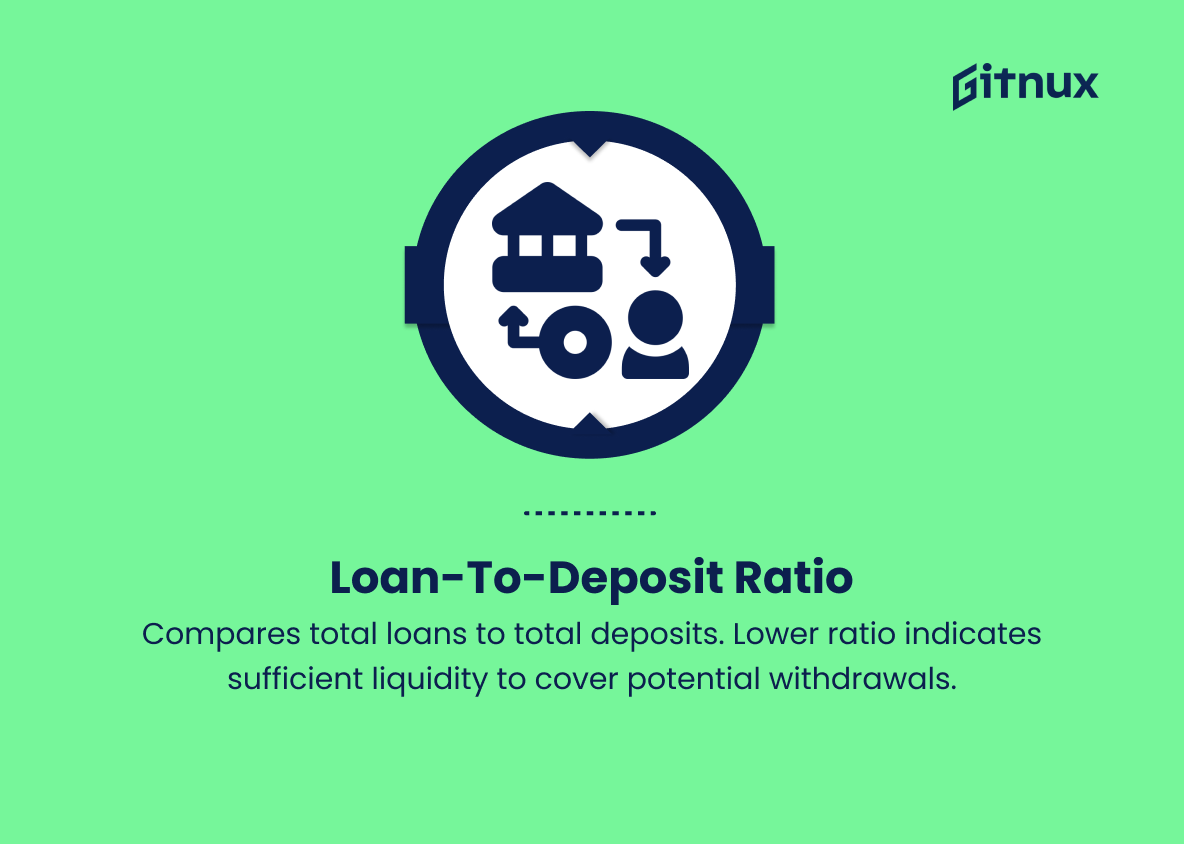
5. Loan-to-Deposit Ratio
This KPI measures a bank’s lending capacity and liquidity risk by comparing the total value of loans granted to the total value of deposits. A lower ratio indicates that the bank has adequate liquidity to cover potential withdrawal requests.
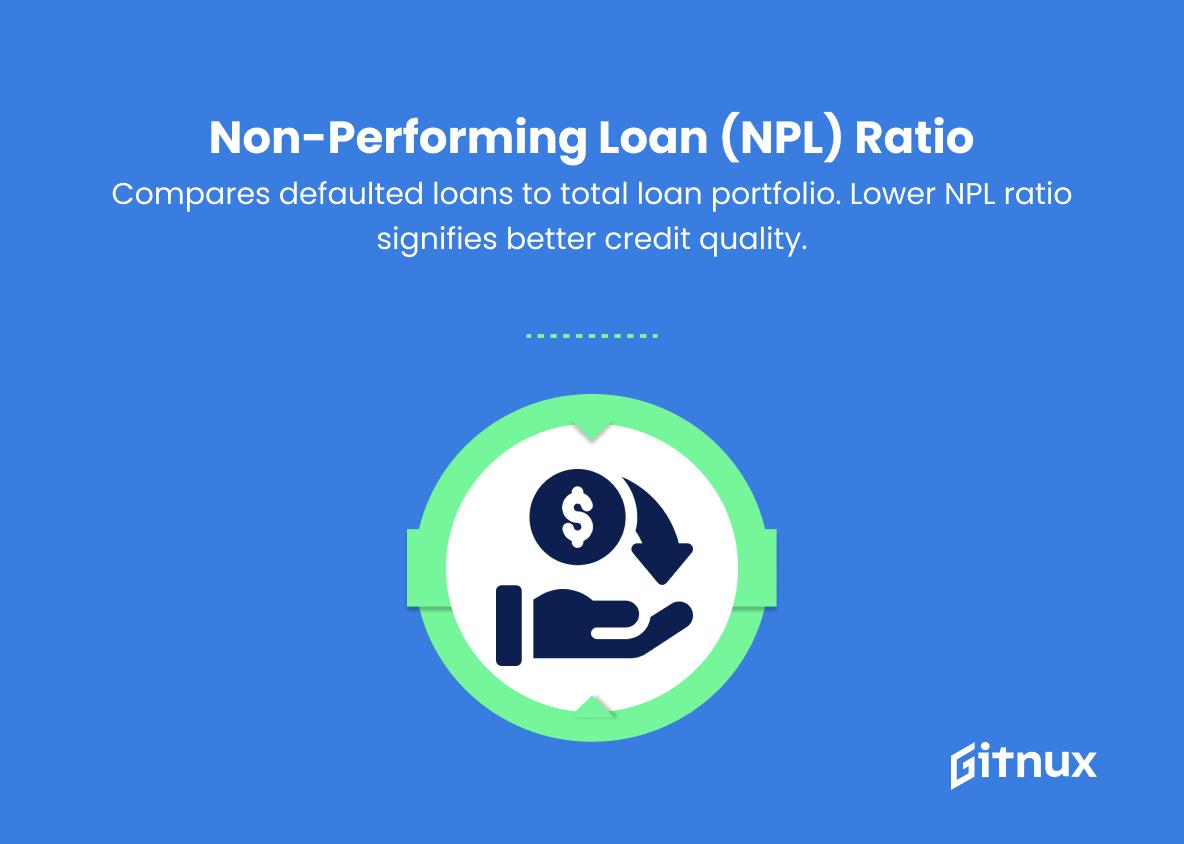
6. Non-Performing Loan (NPL) Ratio
This KPI measures the quality of the bank’s loan portfolio by comparing the amount of loans that are in default to the total value of the loan portfolio. A lower NPL ratio indicates better credit quality.
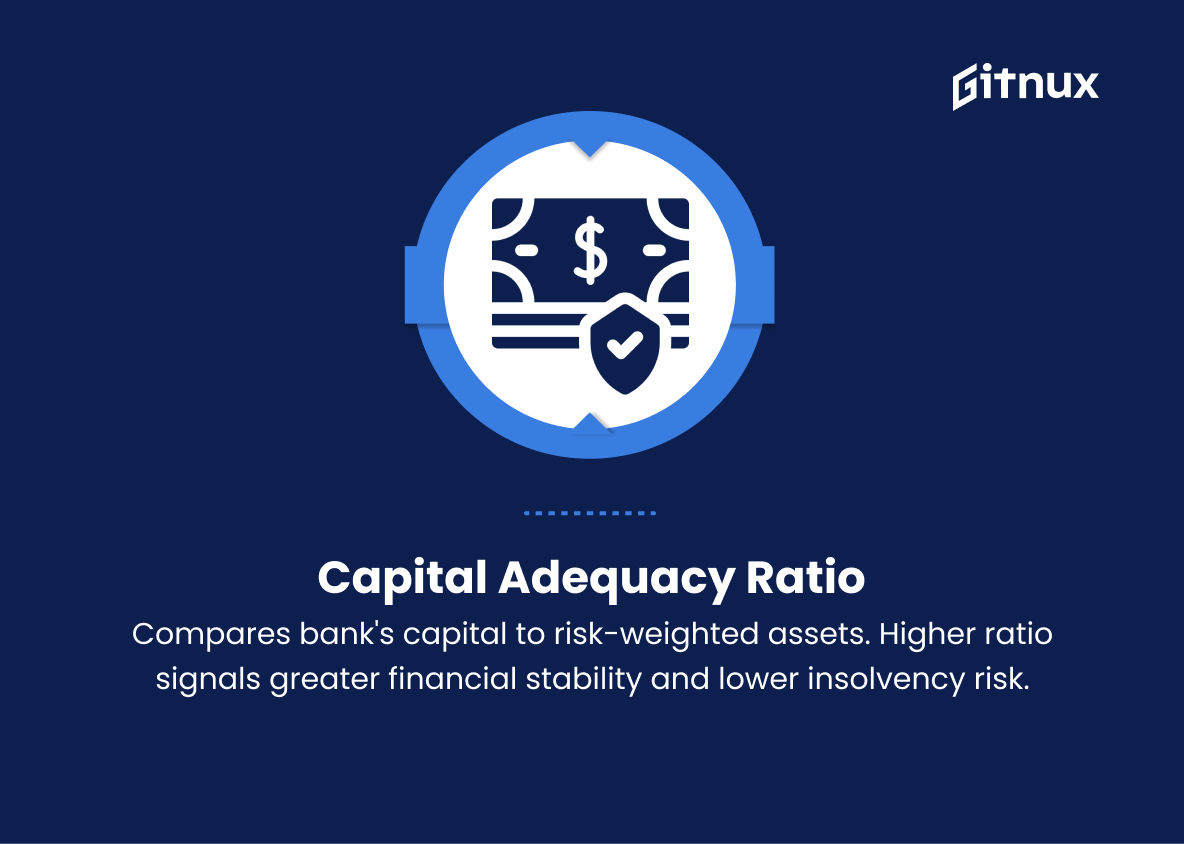
7. Capital Adequacy Ratio
This KPI measures a bank’s financial strength and ability to meet its obligations by comparing its capital to its risk-weighted assets. A higher ratio indicates greater financial stability and a lower likelihood of insolvency.
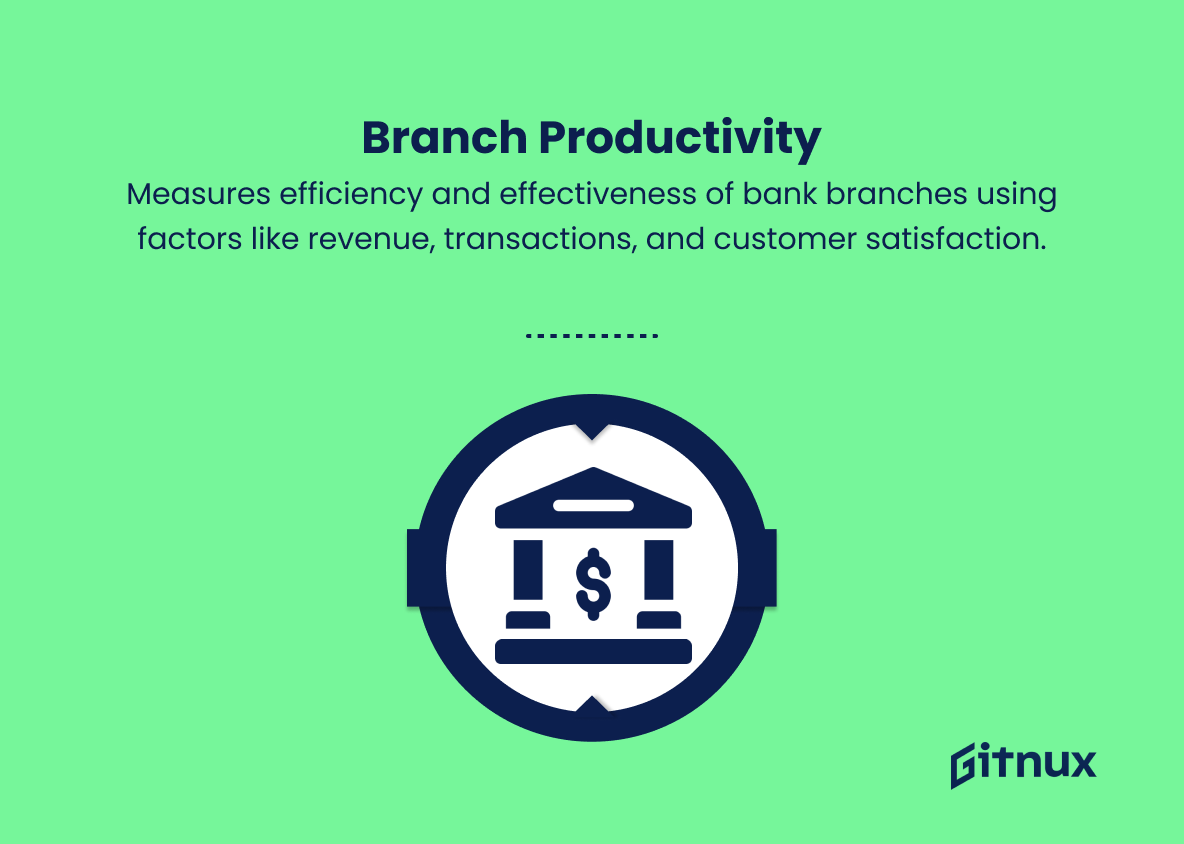
8. Branch Productivity
This KPI measures the overall efficiency and effectiveness of a bank’s branches by looking at factors such as revenue, number of transactions, and customer satisfaction.
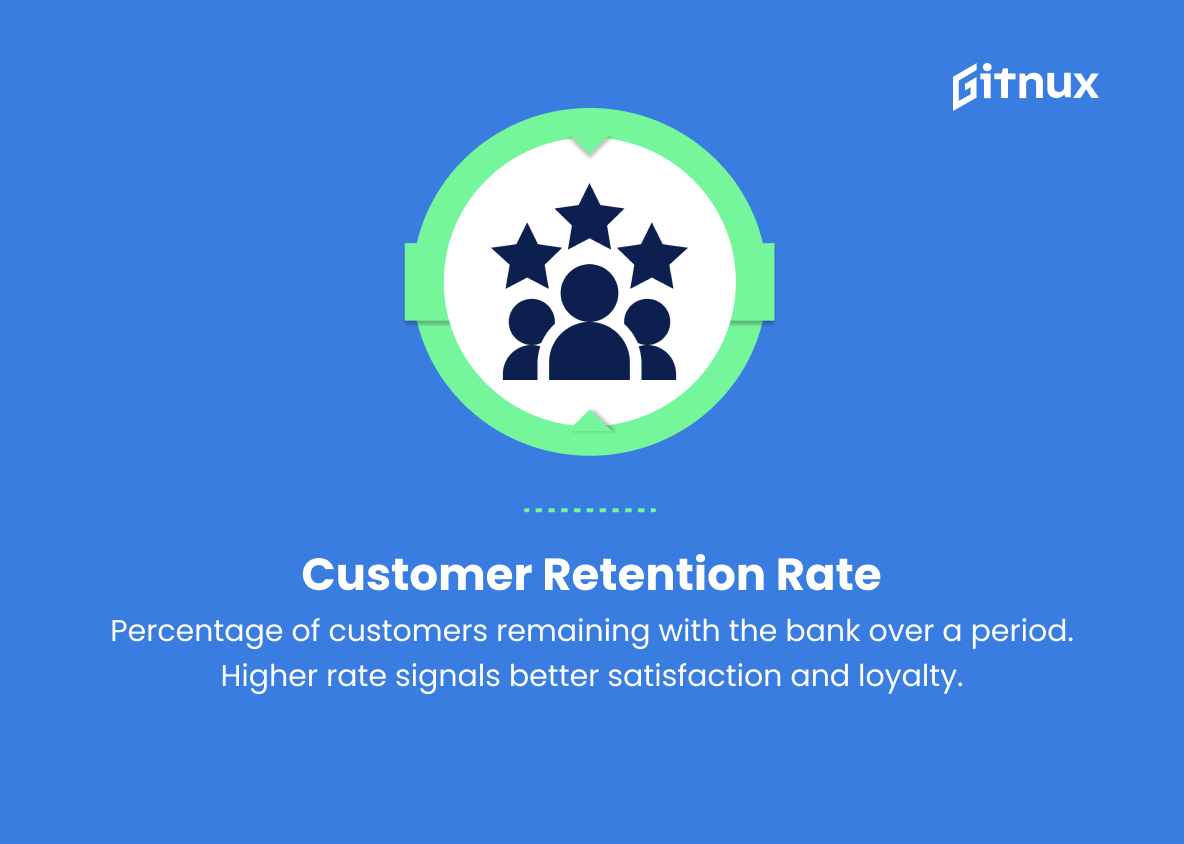
9. Customer Retention Rate
This KPI measures the percentage of customers who remain with the bank over a given period. A higher retention rate indicates better customer satisfaction and loyalty.
10. New Customer Acquisition Rate
This KPI measures the number of new customers a bank acquires during a specific period. A higher acquisition rate signifies successful marketing and customer acquisition strategies.
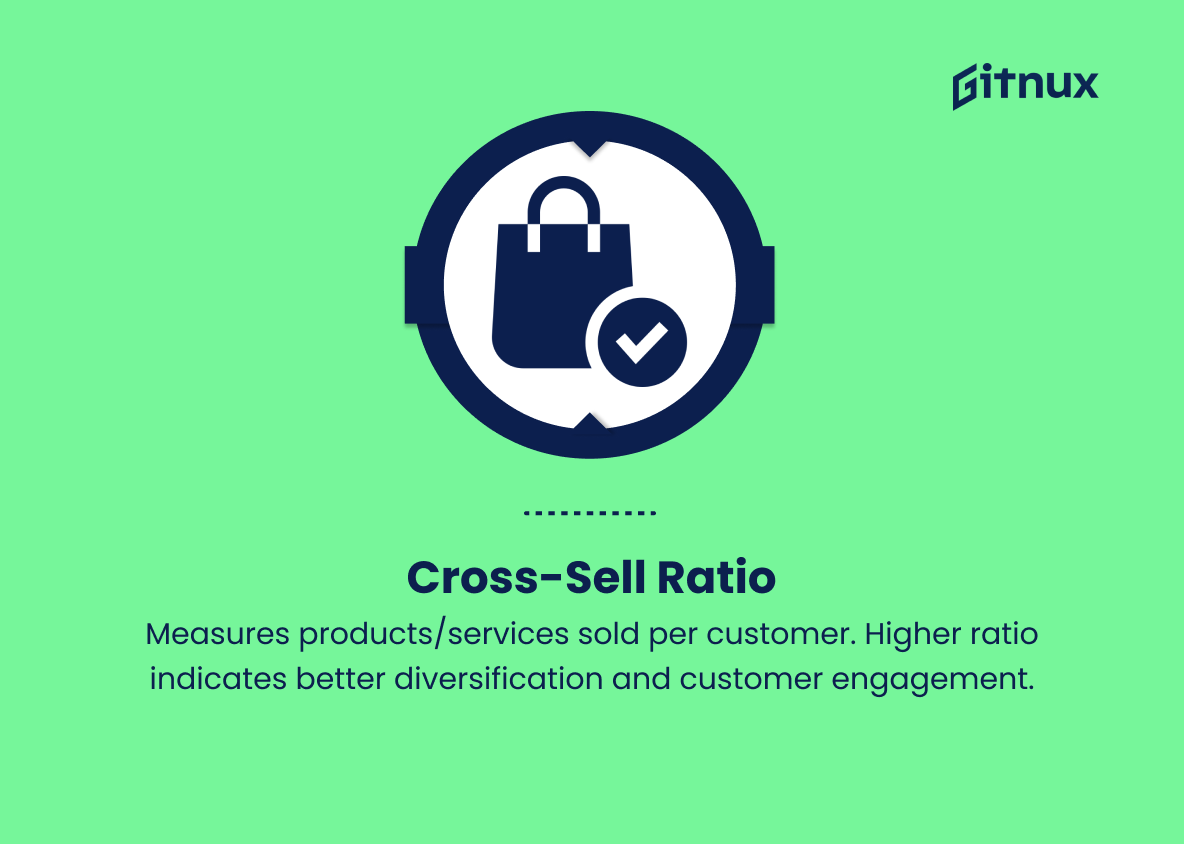
Cross-Sell Ratio measures the average number of products or services a bank sells to each of its customers.11. Cross-Sell Ratio
This KPI measures the average number of products or services a bank sells to each of its customers. A higher ratio indicates better product diversification and customer engagement.
12. Employee Productivity
This KPI measures the efficiency and effectiveness of bank employees by calculating the revenue generated per employee. Higher employee productivity translates to improved operational efficiency.
These are just a few of the many KPIs used to measure the performance and health of a bank. Each KPI can provide valuable insights into the bank’s operations, enabling better decision making and strategic planning.
Bank KPIs Explained
Bank KPIs, such as Net Interest Margin, Return on Assets, and Return on Equity, are critical for assessing profitability and financial stability. They offer insights into how efficiently a bank is using its assets, managing shareholder funds, and generating income. Indicators like the Cost-to-Income Ratio and Branch Productivity shed light on the operational efficiency of the institution, while Loan-to-Deposit Ratio, Non-Performing Loan Ratio, and Capital Adequacy Ratio highlight lending capacity, credit quality, and insolvency risks.
Customer-centric KPIs, such as Customer Retention Rate, New Customer Acquisition Rate, and Cross-Sell Ratio, illustrate the bank’s success in maintaining customer satisfaction and engagement, along with the effectiveness of marketing and product diversification strategies.
Lastly, Employee Productivity serves as a measure of operational efficiency and staff effectiveness. Overall, these KPIs provide invaluable information to support strategic decision-making and enhance overall performance in the competitive banking industry.
Conclusion
In conclusion, monitoring and analyzing bank KPIs is critical to a financial institution’s long-term success and stability. Assessing key performance indicators allows banks to evaluate and optimize their operations, ensuring they stay ahead in a competitive industry while also providing customer satisfaction.
The right mix of KPIs—from profitability and efficiency to risk management and customer service—will offer valuable insights and empower decision-makers to drive continuous improvement. As the banking sector evolves with new technologies and customer expectations, attention to these KPIs will be vital for adapting and maintaining a strong financial position in the market.
