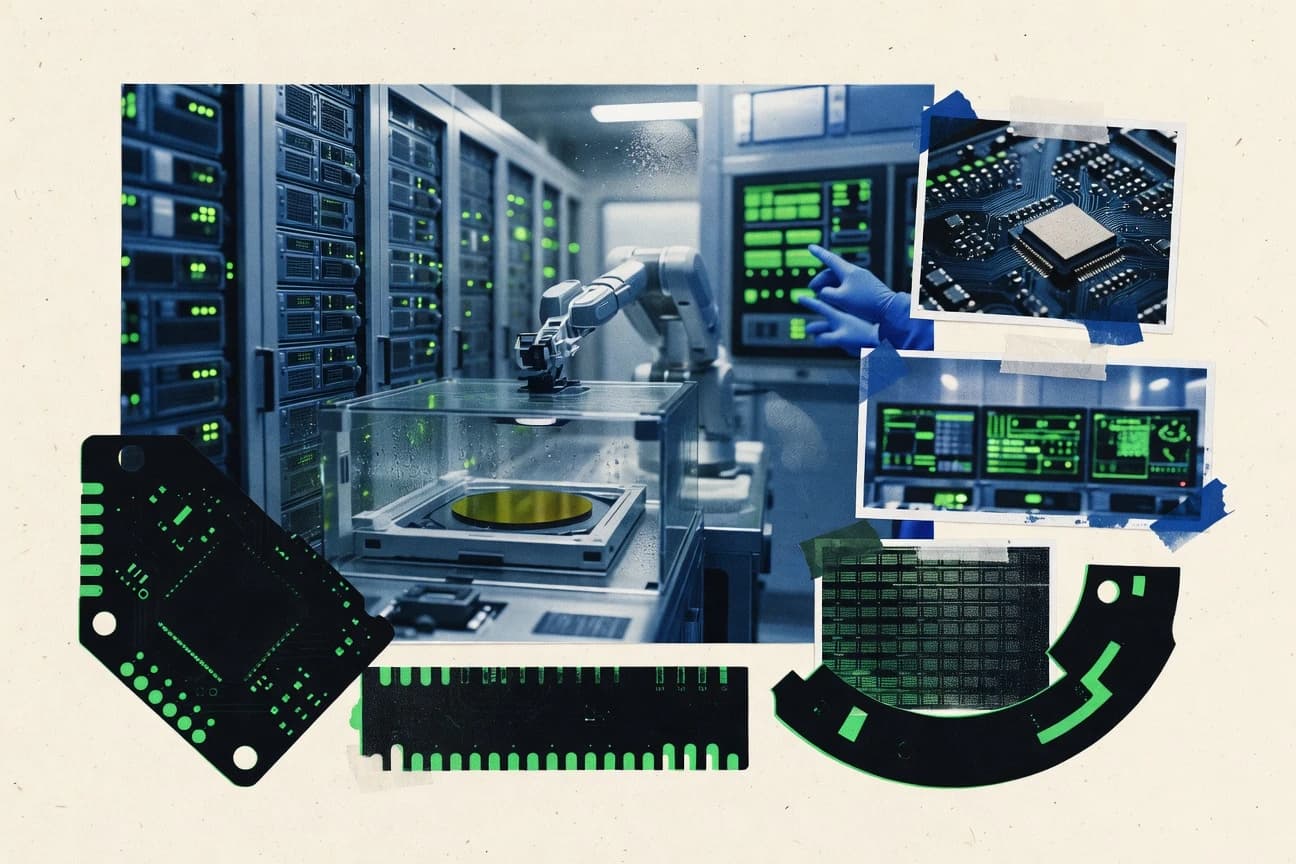

Global high-tech industry revenue reached $5.8 trillion last year. This growth is matched by a severe talent shortage and a significant recalibration in venture capital funding.
Key Takeaways
- Global high-tech employment stood at 28.7 million jobs in 2023, with 2.1 million added in the U.S. alone
- Global VC investment in high-tech peaked at $457 billion in 2021 but fell to $285 billion in 2023
- Global high-tech industry revenue reached $5.8 trillion in 2023, up 8.2% from 2022 driven by AI and cloud computing demand
- Global R&D spending in high-tech reached $1.2 trillion in 2023, with 15% allocated to AI
- Global 5G connections reached 1.76 billion in 2023, up 65% YoY
High tech companies are driving rapid growth, with innovation accelerating faster than ever.
Related reading
01 · Category
Employment and Talent19 stats
01
Global high-tech employment stood at 28.7 million jobs in 2023, with 2.1 million added in the U.S. alone
02
Tech industry workforce in India reached 5.4 million in FY2023, growing 8.5% YoY
03
U.S. tech unemployment rate was 2.2% in 2023, below national average of 3.7%
04
Women represent 26% of global tech workforce in 2023, up from 24% in 2020
05
Software developer jobs grew 25% in U.S. from 2018-2023, reaching 1.8 million positions
06
Global tech talent shortage estimated at 85 million workers by 2030
07
Average tech salary in U.S. was $109,020in 2023, 84% above national median
08
China tech sector employed 7.2 million in R&D roles in 2022
09
Remote tech workers increased to 58% of U.S. tech workforce in 2023
10
Entry-level tech hiring in Europe rose 12% in 2023 to 450,000 positions
11
U.S. tech job openings averaged 1.2 million monthly in 2023
12
Diversity in tech: Black workers 7.4% of U.S. tech roles 2023
13
Tech freelancers numbered 50 million globally in 2023
14
STEM graduates in U.S. 600,000 annually, 25% enter tech
15
Tech attrition rate 13.2% in 2023, highest in non-tech at 10.6%
16
Average tech employee tenure 4.1 years in 2023
17
H-1B visas for tech 85,000 approved in FY2023
18
Women in AI roles 22% globally 2023
19
Gig economy tech workers 40% of total tech labor 2023
Interpretation
Employment and Talent Interpretation
While the global tech industry is booming with jobs, salaries, and remote work, it's still desperately searching for more talent while struggling to retain the diverse workforce it already has and needs even more of.
02 · Category
Funding and VC23 stats
01
Global VC investment in high-tech peaked at $457 billion in 2021 but fell to $285 billion in 2023
02
AI startups raised $50.1 billion in VC in 2023, 27% of total tech VC
03
U.S. tech VC deals numbered 12,500 in 2023, down 18% from 2022
04
Late-stage tech funding averaged $150 million per deal in 2023
05
Crypto and blockchain VC dropped to $10.7 billion in 2023 from $30.9B peak
06
European tech VC reached €45 billion in 2023, led by fintech
07
Seed-stage tech funding averaged $2.8 million per deal globally in 2023
08
Corporate VC in tech hit $70 billion in 2023, with Google Ventures leading
09
Climate tech VC investments totaled $28.5 billion in 2023
10
M&A deals in tech reached 8,200 in 2023 valued at $512 billion
11
IPOs in tech sector numbered 45 in U.S. 2023, raising $6.2 billion
12
Asia-Pacific tech VC was $60 billion in 2023, 40% in China
13
Number of tech unicorns grew to 1,200 globally by end-2023
14
Deep tech VC $25 billion in 2023
15
Fintech funding $114 billion in 2023
16
Healthtech VC $15.3 billion 2023 U.S.
17
SaaS unicorns raised $18 billion Series A+ 2023
18
Down rounds in tech 15% of deals in 2023
19
SPAC mergers in tech fell to 50 in 2023 from 600 peak
20
Angel investments in tech $30 billion globally 2023
21
Government tech grants $100 billion in 2023, U.S. CHIPS Act $52B
22
Exit values for tech M&A $400 billion 2023
23
Median tech VC valuation $50 million seed stage 2023
Interpretation
Funding and VC Interpretation
The global tech funding party has sobered up, with investors now placing fewer, bigger bets on proven ideas like AI while politely declining refills on crypto punch, all while governments and corporations quietly pick up the tab for the sectors they deem essential.
03 · Category
Market Growth and Revenue16 stats
01
Global high-tech industry revenue reached $5.8 trillion in 2023, up 8.2% from 2022 driven by AI and cloud computing demand
02
U.S. tech sector GDP contribution was $1.9 trillion in 2022, representing 10% of total U.S. GDP
03
Semiconductor market size hit $526.9 billion globally in 2023, with a CAGR of 8.1% projected to 2030
04
Cloud computing market valued at $545.6 billion in 2023, expected to grow to $1.6 trillion by 2030 at 20.4% CAGR
05
AI software market revenue was $64.3 billion in 2023, forecasted to reach $251 billion by 2027
06
Global IT spending totaled $4.7 trillion in 2023, with data center systems growing 15.2% YoY
07
Software as a Service (SaaS) market size was $232.5 billion in 2023, projected CAGR of 18.1% through 2030
08
Cybersecurity market reached $172.3 billion in 2023, with 12.3% CAGR expected to $298.5 billion by 2028
09
5G infrastructure market valued at $17.7 billion in 2023, anticipated to grow to $89.7 billion by 2030 at 26.5% CAGR
10
Internet of Things (IoT) market size was $318.4 billion in 2023, projected to $1.6 trillion by 2030 at 26.1% CAGR
11
Global high-tech exports totaled $3.4 trillion in 2023, led by electronics at 45%
12
Enterprise software revenue was $280 billion in 2023, with ERP growing 11%
13
Data analytics market size $49.3 billion in 2023, CAGR 13.9% to 2030
14
High-tech manufacturing output $2.1 trillion in China 2023
15
Tech services outsourcing market $600 billion in 2023, India 55% share
16
E-commerce tech platforms revenue $150 billion 2023
Interpretation
Market Growth and Revenue Interpretation
The world has collectively decided that the future is going to be expensive, smart, and everywhere, as evidenced by the AI-driven, cloud-soaked, semiconductor-powered sprint toward a multi-trillion-dollar tech ecosystem where everything, from your toaster to your economy, is now a subscription service.
More related reading
04 · Category
R&D Spending19 stats
01
Global R&D spending in high-tech reached $1.2 trillion in 2023, with 15% allocated to AI
02
U.S. tech firms invested $300 billion in R&D in 2022, 45% of corporate total
03
Semiconductor R&D expenditure was $59 billion globally in 2023, up 10% YoY
04
Pharma-tech crossover R&D hit $85 billion in 2023, focusing on biotech AI
05
EU tech R&D funding totaled €120 billion in 2023 via Horizon Europe
06
Patents filed in AI globally reached 65,000 in 2023, 30% increase from 2022
07
Cloud R&D investment by hyperscalers was $75 billion in 2023
08
Quantum computing R&D funding hit $5.2 billion globally in 2023
09
Average R&D intensity in tech sector was 15.2% of revenue in 2023
10
Biotech R&D spending grew to $197 billion in U.S. 2023
11
Global R&D personnel in tech 8.5 million in 2023
12
Samsung R&D spend $22 billion in 2023
13
TSMC R&D investment $5.9 billion 2023, 8% of revenue
14
Google R&D $45.4 billion in 2023
15
Huawei R&D $23 billion 2023, 23% of sales
16
Microsoft R&D $27.2 billion FY2023
17
Global patent applications in tech 3.5 million in 2023
18
Venture-backed R&D startups $120 billion funded 2023
19
University tech transfer deals 12,000 in 2023
Interpretation
R&D Spending Interpretation
The world is now betting $1.2 trillion a year that the future will be invented, not inherited, with a serious side hustle in making sure we patent every last glimmer of the idea before someone else does.
05 · Category
Technological Advancements22 stats
01
Global 5G connections reached 1.76 billion in 2023, up 65% YoY
02
AI adoption in enterprises hit 55% in 2023, with generative AI at 35%
03
Quantum bits (qubits) in commercial systems reached 1,000+ by IBM in 2023
04
Edge computing market deployments grew to 40% of enterprise workloads in 2023
05
Blockchain transactions processed 450 million daily globally in 2023
06
Autonomous vehicle miles driven reached 50 million in testing by 2023
07
AR/VR headset shipments hit 13.2 million units in 2023, up 40% YoY
08
Data generated daily worldwide reached 328.77 million terabytes in 2023
09
6G research prototypes achieved 1 Tbps speeds in lab tests 2023
10
Neuromorphic chip performance improved 10x in energy efficiency 2023
11
Global fiber optic deployment covered 1.5 million km new in 2023
12
Satellite internet users grew to 5 million via Starlink in 2023
13
Metaverse market size $61.8 billion 2023, CAGR 37.3% to 2030
14
Machine learning models trained doubled to 10,000 public in 2023
15
Hyperscale data centers numbered 1,000 globally in 2023
16
Digital twins adoption 85% in manufacturing tech 2023
17
Ransomware attacks on tech firms 2,200 in 2023, up 20%
18
LiDAR sensors in AVs improved resolution 50% in 2023
19
NFT transactions volume $8.7 billion 2023, down from peak
20
Sustainable tech patents 25,000 filed 2023
21
Chiplet designs in production 30% of advanced nodes 2023
22
Global bandwidth capacity 2.5 ZB per year 2023
Interpretation
Technological Advancements Interpretation
The numbers paint a picture of a world sprinting toward a breathtakingly connected and intelligent future, though we're still tripping over the very real hurdles of security threats, market volatility, and our own planet's limits along the way.
Reference
Cite This Report
This report is designed to be cited. We maintain stable URLs and versioned verification dates. Copy the format appropriate for your publication below.
APA
Karl Becker. (2026, February 13). High Tech Industry Statistics. Gitnux. https://gitnux.org/high-tech-industry-statistics
MLA
Karl Becker. "High Tech Industry Statistics." Gitnux, 13 Feb 2026, https://gitnux.org/high-tech-industry-statistics.
Chicago
Karl Becker. 2026. "High Tech Industry Statistics." Gitnux. https://gitnux.org/high-tech-industry-statistics.
Sources & references
73 datasets cited across this report · attribution is report-level