
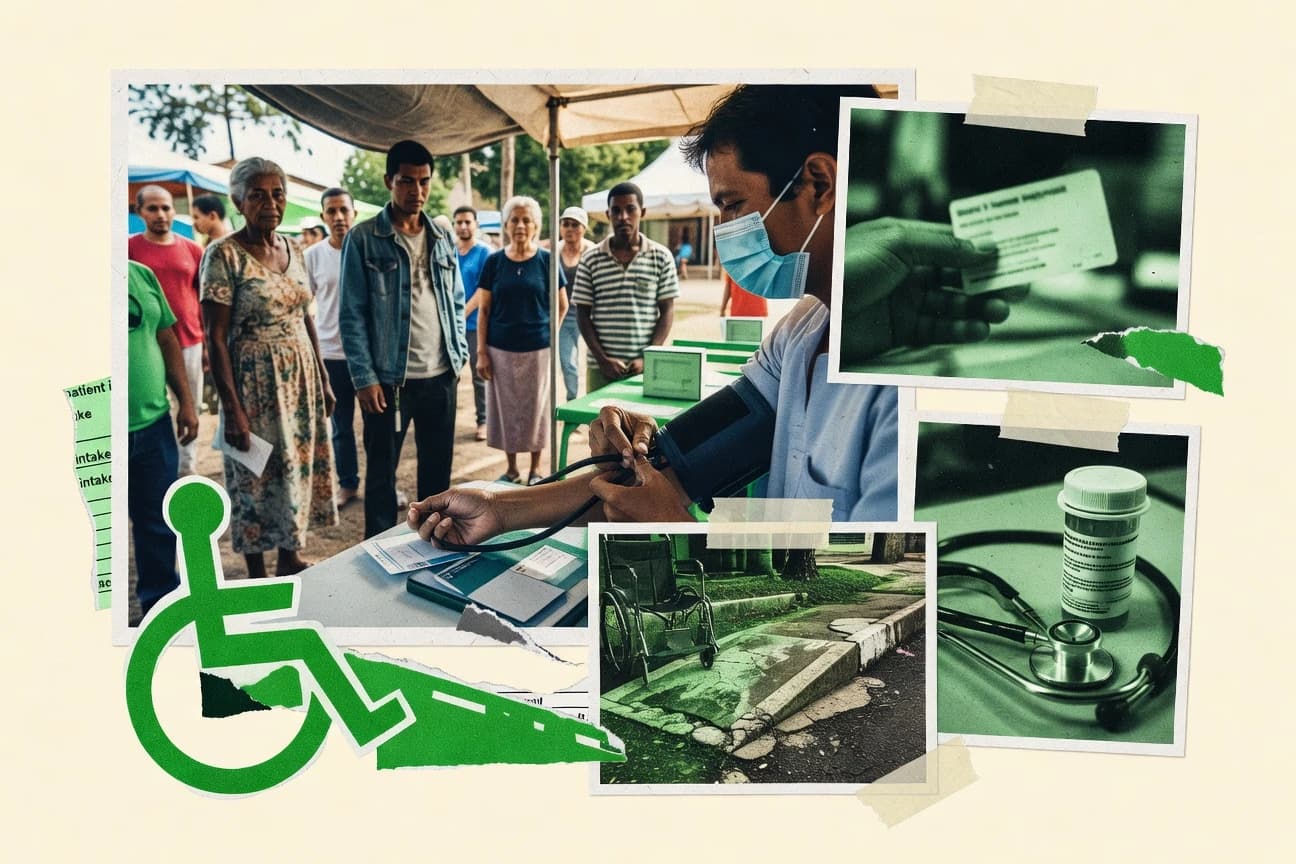

Health equity examines how health outcomes and risks differ across gender, disability, race and ethnicity, geography, and income. Across this page, you’ll find evidence of gaps in life expectancy, mental health, injuries, and chronic disease. It also connects disparities—like disability-related life expectancy loss, rural heart disease and asthma, and COVID-19 and overdose burdens—to underlying factors such as comorbidities, poverty, and access to care.
Key Takeaways
- Women had a life expectancy of 79.3 years versus 73.5 for men in 2021, a 5.8 year gap.
- Men had 2.1 times higher age-adjusted suicide death rate at 22.8 per 100,000 versus 10.8 for women in 2021.
- Women experienced 1.5 times higher depression prevalence at 10.5% versus 6.2% for men in 2021.
- Disabled adults had 28.6% obesity rate versus 22.4% non-disabled in 2020.
- People with disabilities had 3x higher poverty rate at 25%.
- Disabled individuals had 20% lower life expectancy due to comorbidities.
- In 2021, non-Hispanic Black women in the US experienced a maternal mortality rate of 69.9 deaths per 100,000 live births, which is 2.6 times higher than the rate for non-Hispanic White women at 26.6 deaths per 100,000 live births.
- American Indian and Alaska Native adults had a diabetes prevalence of 13.6% in 2019, compared to 7.4% among non-Hispanic White adults, representing a 84% higher rate.
- Hispanic children under age 18 had an obesity rate of 26.2% in 2017-2020, which is 1.5 times higher than the 14.3% rate for non-Hispanic White children.
- Rural residents had 20% higher heart disease death rate at 168 per 100,000 versus 140 in urban areas in 2020.
- Urban children had 15% higher asthma prevalence than rural at 8.5% versus 7.4% in 2019.
- Rural adults over 18 had 38% obesity rate versus 33% urban in 2021.
- In 2019, adults with household income less than $25,000 had obesity prevalence of 41.3%, compared to 29.7% for those with income over $75,000.
- Low-income children (below 100% FPL) had 23% unmet dental care needs in 2019, versus 7% for high-income children.
- Individuals with less than high school education had 2.5 times higher smoking rate at 28% versus 11% for college graduates in 2020.
Major health disparities persist by sex, disability, race, and income, with higher mortality, mental illness, and chronic disease burdens.
Related reading
01 · Category
Gender Disparities22 stats
01
Women had a life expectancy of 79.3 years versus 73.5 for men in 2021, a 5.8 year gap.
02
Men had 2.1 times higher age-adjusted suicide death rate at 22.8 per 100,000 versus 10.8 for women in 2021.
03
Women experienced 1.5 times higher depression prevalence at 10.5% versus 6.2% for men in 2021.
04
Men had 80% of workplace fatalities, but women had higher non-fatal injury rates in healthcare.
05
Postmenopausal women had 25% higher osteoporosis fracture risk without screening.
06
Women veterans had 50% higher PTSD rates than civilian women at 20%.
07
Men over 65 had prostate screening at 60%, but women cervical at 80%.
08
Pregnant women had 90% higher severe COVID outcomes if obese.
09
Women had 30% more chronic pain diagnoses, undertreated by 20%.
10
Men had 1.8 times higher liver disease mortality from alcohol.
11
Women in menopause had 40% higher insomnia rates.
12
Transgender women had HIV prevalence 20 times higher than cisgender women at 14%.
13
Elderly women had 2x hip fracture rates leading to 20% higher nursing home admissions.
14
Women had 15% lower heart attack treatment rates within 30 min.
15
Lesbian women had 20% higher obesity rates than heterosexual women.
16
Gay and bisexual men had syphilis rates 100 times higher than straight men in 2021.
17
Transgender adults had 40% suicide attempt lifetime rate versus 4.6% general population.
18
Lesbian women smoked at 25% rate versus 13% heterosexual women.
19
Bisexual women had 2x higher intimate partner violence.
20
Gay men had 12% HIV prevalence versus 0.2% heterosexual men.
21
Transgender youth had 50% depression rates.
22
LGBTQ+ adults had 2.5x higher asthma emergency visits.
Interpretation
Gender Disparities Interpretation
Under Gender Disparities, women live longer but consistently face higher burden and vulnerability, such as a 79.3 versus 73.5 year life expectancy gap, alongside higher depression prevalence at 10.5% versus 6.2% and a 25% higher osteoporosis fracture risk without screening.
02 · Category
Lgbtq+ And Disability Disparities16 stats
01
Disabled adults had 28.6% obesity rate versus 22.4% non-disabled in 2020.
02
People with disabilities had 3x higher poverty rate at 25%.
03
Disabled individuals had 20% lower life expectancy due to comorbidities.
04
Adults with disabilities had 40% higher smoking prevalence at 24%.
05
Disabled children had 2x higher bullying victimization rates.
06
Intellectual disabilities linked to 85% higher early death risk before 65.
07
Wheelchair users had 50% unmet healthcare needs due to access.
08
Disabled women had 2x higher breast cancer mortality.
09
Mental health disabilities had 60% unemployment rate.
10
Autistic adults had 80% unemployment or underemployment.
11
Disabled rural had 30% longer wait times for specialists.
12
LGBTQ+ with disabilities had 70% discrimination in healthcare.
13
Vision impaired had 2.5x fall injury rates.
14
Hearing loss adults had 25% higher dementia risk.
15
Chronic disabled had 35% higher COVID mortality.
16
Mobility disabled had 40% food insecurity higher.
Interpretation
Lgbtq+ And Disability Disparities Interpretation
Within the LGBTQ+ and disability disparities, disability status is tied to significantly worse health and wellbeing, including obesity at 28.6% versus 22.4% for non-disabled people in 2020 and a 3x higher poverty rate of 25%, underscoring how compounded barriers can drive major outcomes.
03 · Category
Racial And Ethnic Disparities28 stats
01
In 2021, non-Hispanic Black women in the US experienced a maternal mortality rate of 69.9 deaths per 100,000 live births, which is 2.6 times higher than the rate for non-Hispanic White women at 26.6 deaths per 100,000 live births.
02
American Indian and Alaska Native adults had a diabetes prevalence of 13.6% in 2019, compared to 7.4% among non-Hispanic White adults, representing a 84% higher rate.
03
Hispanic children under age 18 had an obesity rate of 26.2% in 2017-2020, which is 1.5 times higher than the 14.3% rate for non-Hispanic White children.
04
In 2020, Asian Americans had the lowest COVID-19 hospitalization rate at 45 per 100,000, while Black Americans had 148 per 100,000, a disparity of over 3 times.
05
Non-Hispanic Black adults over 20 had hypertension prevalence of 56.2% in 2017-2020, versus 45.3% for non-Hispanic Whites, a 24% relative disparity.
06
Native Hawaiian and Pacific Islander women had a breast cancer incidence rate 15% higher than White women in 2014-2018.
07
In 2019, Black men had a prostate cancer mortality rate of 38.9 per 100,000, twice that of White men at 18.9 per 100,000.
08
Hispanic adults had a 9.0% stroke prevalence in 2019, lower than 11.5% for Blacks but with higher undiagnosed rates at 25%.
09
American Indian adults smoked at 31.8% rate in 2020, compared to 12.9% for Asian adults, over 2.4 times higher.
10
In 2021, Black youth aged 12-17 had 15.4% major depressive episode rate, versus 11.2% for White youth.
11
Non-Hispanic Black individuals had a life expectancy of 71.8 years in 2021, 5.6 years less than non-Hispanic Whites at 77.4 years.
12
Hispanic adults had 10.5% asthma prevalence in 2021, higher than 8.1% for non-Hispanic Whites.
13
In 2018, Black children had 2.4 times higher rate of food insecurity at 28.5% versus 11.8% for White children.
14
Asian American elders over 65 had 10% lower access to mammography screening compared to White elders at 70% screening rate.
15
Native Americans had kidney failure incidence 1.5 times higher than Whites in 2021.
16
Black women had 40% higher preterm birth rate at 14.1% versus 10.0% for White women in 2021.
17
Hispanic men had liver cancer mortality 1.8 times higher than non-Hispanic White men in 2015-2019.
18
In 2020, Black adults had 20% higher opioid overdose death rate adjusted for age.
19
American Indian women experienced intimate partner violence at 46% lifetime rate versus 34% for White women.
20
Non-Hispanic Black teens had 25% higher suicide attempt rate in 2021.
21
In 2022, Black maternal mortality was 49.5 per 100,000 live births nationally, 3 times White rate.
22
AI/AN had heart disease death rate 1.3 times higher than Whites in 2021.
23
Hispanic obesity among adults was 45.6% vs 41.4% Whites in 2020.
24
Asian COVID death rate lowest but NHPI 3x White in some states.
25
Black lung cancer survival 5-year rate 18.8% vs 24.8% White.
26
26.6 maternal deaths per 100,000 live births for non-Hispanic White women in 2021
27
33.0 maternal deaths per 100,000 live births for non-Hispanic White women in 2019
28
29.7 maternal deaths per 100,000 live births for non-Hispanic White women in 2020
Interpretation
Racial And Ethnic Disparities Interpretation
For the racial and ethnic disparities in health, the data show stark gaps such as non-Hispanic Black women facing a maternal mortality rate of 69.9 deaths per 100,000 live births in 2021, about 2.6 times the rate for non-Hispanic White women.
More related reading
report visual · Projection
Maternal mortality rate trends for non-Hispanic White women (2019–2021)
For non-Hispanic White women in the U.S., maternal deaths per 100,000 live births decline from 2019 to 2021, with the lowest level in 2021 (trend points downward overall).
33 deaths per 100,000 live births
Start
-10.22%
CAGR · 2y
26.6 deaths per 100,000 live births
Projected
20192021
source-verifiedcdc.gov2021
04 · Category
Rural Urban Disparities16 stats
01
Rural residents had 20% higher heart disease death rate at 168 per 100,000 versus 140 in urban areas in 2020.
02
Urban children had 15% higher asthma prevalence than rural at 8.5% versus 7.4% in 2019.
03
Rural adults over 18 had 38% obesity rate versus 33% urban in 2021.
04
Rural counties had 50% more opioid overdose deaths per capita in 2021.
05
Urban areas had 2x more access to specialists, rural had 40 minute longer travel times.
06
Rural elderly had 18% lower colorectal cancer screening rates at 62% versus 80% urban.
07
Rural mothers had 30% higher low birthweight rates at 8.5%.
08
Urban poor had 25% higher HIV prevalence than rural poor.
09
Rural veterans had 35% higher suicide rates at 32 per 100,000.
10
Rural areas had 15% fewer dentists per capita, leading to 20% more ED dental visits.
11
Urban youth had 12% higher vaping rates versus 9% rural in 2021.
12
Rural diabetics had 25% higher amputation rates due to poor foot care access.
13
Urban heat islands caused 10% more heat-related deaths in low-income urban vs rural.
14
Rural cancer mortality was 16% higher for lung cancer in 2019.
15
Urban immigrants had 18% lower mental health service use due to barriers.
16
Rural stroke death rates were 40 per 100,000 higher than urban.
Interpretation
Rural Urban Disparities Interpretation
In 2020 and 2021, rural communities faced consistently worse health outcomes than urban areas, with heart disease death rates 20% higher at 168 per 100,000 versus 140 and opioid overdose deaths 50% higher per capita, alongside barriers like longer travel for specialists where rural trips took 40 minutes more.
05 · Category
Socioeconomic Disparities22 stats
01
In 2019, adults with household income less than $25,000had obesity prevalence of 41.3%, compared to 29.7% for those with income over $75,000.
02
Low-income children (below 100% FPL) had 23% unmet dental care needs in 2019, versus 7% for high-income children.
03
Individuals with less than high school education had 2.5 times higher smoking rate at 28% versus 11% for college graduates in 2020.
04
Poor adults had diabetes prevalence of 13.8% in 2019, 2 times higher than non-poor at 6.9%.
05
Low SES neighborhoods had 30% higher air pollution exposure linked to 15% more asthma hospitalizations.
06
Adults with income <20k had 18.5% depression rate in 2021, versus 6.8% for >70k income.
07
Near-poor elderly had 25% higher rate of skipping medications due to cost at 15% versus 5% for high-income.
08
Low-income women had cervical cancer screening rate of 75% versus 88% for high-income in 2019.
09
Households below poverty had 40% higher food insecurity rate at 22% in 2021.
10
Education below college linked to 50% higher cardiovascular disease mortality risk.
11
Low SES adults had 3 times higher chronic kidney disease prevalence at 18%.
12
Poor children had 2.8 times higher lead poisoning rate >5ug/dL at 2.5%.
13
Income <25k associated with 35% higher hypertension control failure.
14
Low education mothers had infant mortality 1.7 times higher.
15
Uninsured low-income had ER visits 2x higher for preventable conditions.
16
Poverty linked to 20% higher adult vaccination gaps for flu.
17
Low SES had 28% opioid prescription rates but 45% overdose deaths.
18
Poor rural adults had 15% higher suicide rates.
19
Income disparity caused 25% more mental health untreated cases.
20
Low education <HS had 45% COPD prevalence vs 10% college grads.
21
Poverty households had 35% child asthma higher.
22
Income <$20k had 50% mental health access barriers.
Interpretation
Socioeconomic Disparities Interpretation
Across socioeconomic groups, health outcomes are consistently worse for lower income and education levels, such as obesity rising from 29.7% above $75,000 income to 41.3% below $25,000 and depression reaching 18.5% for those under $20k versus 6.8% for those over $70k.
Reference
Cite This Report
This report is designed to be cited. We maintain stable URLs and versioned verification dates. Copy the format appropriate for your publication below.
APA
Aisha Okonkwo. (2026, February 13). Health Equity Statistics. Gitnux. https://gitnux.org/health-equity-statistics
MLA
Aisha Okonkwo. "Health Equity Statistics." Gitnux, 13 Feb 2026, https://gitnux.org/health-equity-statistics.
Chicago
Aisha Okonkwo. 2026. "Health Equity Statistics." Gitnux. https://gitnux.org/health-equity-statistics.