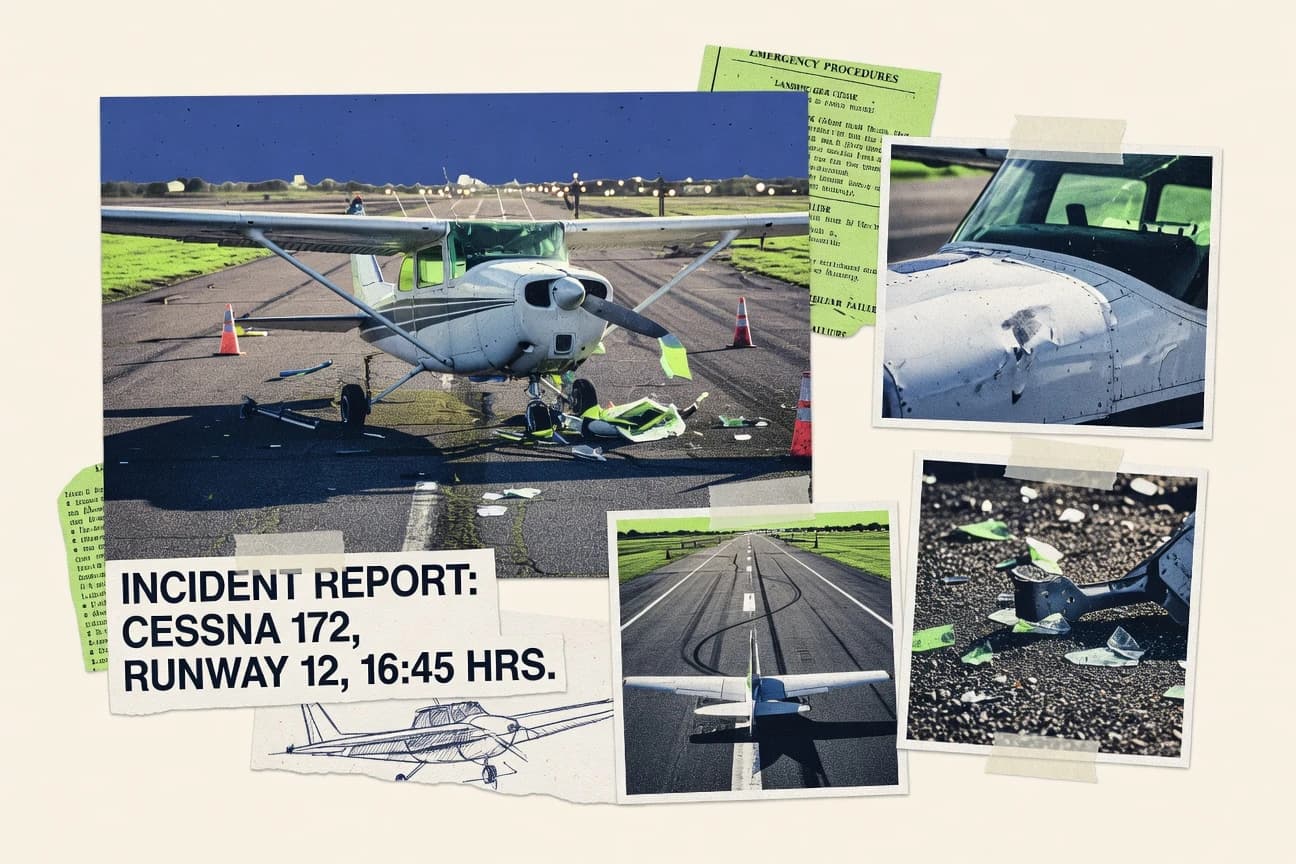

General aviation accidents still average more than 1,200 each year. Single-engine fixed-wing aircraft account for 78 percent of the total. Loss of control in flight drives 42 percent of the fatal cases.
Key Takeaways
- In 2022, the United States experienced 1,225 general aviation accidents, marking a 0.8% increase from 2021.
- Single-engine fixed-wing aircraft involved in 78% of GA accidents 2022.
- Loss of control in flight caused 42% of GA fatal accidents 2001-2016.
- 62% of GA accidents occurred in VFR conditions 2022.
- In 2022, general aviation accidents resulted in 358 total fatalities worldwide.
- Pilots with less than 100 hours total time involved in 22% GA accidents 2022.
Most general aviation accidents involve preventable factors, making pilot awareness and safety practices crucial.
Related reading
01 · Category
Accident Rates and Totals30 stats
01
In 2022, the United States experienced 1,225 general aviation accidents, marking a 0.8% increase from 2021.
02
From 2018 to 2022, the general aviation fatal accident rate was 0.95 per 100,000 flight hours in the U.S.
03
In 2021, fixed-wing single-engine aircraft accounted for 1,020 of 1,216 total GA accidents, representing 83.8%.
04
The U.S. GA accident rate dropped to 5.85 per 100,000 flight hours in 2020 from 6.24 in 2019.
05
Between 2012-2021, GA accidents averaged 1,239 per year in the U.S.
06
In 2019, 1,301 GA accidents occurred, with 70% involving fixed-wing aircraft.
07
The GA non-fatal accident rate was 4.89 per 100,000 hours in 2022.
08
From 2008-2017, rotorcraft GA accidents totaled 2,145, averaging 215 annually.
09
U.S. GA accidents in 2017 numbered 1,221, down 5% from 2016.
10
In 2023 preliminary data, GA accidents reached 1,180 through October.
11
GA accident rate for personal flying was 5.12 per 100,000 hours in 2021.
12
From 2013-2022, amateur-built aircraft had 1,456 accidents.
13
U.S. GA accidents peaked at 1,845 in 2005 before declining steadily.
14
In 2016, 1,287 GA accidents were reported, with a rate of 5.67 per 100k hours.
15
Experimental category GA aircraft saw 289 accidents in 2022.
16
GA accidents during takeoff/landing phases comprised 52% of total in 2020.
17
From 1945-2022, over 80,000 GA accidents occurred in the U.S.
18
2022 GA accident rate for turbine aircraft was 2.41 per 100k hours.
19
In Europe, GA accidents averaged 170 per year from 2014-2023.
20
U.S. GA accidents in 2015 totaled 1,259.
21
Piston single-engine GA accidents numbered 947 in 2021.
22
GA accident rate improved 47% from 2005-2022.
23
In 2018, 1,307 GA accidents, highest since 2009.
24
Ultralight GA accidents totaled 45 in 2022.
25
From 2010-2019, GA accidents declined 18% overall.
26
2020 saw 1,215 GA accidents due to COVID flight reductions.
27
GA accidents per million departures averaged 12.3 from 2017-2021.
28
In Australia, GA accidents were 142 in 2022.
29
U.S. GA accidents in controlled airspace: 28% of total in 2021.
30
From 2000-2022, GA accidents decreased by 35%.
Interpretation
Accident Rates and Totals Interpretation
While the overall trend shows a heartening 47% improvement in safety since 2005, the stubbornly high number of accidents—still averaging over 1,200 a year—serves as a sobering reminder that in general aviation, the most critical safety device remains a vigilant, well-trained pilot.
02 · Category
Aircraft Types Involved25 stats
01
Single-engine fixed-wing aircraft involved in 78% of GA accidents 2022.
02
Cessna 172 series featured in 12% of GA accidents 2018-2022.
03
Rotorcraft comprised 13% of U.S. GA accidents in 2021.
04
Experimental/amateur-built aircraft: 24% of GA accidents 2020.
05
Piper PA-28 series in 9% GA accidents 2019.
06
Light sport aircraft (LSA) accidents: 78 in 2022.
07
Turbine-powered GA: 6% of accidents but higher severity 2021.
08
Beechcraft Bonanza involved in 4.5% fatal GA accidents.
09
Multi-engine piston: 8% of GA fleet but 15% accidents 2017.
10
Gliders: 2% of GA accidents annually 2012-2021.
11
RV series (Van's) amateur-built: 18% of experimental accidents.
12
Helicopters like Robinson R44: 22 fatal accidents 2000-2020.
13
Piston multi-engine: accident rate 4.2 per 100k hours 2022.
14
Ultralights: 3% of total GA accidents 2021.
15
Cirrus SR20/22 with CAPS used in 2% accidents, saved 85% occupants.
16
Tailwheel aircraft: 28% of GA accidents 2016-2020.
17
Jet-powered GA (very light jets): 1.5% accidents 2018-2022.
18
Mooney aircraft: higher fatal rate 1.8 per 100k hours.
19
Fixed-wing single piston over 75%: 82% GA accidents.
20
Lancair series experimental: 5% fatal accidents in category.
21
Gyroplanes: 45 accidents 2010-2020.
22
Twin turboprops: lowest accident rate 1.9 per 100k hours.
23
Kitfox and similar STOL: 3% amateur-built accidents.
24
Older aircraft pre-1960: 11% of GA accidents 2022.
25
Balloons: 1 accident per 100k hours rate.
Interpretation
Aircraft Types Involved Interpretation
While single-engine pistons dominate the accident totals like a predictable chorus, the real plot twists lie in the outliers—where experimental ambition, rotorcraft complexity, or even the vintage charm of a tailwheel can turn a Sunday flight into a statistic.
03 · Category
Causal Factors27 stats
01
Loss of control in flight caused 42% of GA fatal accidents 2001-2016.
02
Fuel exhaustion accounted for 13% of GA accidents 2017-2021.
03
Mechanical failure primary cause in 15% of GA accidents 2022.
04
Loss of control during landing: 25% of GA accidents 2018-2022.
05
In-flight stall/spin caused 9% of fatal GA accidents 2019.
06
Runway excursions represented 22% of GA accidents 2021.
07
Controlled flight into terrain (CFIT): 14% of fatal GA 2012-2021.
08
Engine failure: 12.5% of GA accidents 2020.
09
Mid-air collisions: 4% of GA accidents but 10% fatal 2022.
10
Improper maintenance caused 8% of GA accidents 2017.
11
Fuel-related issues in 11% of GA fatal accidents 2008-2017.
12
System/component failure/malfunction: 18% GA accidents 2021.
13
VFR into IMC: 7% of GA fatal accidents 2016.
14
Gear collapse: 16% of GA accidents during landing 2022.
15
Spatial disorientation: 5% of GA accidents 2015.
16
Propeller strikes: 3% of GA accidents 2020.
17
Bird strikes caused 1.2% of GA accidents 2019-2023.
18
Overweight aircraft: 2% of GA accidents 2021.
19
Icing-related: 3.5% of GA fatal accidents in winter months.
20
Taxiing collisions: 9% of GA accidents 2018.
21
Fuel starvation (not exhaustion): 6% GA accidents 2022.
22
Carburetor icing: 4% of GA accidents in IMC 2017-2021.
23
Windshear encounters: 2.8% of GA accidents during approach.
24
Ground resonance in rotorcraft: 1% of GA helicopter accidents.
25
Retraction of flaps prematurely: 5% landing accidents.
26
Powerplant failure after takeoff: 11% fatal GA 2001-2020.
27
Inadequate preflight inspection caused 7% accidents 2021.
Interpretation
Causal Factors Interpretation
While human error, often disguised as a loss of control or a skipped checklist, remains the haunting melody in general aviation's accident symphony, the persistent and grumbling bassline of fuel mismanagement and mechanical neglect ensures the tune never ends on a high note.
More related reading
04 · Category
Environmental and Operational Factors26 stats
01
62% of GA accidents occurred in VFR conditions 2022.
02
Adverse weather contributed to 25% GA fatal accidents 2017-2021.
03
Night conditions in 21% of GA accidents 2021.
04
IFR conditions: 12% GA accidents but 30% fatal 2020.
05
High density altitude caused 7% GA accidents summer months.
06
Crosswind landings: 18% runway excursions 2019.
07
48% GA accidents during landing phase 2022.
08
Turbulence encounters: 5% GA accidents enroute.
09
Off-airport landings: 11% accidents in remote areas 2017.
10
Winter icing season: 22% fatal GA accidents Dec-Feb.
11
Non-towered airports: 75% of GA accidents 2021.
12
16% GA accidents during takeoff phase.
13
Mountainous terrain: 3x higher GA accident rate.
14
Low visibility (<3 miles): 14% VFR accidents.
15
Summer thermals: 9% loss of control accidents.
16
Water operations (seaplanes): 4% accidents higher rate.
17
High winds (>15 kts): 23% runway excursion causes.
18
Coastal fog: 6% GA accidents in CA, FL areas.
19
Pattern work: 32% accidents at non-towered fields.
20
Thunderstorm proximity: 4% GA accidents with lightning.
21
Hot/high airports: 12% takeoff accidents.
22
27% GA accidents on weekends/holidays.
23
Overwater flights without lifejackets: 8% ditchings.
24
Dust devils/microbursts: 2% desert GA accidents.
25
14% GA accidents during cruise flight phase.
26
Short final approaches (<300 ft AGL): 41% landing accidents.
Interpretation
Environmental and Operational Factors Interpretation
It seems the sky's checklist for trouble is written in conditions pilots know well, but these stark numbers shout that familiar skies often breed complacency, which is the most unpredictable weather of all.
05 · Category
Fatal Accident Statistics27 stats
01
In 2022, general aviation accidents resulted in 358 total fatalities worldwide.
02
U.S. GA fatal accidents numbered 209 in 2022, down 12% from 2021.
03
From 2018-2022, GA fatal accident rate was 0.84 per 100k hours.
04
Single-engine fixed-wing aircraft had 153 fatal GA accidents in 2021.
05
In 2020, 200 GA fatalities occurred in the U.S.
06
Between 2012-2021, average 181 GA fatalities per year in U.S.
07
2019 U.S. GA fatal accidents: 211, with 367 total fatalities.
08
GA fatal accident rate for 2022 was 0.90 per 100k hours.
09
Rotorcraft fatal GA accidents averaged 24 per year 2008-2017.
10
In 2017, U.S. GA fatal accidents totaled 228.
11
Preliminary 2023 GA fatalities in U.S.: 195 through October.
12
Personal GA flying fatal rate: 1.03 per 100k hours in 2021.
13
Amateur-built GA fatal accidents: 42 in 2022.
14
GA fatal accidents peaked at 494 in 2005.
15
2016 U.S. GA fatalities: 400 from 240 fatal accidents.
16
Turbine GA fatal accidents: 22 in 2022.
17
52% of GA fatal accidents occur during cruise in 2020 data.
18
Worldwide GA fatalities from 1945-2022 exceed 25,000.
19
2022 GA fatal rate for multi-engine piston: 1.25 per 100k hours.
20
European GA fatal accidents: 32 in 2022.
21
U.S. GA fatal accidents in 2015: 235.
22
Piston single fatal GA accidents: 169 in 2021.
23
GA fatal rate declined 53% from 2005-2022.
24
2018 U.S. GA fatal accidents: 225.
25
Ultralight fatal GA accidents: 8 in 2022.
26
2010-2019 GA fatal accidents down 25%.
27
2020 GA fatal accidents: 179 due to reduced flying.
Interpretation
Fatal Accident Statistics Interpretation
While the general aviation community should celebrate that safety has drastically improved from its grim peak, the sobering reality is that each year's tally of preventable tragedies, still hovering around a couple hundred souls, represents not a statistic but a profound, ongoing failure of vigilance.
06 · Category
Pilot Factors25 stats
01
Pilots with less than 100 hours total time involved in 22% GA accidents 2022.
02
41% of GA fatal accident pilots exceeded 12-hour duty day in 2017-2021.
03
Private pilots flew 67% of GA accidents despite 49% flight hours.
04
15% of GA accidents involved pilots aged 60-69 years 2020.
05
Pilots without current biennial flight review: 8% accidents 2019.
06
CFIT accidents 75% involved pilots with less than 500 hours.
07
28% GA accidents with pilots having 100-499 hours total time.
08
Night flying pilots in 18% fatal GA accidents 2021.
09
Student pilots: 12% of GA accidents 2022.
10
ATP certificate holders had accident rate 2.3 per 100k hours.
11
52% GA fatal pilots had no instrument rating 2012-2021.
12
Pilots 20-29 years old: 19% accidents despite 12% pilots.
13
Medical certificate violations in 6% GA accidents 2018.
14
Commercial pilots: lower accident rate 3.8 per 100k hours.
15
35% accidents involved pilots not using checklist.
16
Instrument-rated pilots still 22% VFR-into-IMC accidents.
17
Female pilots: 5% GA accidents, rate similar to males.
18
Pilots with 500-999 hours: peak accident involvement 25%.
19
Recent experience lacking: 31% fatal stall/spin pilots.
20
Sport pilots: accident rate 5.5 per 100k hours 2021.
21
9% GA accidents with dual instruction but pilot error.
22
Pilots over 70: 10% accidents, higher fatal rate.
23
Decision-making errors: 53% primary GA accident cause.
24
Skill-based errors in 26% GA accidents 2020.
25
Fatigue cited in 20% GA fatal accidents night operations.
Interpretation
Pilot Factors Interpretation
The statistics paint a clear, sobering picture: inexperience, complacency, and poor judgment are the unholy trinity hunting general aviation, where a pilot's logbook often reads like a risk assessment and the most dangerous instrument is the one between their ears.
Reference
Cite This Report
This report is designed to be cited. We maintain stable URLs and versioned verification dates. Copy the format appropriate for your publication below.
APA
Elena Vasquez. (2026, February 13). General Aviation Accident Statistics. Gitnux. https://gitnux.org/general-aviation-accident-statistics
MLA
Elena Vasquez. "General Aviation Accident Statistics." Gitnux, 13 Feb 2026, https://gitnux.org/general-aviation-accident-statistics.
Chicago
Elena Vasquez. 2026. "General Aviation Accident Statistics." Gitnux. https://gitnux.org/general-aviation-accident-statistics.
Sources & references
7 datasets cited across this report · attribution is report-level