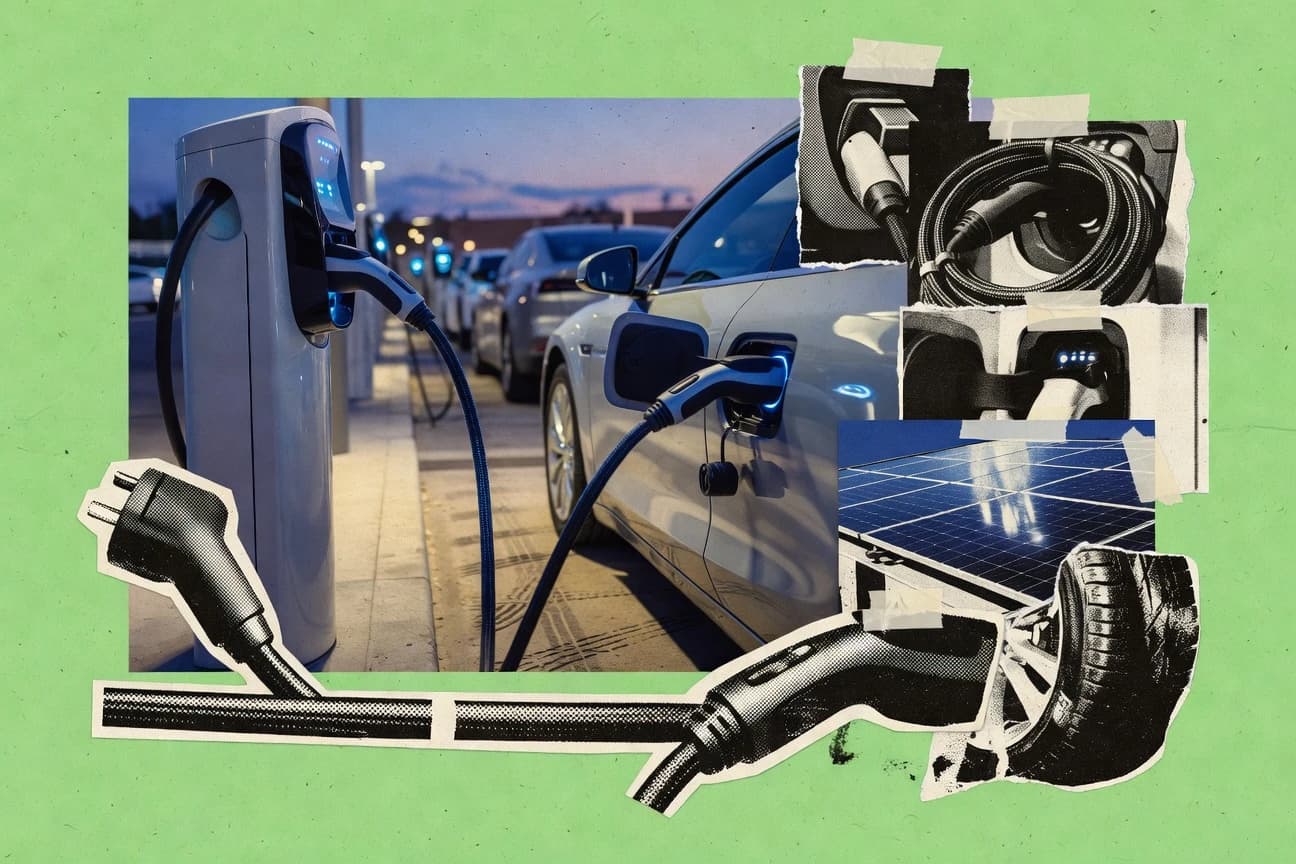

From sub half hour fast charging to record drops in lithium-ion battery prices, the EV industry is rewriting the tradeoffs people used to assume were fixed. By end 2023, the global plug-in fleet reached 11.3 million BEVs on the road and Level 3 DC fast chargers had climbed to about 20% of public chargers, while studies still show lifecycle emissions can swing dramatically depending on grid mix and manufacturing impacts. This post pulls together the key metrics behind those shifts so you can see where the biggest wins come from and where the real uncertainty remains.
Key Takeaways
- Fast-charging can provide typical usable range gains in under 30 minutes in many commercial BEVs (depends on battery and charger power).
- Tesla Model 3 (for example) achieves an EPA-rated range of up to about 272–358 miles depending on variant (reported by EPA vehicle specs).
- France had 85,000 public charging points by end-2023 (public stations).
- The EU Regulation (EU) 2019/631 sets CO2 emission performance standards for cars: 100% reduction by 2035 for new cars (zero-emission target).
- The U.S. Inflation Reduction Act created a Commercial Clean Vehicle Credit of up to $40,000 for eligible commercial vehicles (maximum credit amount).
- In the IEA Net Zero scenario, EVs and other electrification reduce oil demand by about 5 mb/d by 2030 (partly due to EV uptake).
- The lifecycle assessment study reports EVs can have 30–60% lower lifecycle GHG emissions than ICE vehicles across many grid mixes.
- CO2 emissions from EV manufacturing were found to be higher than ICE equivalents, but operational emissions savings can offset within a number of years (study-dependent).
- The United States accounted for 14.0% of the 2023 global plug-in electric car sales total (BEVs+PHEVs)
- 11.3 million battery-electric cars (BEVs) were on the road globally at end-2023, representing 63% of the plug-in electric vehicle fleet
- China had 8.0 million plug-in electric cars added in 2023 (BEVs+PHEVs), the largest market globally
- A 2024 study found passenger BEV models used in major markets have a mean energy consumption of about 0.18 kWh/km (vehicle-to-wheel), based on measured/declared data samples
- In 2023, the median DC fast charger price in Europe was about €90,000 per site for a typical multi-connector installation (reported benchmark pricing)
- The global share of Level 3/DC fast chargers increased to about 20% of public chargers by end-2023 (ports share in aggregated public infrastructure datasets)
- From 2010 to 2023, BNEF estimated battery pack prices fell from about $1,100/kWh to about $139/kWh (global average trend)
In 2023, EVs surged globally as fast charging expanded, battery costs fell, and lifetime emissions and costs improved.
Related reading
01 · Category
Performance Metrics2 stats
01
Fast-charging can provide typical usable range gains in under 30 minutes in many commercial BEVs (depends on battery and charger power).
02
Tesla Model 3 (for example) achieves an EPA-rated range of up to about 272–358 miles depending on variant (reported by EPA vehicle specs).
Interpretation
Performance Metrics Interpretation
For performance metrics, fast-charging can add typical usable range in under 30 minutes on many commercial BEVs, and the Tesla Model 3’s EPA range up to about 358 miles shows how quickly and far these vehicles can go in practical real-world driving.
02 · Category
Charging Infrastructure1 stats
01
France had 85,000 public charging points by end-2023 (public stations).
Interpretation
Charging Infrastructure Interpretation
By the end of 2023, France had 85,000 public charging points, showing steady growth in the country’s charging infrastructure capacity for electric vehicles.
03 · Category
Policy & Incentives2 stats
01
The EU Regulation (EU) 2019/631 sets CO2 emission performance standards for cars: 100% reduction by 2035 for new cars (zero-emission target).
02
The U.S. Inflation Reduction Act created a Commercial Clean Vehicle Credit of up to $40,000for eligible commercial vehicles (maximum credit amount).
Interpretation
Policy & Incentives Interpretation
Under Policy and Incentives, the EU’s EU Regulation 2019/631 pushes new cars toward a 100% CO2 reduction by 2035 while the U.S. Inflation Reduction Act backs eligible commercial EVs with credits up to $40,000, signaling increasingly aggressive government support on both emissions and purchase costs.
04 · Category
Environmental Impact3 stats
01
In the IEA Net Zero scenario, EVs and other electrification reduce oil demand by about 5 mb/d by 2030 (partly due to EV uptake).
02
The lifecycle assessment study reports EVs can have 30–60% lower lifecycle GHG emissions than ICE vehicles across many grid mixes.
03
CO2 emissions from EV manufacturing were found to be higher than ICE equivalents, but operational emissions savings can offset within a number of years (study-dependent).
Interpretation
Environmental Impact Interpretation
From an Environmental Impact perspective, EV adoption under the IEA Net Zero pathway helps cut oil demand by about 5 mb/d by 2030 and lifecycle studies find 30 to 60 percent lower greenhouse gas emissions than ICE vehicles across many grid mixes, even though manufacturing emissions can be higher and tend to be offset by cleaner operation over time.
05 · Category
Market Size4 stats
01
The United States accounted for 14.0% of the 2023 global plug-in electric car sales total (BEVs+PHEVs)
02
11.3 million battery-electric cars (BEVs) were on the road globally at end-2023, representing 63% of the plug-in electric vehicle fleet
03
China had 8.0 million plug-in electric cars added in 2023 (BEVs+PHEVs), the largest market globally
04
In China, 2023 plug-in electric vehicle sales were 9.49 million units (BEV+PHEV).
Interpretation
Market Size Interpretation
For the market size angle, plug-in electric vehicle sales and fleet growth are heavily concentrated, with China adding 8.0 million vehicles in 2023 and reaching 9.49 million in total sales while the global BEV fleet totals 11.3 million, and the United States accounts for 14.0% of global 2023 plug-in sales.
More related reading
06 · Category
Industry Trends3 stats
01
A 2024 study found passenger BEV models used in major markets have a mean energy consumption of about 0.18 kWh/km (vehicle-to-wheel), based on measured/declared data samples
02
In 2023, the median DC fast charger price in Europe was about €90,000 per site for a typical multi-connector installation (reported benchmark pricing)
03
The global share of Level 3/DC fast chargers increased to about 20% of public chargers by end-2023 (ports share in aggregated public infrastructure datasets)
Interpretation
Industry Trends Interpretation
Industry trends show EV infrastructure and efficiency are moving quickly as mean passenger BEV energy use sits around 0.18 kWh per km, Europe’s typical multi-connector DC fast sites cost about €90,000, and Level 3 and DC fast charging already make up roughly 20% of public chargers by end 2023.
07 · Category
Cost Analysis6 stats
01
From 2010 to 2023, BNEF estimated battery pack prices fell from about $1,100/kWh to about $139/kWh (global average trend)
02
A 2024 report estimated that raw lithium price volatility contributed to roughly 10–20% swings in the cost of cathode materials during 2023 (case-based sensitivity range)
03
In 2023, average EV total cost of ownership (TCO) compared to ICE improved in many markets, with some studies finding EVs 10–25% cheaper over typical lifetimes depending on energy prices and policy
04
A 2023 peer-reviewed meta-analysis reported that direct-well-to-wheel energy use for BEVs is typically about 50% lower than for conventional ICE cars (weighted averages across studies)
05
From 2010 to 2023, the cumulative learning rate implied a 89% reduction in lithium-ion battery costs (pack-cost improvement over the period as reported in Benchmark Mineral Intelligence analysis).
06
In 2023, China’s EV subsidies were reduced, with central government providing purchase incentives up to ¥31,000 for eligible BEVs depending on energy efficiency class and range (policy amount ceiling).
Interpretation
Cost Analysis Interpretation
From 2010 to 2023, rapid battery pack cost declines from about $1,100 per kWh to about $139 per kWh helped drive the cost competitiveness of EVs, with 2023 meta findings showing BEV energy use about 50% lower than ICE and many markets reporting EVs roughly 10 to 25% cheaper over typical lifetimes despite lithium-driven cathode cost swings of around 10 to 20%.
08 · Category
Infrastructure3 stats
01
In 2023, Europe added 240,000 public charging points (net additions for the year, per IEA’s global accounting).
02
As of end-2023, the U.K. had 44,000 public charging devices (public charging locations/devices total reported by U.K. government monitoring).
03
In 2024, the U.S. added 63,000 public EV charging ports (month-by-month AFDC cumulative additions during 2024).
Interpretation
Infrastructure Interpretation
In 2023 Europe added 240,000 public charging points and the UK reached 44,000 devices by end-year, while in 2024 the US expanded by 63,000 charging ports, showing that EV infrastructure is steadily scaling across major markets rather than growing in fits and starts.
09 · Category
Technology2 stats
01
In 2023, the global average charging time for 10%–80% state-of-charge on DC fast charging was about 31 minutes in public evaluations (median from compiled test results).
02
A 2021 peer-reviewed review found that the energy consumption gap between EVs and ICE vehicles widens under higher gasoline/diesel fuel-efficiency scenarios, with EVs typically requiring less energy per distance travelled across many operating conditions.
Interpretation
Technology Interpretation
For the Technology angle, EVs are showing faster real world charging with a median public test of about 31 minutes to go from 10% to 80% on DC fast charging in 2023, while research also indicates that under stricter fuel efficiency scenarios the EV versus ICE energy gap can widen, meaning the technology benefits can grow rather than shrink as conditions become more demanding.
Reference
Cite This Report
This report is designed to be cited. We maintain stable URLs and versioned verification dates. Copy the format appropriate for your publication below.
APA
Christopher Morgan. (2026, February 13). Electric Vehicles Industry Statistics. Gitnux. https://gitnux.org/electric-vehicles-industry-statistics
MLA
Christopher Morgan. "Electric Vehicles Industry Statistics." Gitnux, 13 Feb 2026, https://gitnux.org/electric-vehicles-industry-statistics.
Chicago
Christopher Morgan. 2026. "Electric Vehicles Industry Statistics." Gitnux. https://gitnux.org/electric-vehicles-industry-statistics.
Sources & references
26 datasets cited across this report · attribution is report-level
+12 additional datasets cited (not shown individually)