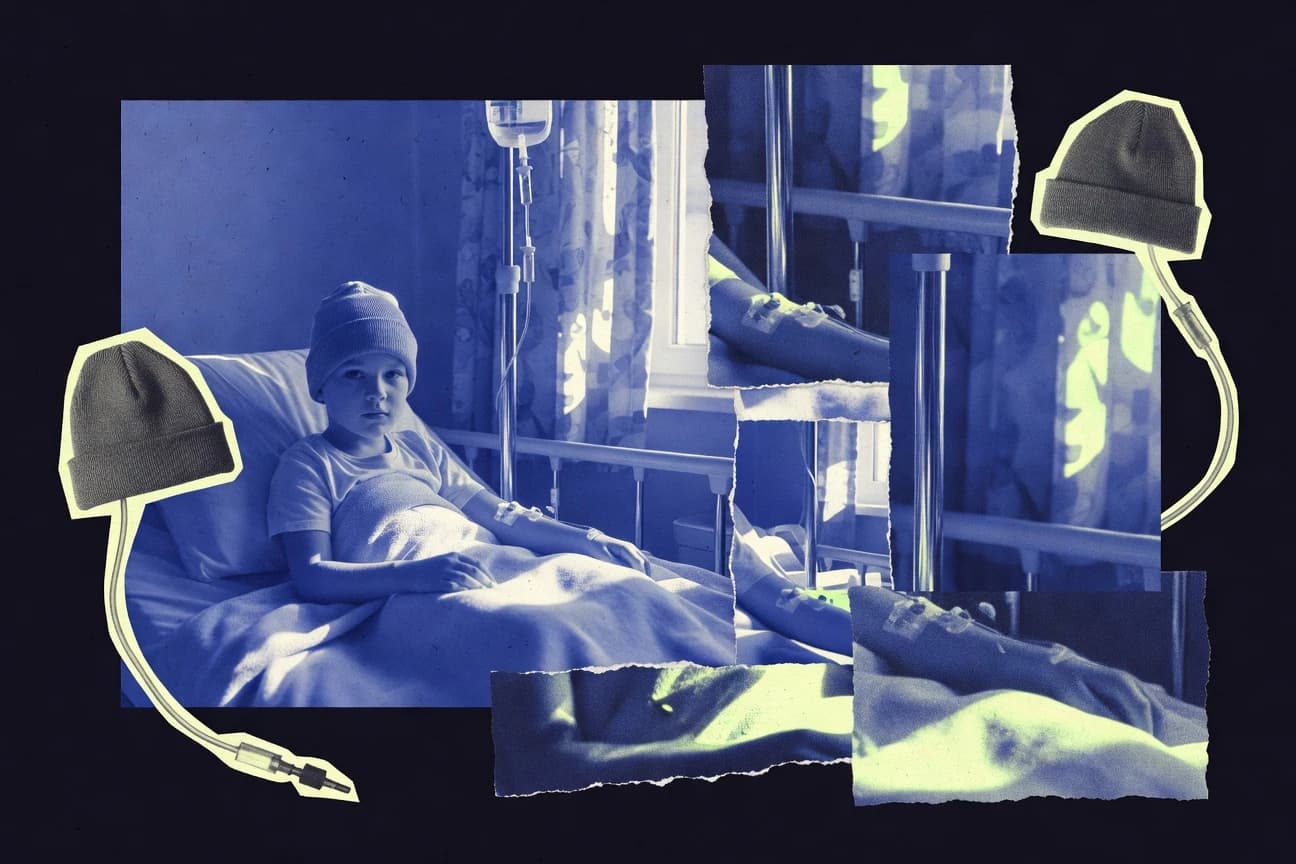

Worldwide, about 400,000 children and adolescents aged 0–19 are diagnosed with cancer each year. The burden is uneven: in low- and middle-income countries, 90% of cases occur despite only 10% of global diagnoses, and treatment gaps drive higher mortality. As you read, you’ll see how risk factors—from inherited conditions to exposures—affect outcomes, and how survival improves with stronger care.
Key Takeaways
- Worldwide, approximately 400,000 children and adolescents aged 0-19 years are diagnosed with cancer each year
- In the United States, about 15,780 children and adolescents aged 0-19 years were diagnosed with cancer in 2022
- The incidence rate of childhood cancer in Europe is around 140-150 cases per million children under 15 years annually
- Globally, 90% of childhood cancers occur in low/middle-income countries despite only 10% diagnoses there
- Childhood cancer mortality worldwide is 95,000 deaths per year in 0-19 year olds
- In the US, about 1,720 children under 20 die from cancer annually
- Genetic counseling identifies 10-15% hereditary cancer risk in kids, improving outcomes
- Down syndrome increases leukemia risk 20-50 fold
- Ionizing radiation exposure doubles subsequent cancer risk
- 5-year survival for childhood ALL is 90% in high-income countries
- Overall 5-year survival for US childhood cancer improved from 58% (1975) to 85% (2020)
- Neuroblastoma 5-year survival 82% overall, 93% low-risk in US
- Leukemia represents 29% of childhood cancers
- Acute lymphoblastic leukemia (ALL) is 75% of childhood leukemias
- Brain and CNS tumors are 26% of childhood cancers
About 400,000 children are diagnosed yearly, yet survival depends heavily on access to timely treatment.
Related reading
01 · Category
Incidence30 stats
01
Worldwide, approximately 400,000 children and adolescents aged 0-19 years are diagnosed with cancer each year
02
In the United States, about 15,780 children and adolescents aged 0-19 years were diagnosed with cancer in 2022
03
The incidence rate of childhood cancer in Europe is around 140-150 cases per million children under 15 years annually
04
In low- and middle-income countries, childhood cancer incidence is estimated at 100-150 per million children aged 0-14 years
05
Leukemia accounts for 28% of all childhood cancers in the US, with an incidence of about 43 per million children under 20
06
Brain and other central nervous system cancers have an incidence of 27 per million in US children aged 0-19
07
In the UK, there are around 1,900 new cases of childhood cancer diagnosed each year in children aged 0-14
08
Global childhood cancer incidence has increased by about 1% per year over the past few decades due to better diagnostics
09
In India, childhood cancer incidence is approximately 40-50 per million children under 15
10
Australia reports 600-700 new childhood cancer cases annually in children under 15
11
In Africa, childhood cancer incidence is underreported but estimated at 50-100 per million
12
Canada sees about 1,050 new cases per year in children 0-14
13
Incidence of neuroblastoma is 10.2 per million in US children under 20
14
Wilms tumor incidence is 7.6 per million in US children 0-19
15
In Brazil, around 8,500 new childhood cancer cases yearly
16
Japan reports 2,300 childhood cancer cases annually under age 15
17
Incidence peaks at ages 2-3 years for most childhood cancers except brain tumors
18
In Europe, 35,000 new cases yearly in 0-14 year olds
19
US Hispanic children have 15% higher incidence than non-Hispanic whites
20
Global prevalence of childhood cancer survivors is about 500,000
21
In 2020, 47,753 new cases in Europe for ages 0-19
22
Incidence of Hodgkin lymphoma is 5.6 per million in US teens 15-19
23
South Africa estimates 1,200 new cases yearly under 15
24
In China, over 15,000 new childhood leukemia cases annually
25
Incidence rate for all childhood cancers in US is 17.9 per 100,000 under 20
26
In Mexico, 5,000-6,000 new cases per year in children
27
Egypt reports 1,500-2,000 cases yearly under 15
28
Incidence of retinoblastoma is 3.8 per million globally
29
In France, 2,000 new cases annually in 0-18 year olds
30
US Black children have lower incidence of embryonal tumors but higher lymphomas
Interpretation
Incidence Interpretation
From an incidence perspective, childhood cancer is diagnosed worldwide at a scale of about 400,000 cases each year, and even in the US where 15,780 children and adolescents were diagnosed in 2022, leukemia alone contributes roughly 43 cases per million and brain and central nervous system cancers add about 27 per million.
02 · Category
Mortality30 stats
01
Globally, 90% of childhood cancers occur in low/middle-income countries despite only 10% diagnoses there
02
Childhood cancer mortality worldwide is 95,000 deaths per year in 0-19 year olds
03
In the US, about 1,720 children under 20 die from cancer annually
04
In low-income countries, 80-90% of childhood cancer patients die due to lack of treatment
05
Leukemia causes 30% of childhood cancer deaths globally
06
US childhood cancer mortality rate declined 68% from 1969-2018
07
In Africa, over 80% mortality rate for childhood cancer
08
UK childhood cancer mortality fell 30% in last 20 years
09
Globally, 50% of childhood cancer deaths occur in Asia
10
In India, childhood cancer mortality is around 60-70%
11
Brazil reports 2,500 childhood cancer deaths yearly
12
CNS tumors account for 26% of childhood cancer deaths in US
13
In Europe, 1,100 deaths per year from childhood cancer under 15
14
Australia mortality rate for childhood cancer is 2.2 per 100,000 under 15
15
In high-income countries, mortality reduced to under 20%
16
Leukemia mortality in US children is 3.5 per million under 20
17
In China, estimated 10,000 childhood cancer deaths annually
18
South Africa childhood cancer mortality exceeds 70%
19
In Canada, 250 deaths per year from childhood cancer
20
Global mortality for neuroblastoma is 50% in low-resource settings
21
Wilms tumor mortality <5% in US but >50% in LMICs
22
In Mexico, around 1,500 childhood cancer deaths yearly
23
Egypt mortality rate for childhood leukemia ~40%
24
France reports 400 childhood cancer deaths annually
25
In Japan, mortality rate 2 per 100,000 under 15
26
US mortality for brain tumors 1.9 per million children
27
In low/middle-income countries, only 30% access curative treatment, leading to high mortality
28
Global decline in childhood cancer mortality stalled in some regions post-2010
29
Leukemia mortality declined 80% in US since 1970s
30
In 2020, 22,090 childhood cancer deaths in Asia-Pacific
Interpretation
Mortality Interpretation
Even though childhood cancer mortality worldwide reaches about 95,000 deaths per year for ages 0 to 19 and leukemia accounts for 30% of those deaths, the burden is sharply concentrated because 90% of childhood cancers occur in low and middle income countries where 80 to 90% of patients die without adequate treatment.
03 · Category
Risk Factors26 stats
01
Genetic counseling identifies 10-15% hereditary cancer risk in kids, improving outcomes
02
Down syndrome increases leukemia risk 20-50 fold
03
Ionizing radiation exposure doubles subsequent cancer risk
04
Li-Fraumeni syndrome TP53 mutation causes 50% lifetime cancer risk
05
Beckwith-Wiedemann syndrome 7-10% risk of Wilms tumor
06
Family history increases retinoblastoma risk 90% bilateral cases heritable
07
HIV infection raises NHL and leiomyosarcoma risk 100-fold in kids
08
Neonatal jaundice or transfusions linked to 2x leukemia risk
09
Parental smoking increases childhood cancer risk by 10-20%
10
Alkylating agents in prior chemo raise secondary leukemia risk 100-fold
11
Neurofibromatosis type 1 8-13% risk optic glioma
12
Fanconi anemia 1000-fold AML risk
13
Ataxia-telangiectasia high lymphoma/leukemia risk
14
Bloom syndrome 150-300x leukemia risk
15
High birth weight >4kg doubles Wilms tumor risk
16
EBV infection linked to 30% endemic Burkitt lymphoma
17
DICER1 syndrome 10-20% pleuropulmonary blastoma risk
18
Maternal alcohol use increases neuroblastoma risk 2-3 fold
19
Pesticide exposure raises leukemia risk 40% in some studies
20
Congenital anomalies increase cancer risk 2.5-fold overall
21
No strong link to cell phones or power lines for childhood cancer
22
BRCA2 mutations 20% rhabdomyosarcoma risk in carriers
23
WAGR syndrome 50% Wilms tumor risk
24
Simpson-Golabi-Behmel overgrowth 10% embryonal tumor risk
25
HIV+ children 500x Kaposi sarcoma risk
26
Topoisomerase II inhibitors in pregnancy link to infant ALL
Interpretation
Risk Factors Interpretation
The risk factor picture for childhood cancer is strongly shaped by specific, measurable inherited vulnerabilities and exposures, with conditions like Down syndrome raising leukemia risk by 20 to 50 fold and TP53 mutations carrying about a 50 percent lifetime cancer risk.
More related reading
04 · Category
Treatment And Survival30 stats
01
5-year survival for childhood ALL is 90% in high-income countries
02
Overall 5-year survival for US childhood cancer improved from 58% (1975) to 85% (2020)
03
Neuroblastoma 5-year survival 82% overall, 93% low-risk in US
04
Wilms tumor 5-year survival >90% with treatment
05
Hodgkin lymphoma 5-year survival 95%+ in children
06
Retinoblastoma survival 99% if unilateral, 93% bilateral in developed countries
07
AML 5-year survival 70% in US children
08
Medulloblastoma 5-year survival 70-80% standard risk
09
Rhabdomyosarcoma survival 65% overall, 90% localized
10
Osteosarcoma 5-year survival 70% localized, 30% metastatic
11
Non-Hodgkin lymphoma survival >90% in high-resource settings
12
Ewing sarcoma 5-year survival 70-80% localized
13
84% of US childhood cancer survivors alive 10 years post-diagnosis
14
Chemotherapy cures 80%+ ALL without bone marrow transplant
15
Proton therapy reduces long-term effects in brain tumors, improving quality of life
16
CAR-T cell therapy shows 80% remission in relapsed B-ALL
17
Immunotherapy boosts survival in high-risk neuroblastoma to 50%
18
HSCT success 70-90% for high-risk leukemias
19
Targeted therapy with larotrectinib 75% response in NTRK fusion cancers
20
30-year survival for childhood cancer now >80% in Europe
21
Relapse-free survival for low-risk ALL 95% at 5 years
22
Multidisciplinary care improves survival by 20% in solid tumors
23
Late effects affect 80% of survivors, but survival focus on cure first
24
Bispecific antibodies achieve 70% MRD negativity in ALL
25
Precision medicine trials match 40% rare cancers to targeted drugs
26
Vaccine trials for HPV-related prevent cervical cancer in survivors
27
Exercise programs improve 5-year survival indirectly by reducing recurrence 30%
28
TKIs like imatinib cure 90% Philadelphia+ ALL with chemo
29
Intra-arterial chemo preserves eye in 90% retinoblastoma cases
30
GD2 vaccine + immunotherapy 50% event-free survival high-risk neuroblastoma
Interpretation
Treatment And Survival Interpretation
Across treatment and survival in childhood cancer, outcomes have risen dramatically, with overall US 5-year survival improving from 58% in 1975 to 85% in 2020 and high cure rates now common, such as 90% for childhood ALL in high-income countries and 99% for unilateral retinoblastoma in developed settings.
05 · Category
Types30 stats
01
Leukemia represents 29% of childhood cancers
02
Acute lymphoblastic leukemia (ALL) is 75% of childhood leukemias
03
Brain and CNS tumors are 26% of childhood cancers
04
Embryonal tumors (neuroblastoma, retinoblastoma, Wilms) comprise 12% of cases
05
Lymphomas account for 11% of childhood cancers globally
06
Neuroblastoma is the most common extracranial solid tumor, 7% of cases
07
Wilms tumor (nephroblastoma) is 5% of childhood cancers
08
Retinoblastoma affects 3% , mostly under age 5
09
Hodgkin lymphoma peaks in adolescence, 3% of cases
10
Non-Hodgkin lymphoma 5% , more common in boys
11
Rhabdomyosarcoma is 3% of childhood solid tumors
12
Osteosarcoma 3% , peaks ages 10-14
13
Ewing sarcoma 2% , more in teens
14
Germ cell tumors 3% , often gonadal
15
Acute myeloid leukemia (AML) 20% of leukemias
16
Medulloblastoma most common malignant brain tumor in children, 20% of pediatric brain cancers
17
Gliomas represent 50% of childhood CNS tumors
18
Hepatoblastoma 1% but most common liver cancer in kids under 5
19
Pleuropulmonary blastoma rare, <1%, lungs in young children
20
Desmoplastic small round cell tumor very rare, abdominal
21
In US, ALL incidence highest in Hispanic whites at 43 per million
22
Burkitt lymphoma subtype of NHL, aggressive, 30-40% of pediatric NHL in US
23
Pilocytic astrocytoma most common CNS tumor, low-grade
24
Clear cell sarcoma of kidney rare Wilms variant
25
Infantile fibrosarcoma <1%, congenital
26
Choroid plexus carcinoma 1% brain tumors, infants
27
Pineoblastoma rare pineal tumor, 1 per million kids
28
Anaplastic large cell lymphoma 10-15% pediatric NHL
29
Yolk sac tumor common germ cell, ovaries/testes
30
Dysgerminoma germ cell, good prognosis
Interpretation
Types Interpretation
Across the types of childhood cancer, leukemia dominates at 29% and is driven largely by acute lymphoblastic leukemia at 75%, making this category the clearest standout in the overall landscape.
Reference
Cite This Report
This report is designed to be cited. We maintain stable URLs and versioned verification dates. Copy the format appropriate for your publication below.
APA
James Okoro. (2026, February 13). Children Cancer Statistics. Gitnux. https://gitnux.org/children-cancer-statistics
MLA
James Okoro. "Children Cancer Statistics." Gitnux, 13 Feb 2026, https://gitnux.org/children-cancer-statistics.
Chicago
James Okoro. 2026. "Children Cancer Statistics." Gitnux. https://gitnux.org/children-cancer-statistics.
Sources & references
29 datasets cited across this report · attribution is report-level