
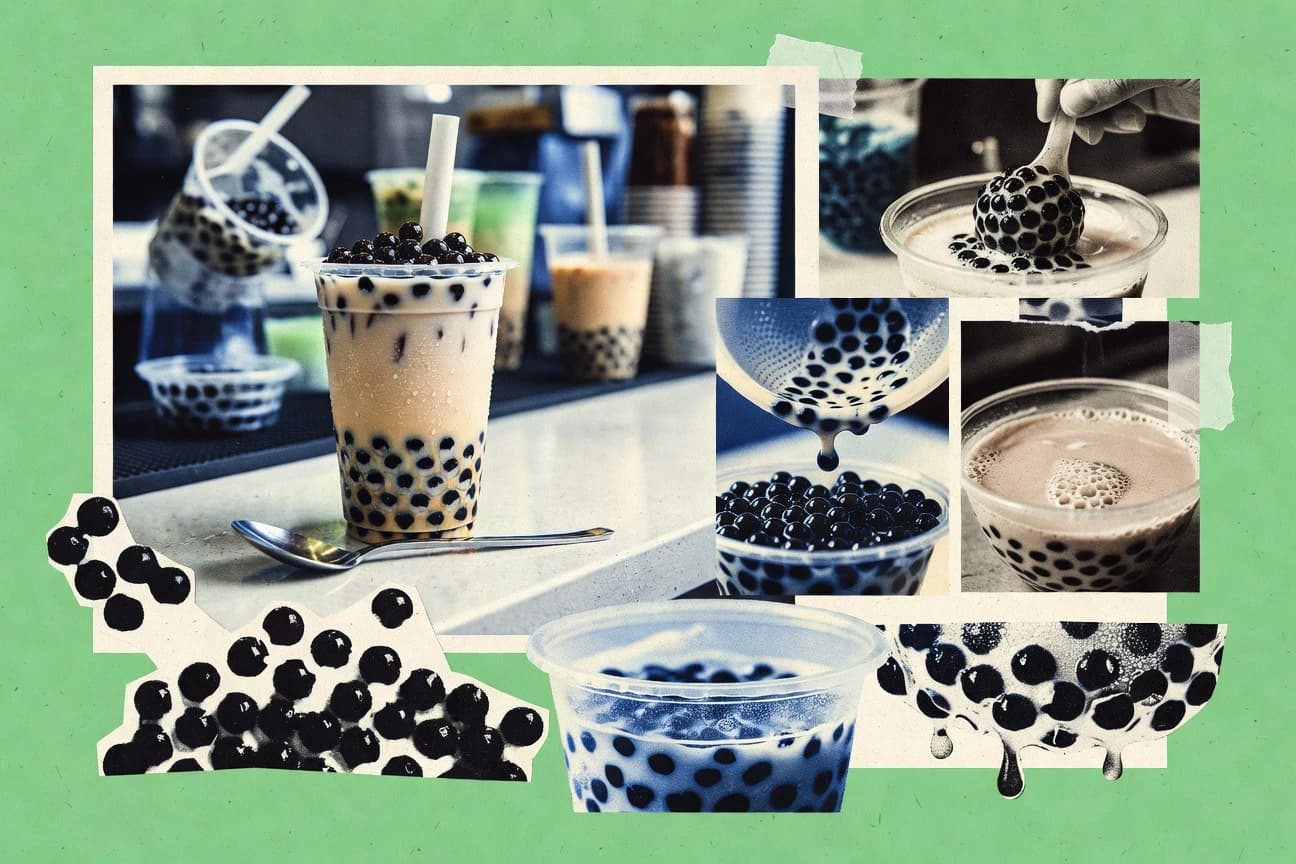

Global boba tea sales reached $3.46 billion last year. This analysis details the consumer habits, market expansion, and supply chain data driving its growth.
Key Takeaways
- 38% of US millennials consume boba tea at least once a month in 2023.
- Asia holds 65% of global boba tea outlets with 250,000 shops in 2023.
- The global boba tea market was valued at USD 3.46 billion in 2023 and is projected to reach USD 5.89 billion by 2030, growing at a CAGR of 7.9%.
- Global tapioca pearl production reached 450,000 metric tons in 2023.
- Global boba tea market CAGR projected at 8.5% through 2032.
Boba tea sales are rising fast, making it one of the fastest growing drinks in the market.
Related reading
01 · Category
Consumer Behavior26 stats
01
38% of US millennials consume boba tea at least once a month in 2023.
02
65% of boba tea consumers aged 18-24 prefer taro flavor globally in 2023.
03
Women account for 62% of boba tea purchases worldwide in 2023.
04
72% of Gen Z in Asia buy boba tea weekly, per 2023 survey.
05
Average boba tea consumer spends $15-20 per visit in the US in 2023.
06
55% of consumers choose boba tea for Instagram-worthy photos in 2023.
07
Vegan boba tea options preferred by 41% of consumers in Europe 2023.
08
48% of US boba drinkers also purchase coffee alternatives daily in 2023.
09
Toppings like pearls are chosen by 89% of boba tea orders globally 2023.
10
67% of consumers aged 25-34 seek low-sugar boba options in 2023.
11
Urban consumers represent 78% of boba tea sales in China 2023.
12
52% of boba tea fans visit shops for social hangouts in Asia 2023.
13
Dairy-free milk used in 35% of boba orders in North America 2023.
14
61% of consumers discover boba via social media influencers 2023.
15
Average order size for boba tea is 500ml in Southeast Asia 2023.
16
44% of parents buy boba for children under 12 in urban areas 2023.
17
Fruit tea variants chosen by 29% of health-focused consumers 2023.
18
Repeat purchase rate for boba tea is 76% among loyal customers 2023.
19
53% prefer customizable boba drinks in the US 2023.
20
Nighttime consumption peaks at 58% of daily sales in Asia 2023.
21
39% of consumers pair boba with snacks during purchases 2023.
22
Loyalty app users spend 25% more on boba tea annually 2023.
23
71% of Gen Z women cite taste as primary boba purchase reason 2023.
24
Online delivery accounts for 42% of boba orders in urban India 2023.
25
46% avoid boba due to calorie concerns in Europe 2023.
26
Brown sugar milk tea ordered by 33% of all boba consumers globally 2023.
Interpretation
Consumer Behavior Interpretation
Consumer Behavior is being shaped by social and taste preferences, with 72% of Gen Z in Asia buying boba tea weekly in 2023 and 55% choosing it for Instagram-worthy photos while women make up 62% of purchases worldwide.
02 · Category
Geographic Distribution28 stats
01
Asia holds 65% of global boba tea outlets with 250,000 shops in 2023.
02
Taiwan has 12,000 boba tea shops per 23 million population in 2023.
03
US boba shops numbered 8,500 across major cities in 2023.
04
China boasts over 450,000 boba outlets nationwide in 2023.
05
Southeast Asia has 45% market penetration in urban areas for boba 2023.
06
California accounts for 35% of all US boba tea shops in 2023.
07
South Korea has one boba shop per 5,000 residents in Seoul 2023.
08
Australia saw 1,200 new boba outlets open in major cities 2023.
09
India has 15,000 boba franchises in Tier 1 and 2 cities 2023.
10
UK boba shops concentrated 60% in London and Manchester 2023.
11
Vietnam's Ho Chi Minh City has 3,000 boba venues in 2023.
12
Philippines Manila metro area hosts 2,500 boba outlets 2023.
13
Thailand Bangkok has boba shops every 500 meters in key districts 2023.
14
Indonesia Jakarta saw 4,000 boba stores open since 2020 by 2023.
15
Malaysia Kuala Lumpur boba density is 1 per 2,000 people 2023.
16
Singapore has 800 licensed boba tea establishments in 2023.
17
Japan Tokyo prefecture has 1,800 boba specialty shops 2023.
18
Canada Toronto and Vancouver account for 70% of national boba shops 2023.
19
Brazil Sao Paulo has 1,200 boba outlets in urban zones 2023.
20
Germany Berlin and Munich host 450 boba shops combined 2023.
21
France Paris has 350 boba tea venues in 2023.
22
Middle East UAE Dubai leads with 500 boba outlets 2023.
23
New Zealand Auckland has 250 boba shops in 2023.
24
Mexico City boba stores reached 800 in 2023.
25
Italy Milan and Rome have 200 boba locations 2023.
26
Spain Barcelona boba shops number 150 in 2023.
27
Turkey Istanbul hosts 300 boba tea spots 2023.
28
South Africa Johannesburg has 120 boba outlets 2023.
Interpretation
Geographic Distribution Interpretation
Geographically, boba tea is heavily concentrated in Asia where it accounts for 65% of outlets with 250,000 shops in 2023, while the United States remains much smaller with 8,500 shops across major cities and California alone making up 35% of those US locations.
03 · Category
Market Size & Revenue29 stats
01
The global boba tea market was valued at USD 3.46 billion in 2023 and is projected to reach USD 5.89 billion by 2030, growing at a CAGR of 7.9%.
02
In the United States, boba tea sales reached $1.2 billion in 2022, with a year-over-year growth of 12.5%.
03
Asia-Pacific dominated the boba tea market with a 62% revenue share in 2023, driven by Taiwan and China.
04
The ready-to-drink boba tea segment accounted for 45% of total market revenue in 2023 globally.
05
North American boba tea market grew from $650 million in 2021 to $920 million in 2023 at 18.9% CAGR.
06
China's boba tea industry generated RMB 28.5 billion (USD 4.1 billion) in 2022.
07
Europe boba tea market size was EUR 380 million in 2023, expected to double by 2028.
08
Instant boba tea powder sales contributed 28% to global market revenue in 2023.
09
Taiwan's boba tea exports reached NT$15 billion (USD 480 million) in 2023.
10
US boba tea chain revenue averaged $2.5 million per outlet in 2022.
11
Global boba tea market revenue from online sales surged 35% to $450 million in 2023.
12
Southeast Asia boba tea market valued at $1.1 billion in 2023, with 9.2% CAGR forecast.
13
India's boba tea market hit INR 5,200 crore (USD 630 million) in FY2023.
14
Australia boba tea sales grew 22% to AUD 180 million in 2023.
15
Packaged boba tea revenue in Japan was JPY 45 billion in 2023.
16
Middle East boba tea market expanded to $250 million in 2023 at 15% growth.
17
South Korea boba tea industry revenue reached KRW 1.2 trillion in 2023.
18
Latin America boba tea market size was $180 million in 2023, projected to $350 million by 2029.
19
Canada boba tea sales totaled CAD 250 million in 2023.
20
UK boba tea market generated GBP 120 million in 2023.
21
Vietnam boba tea revenue hit VND 10 trillion (USD 410 million) in 2023.
22
Singapore boba tea market valued at SGD 150 million in 2023.
23
Thailand boba tea sales reached THB 12 billion in 2023.
24
Philippines boba tea industry generated PHP 25 billion in 2023.
25
Malaysia boba tea market size was MYR 1.8 billion in 2023.
26
Indonesia boba tea revenue totaled IDR 15 trillion in 2023.
27
Brazil boba tea market grew to BRL 450 million in 2023.
28
Germany boba tea sales hit EUR 85 million in 2023.
29
France boba tea market valued at EUR 70 million in 2023.
Interpretation
Market Size & Revenue Interpretation
The global boba tea market is scaling quickly from USD 3.46 billion in 2023 to a projected USD 5.89 billion by 2030, with Asia-Pacific leading at a 62% revenue share in 2023, reinforcing that Market Size and Revenue growth is being driven by strong regional demand and segments like ready-to-drink boba which held 45% of global revenue in 2023.
More related reading
04 · Category
Production Statistics25 stats
01
Global tapioca pearl production reached 450,000 metric tons in 2023.
02
Taiwan produces 70% of the world's boba tea pearls annually as of 2023.
03
China manufactured 1.2 million tons of boba tea base ingredients in 2023.
04
Average daily output of a major boba chain factory is 50,000 cups equivalent in 2023.
05
Taro powder production for boba grew 18% to 120,000 tons globally in 2023.
06
85% of boba pearls are made from cassava starch sourced from Thailand in 2023.
07
Vietnam exported 80,000 tons of tea leaves for boba production in 2023.
08
Automated boba production lines increased output by 40% in China factories 2023.
09
Milk tea powder production hit 200,000 tons in Asia-Pacific in 2023.
10
60% of global boba syrup is produced in Guangdong province, China 2023.
11
Organic tea leaf sourcing for boba rose 25% to 15,000 tons in 2023.
12
Boba shop average daily production of fresh pearls is 200kg per outlet 2023.
13
Japan imports 95% of its boba ingredients from Taiwan yearly 2023.
14
Sustainable cassava farming for pearls expanded to 500,000 hectares in 2023.
15
Fruit puree production for boba flavors reached 90,000 tons in 2023.
16
Powdered creamer for boba produced 150,000 tons in Southeast Asia 2023.
17
75% of boba popping boba is manufactured using sodium alginate tech 2023.
18
Tea extract concentration for boba standardized at 12-15% solids in 2023.
19
Annual production of matcha powder for boba hit 30,000 tons Japan 2023.
20
Waste from boba pearl production recycled at 65% rate globally 2023.
21
Coconut milk production for vegan boba grew to 40,000 tons 2023.
22
Crystal boba (agar) production increased 22% to 25,000 tons 2023.
23
Supply chain lead time for boba ingredients averages 14 days Asia 2023.
24
92% of boba pearls shelf life extended to 12 months via vacuum packing 2023.
25
Herbal tea blends for boba produced 50,000 tons in India 2023.
Interpretation
Production Statistics Interpretation
In production terms, the industry scaled sharply in 2023 with 450,000 metric tons of tapioca pearls worldwide and Taiwan supplying 70% of the pearls, while supply chains remain heavily concentrated with 85% of boba pearls made from Thailand-sourced cassava starch.
05 · Category
Trends & Innovations30 stats
01
Global boba tea market CAGR projected at 8.5% through 2032.
02
Plant-based boba options expected to grow 15% annually to 2030.
03
AI-driven customization kiosks in 20% of new boba shops by 2025.
04
Low/no sugar boba variants to capture 30% market share by 2028.
05
Ready-to-drink canned boba sales forecast to triple by 2027.
06
Sustainable packaging adoption in boba industry at 40% by 2026.
07
NFT loyalty programs launched by 15 major boba chains in 2024.
08
Collagen-infused boba drinks trending with 25% growth in 2024.
09
AR menu experiences in boba apps used by 35% consumers by 2025.
10
Boba tea vending machines to reach 50,000 units globally by 2030.
11
Probiotic boba formulations entering market with 12% CAGR to 2029.
12
Ghost kitchens for boba delivery projected 60% of sales by 2027.
13
Hemp/CBD boba variants legalized in 10 countries by 2025.
14
3D-printed custom pearls innovation piloted in Taiwan 2024.
15
Metaverse boba shop experiences by top chains in 2024.
16
Zero-calorie sweeteners dominate 45% of new boba recipes 2024.
17
Subscription boba boxes grow 28% yearly to 2030.
18
Robot baristas in boba shops reach 10% adoption by 2026.
19
Exotic fruit fusions like yuzu boba up 32% in sales 2024.
20
Eco-friendly pearl alternatives from algae projected 20% market 2028.
21
Voice ordering via Alexa/Google for boba hits 25% usage 2025.
22
Functional boba with adaptogens forecast $500M segment by 2030.
23
Pop-up boba collaborations with brands up 50% in 2024.
24
Blockchain traceability for boba supply chain in 30% chains 2026.
25
Glow-in-dark boba novelties viral with 15% trial rate 2024.
26
Elderly-targeted boba with health benefits launching 2025.
27
Drone delivery for boba piloted in 5 cities by 2026.
28
Holographic menu displays in premium boba shops 2025.
29
Personalized nutrition boba via DNA kits by 2028.
30
Virtual reality boba mixing games for loyalty 2024.
Interpretation
Trends & Innovations Interpretation
Innovation in the boba industry is accelerating fast as the global market is projected to grow at an 8.5% CAGR through 2032 alongside rapid adoption of sustainable packaging reaching 40% by 2026 and AI-driven kiosks landing in 20% of new shops by 2025.
report visual · Comparison
Boba adoption signals: what drives monthly and weekly drinking
Consumption is strongly supported by social and flavor preferences, with a majority of key audiences buying weekly or monthly and choosing flavors, toppings, and experiences that keep them coming back.
Toppings like pearls are chosen by 89% of boba tea orders globally 2023.89%
72% of Gen Z in Asia buy boba tea weekly, per 2023 survey.
72%
55% of consumers choose boba tea for Instagram-worthy photos in 2023.
55%
38% of US millennials consume boba tea at least once a month in 2023.
38%
Reference
Cite This Report
This report is designed to be cited. We maintain stable URLs and versioned verification dates. Copy the format appropriate for your publication below.
APA
Henrik Dahl. (2026, February 13). Boba Tea Industry Statistics. Gitnux. https://gitnux.org/boba-tea-industry-statistics
MLA
Henrik Dahl. "Boba Tea Industry Statistics." Gitnux, 13 Feb 2026, https://gitnux.org/boba-tea-industry-statistics.
Chicago
Henrik Dahl. 2026. "Boba Tea Industry Statistics." Gitnux. https://gitnux.org/boba-tea-industry-statistics.
Sources & references
100 datasets cited across this report · attribution is report-level