GITNUXSOFTWARE ADVICE
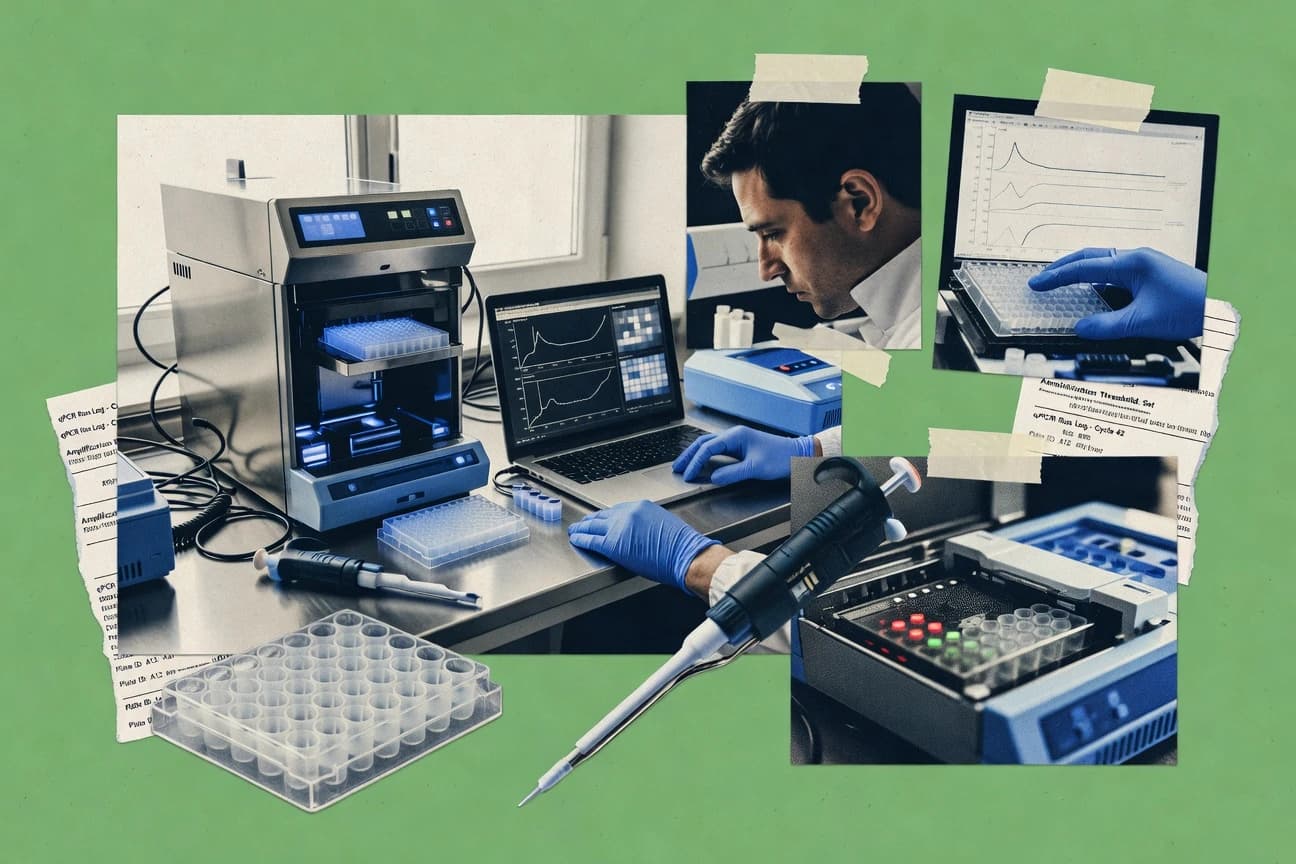
Data Science AnalyticsTop 8 Best Qpcr Analysis Software of 2026
Compare top Qpcr analysis software. Find the best tools to simplify your analysis – get insights now.

How we ranked these tools
Core product claims cross-referenced against official documentation, changelogs, and independent technical reviews.
Analyzed video reviews and hundreds of written evaluations to capture real-world user experiences with each tool.
AI persona simulations modeled how different user types would experience each tool across common use cases and workflows.
Final rankings reviewed and approved by our editorial team with authority to override AI-generated scores based on domain expertise.
Score: Features 40% · Ease 30% · Value 30%
Gitnux may earn a commission through links on this page — this does not influence rankings. Editorial policy
Editor’s top 3 picks
Three quick recommendations before you dive into the full comparison below — each one leads on a different dimension.
LightCycler Software
Instrument-linked qPCR analysis with rapid amplification and Ct review
Built for labs running LightCycler qPCR that need consistent analysis and reporting.
RDML Tools
Editor pickNative RDML parsing that carries assay and run metadata through quantification steps
Built for teams using RDML to standardize qPCR normalization and quantification workflows.
Bioconductor qpcR
Editor pickComprehensive qPCR curve handling with flexible threshold and baseline correction utilities
Built for researchers running scripted RT-qPCR analysis with R and consistent plate formats.
Related reading
Comparison Table
This comparison table benchmarks Qpcr analysis software used for importing raw instrument output, normalizing Ct values, fitting quantification models, and generating report-ready results. It contrasts tools such as LightCycler Software, RDML Tools, Bioconductor qpcR, and R package dplyr-based qPCR workflows against qBase R to highlight differences in supported data formats, analysis features, and reproducibility. Readers can use the table to select software that matches their experimental design and downstream reporting needs.
LightCycler Software
instrument-suiteRoche LightCycler qPCR software supports Ct curve handling, quantification workflows, and automated report generation for kinetic amplification data.
Instrument-linked qPCR analysis with rapid amplification and Ct review
LightCycler Software stands out by pairing instrument-driven workflows with built-in qPCR analysis for LightCycler devices. It supports standard curve style quantification methods and established analysis views for amplification data and Ct determination. Results export and plate-oriented organization make it practical for routine assay runs and audit-friendly documentation.
- +Integrated LightCycler acquisition to analysis flow reduces manual handling
- +Strong support for Ct calling and amplification plot inspection
- +Plate organization supports high-throughput routine qPCR review
- +Exportable results support downstream reporting and recordkeeping
- –Workflow depth is strongest for LightCycler ecosystems only
- –Advanced custom analysis requires more work than flexible spreadsheet pipelines
- –Less suited for labs needing one tool across mixed instrument brands
Best for: Labs running LightCycler qPCR that need consistent analysis and reporting
More related reading
RDML Tools
file-parserRDML Tools import and process MIQE-style RDML qPCR experiment files to enable consistent parsing and downstream analysis of qPCR results.
Native RDML parsing that carries assay and run metadata through quantification steps
RDML Tools centers on RDML-based qPCR workflows that translate instrument outputs into structured, reviewable analysis inputs. It supports normalization and quantification workflows using MIQE-aligned metadata captured in RDML documents.
The tool emphasizes repeatable parsing, calculation, and export across runs, which helps teams standardize results. It is best suited to labs that already organize qPCR data in RDML rather than using vendor-specific formats directly.
- +RDML-first workflow preserves metadata needed for transparent qPCR analysis
- +Automates parsing, normalization, and quantification from structured RDML inputs
- +Supports repeatable exports that help standardize reporting across runs
- –RDML-centric approach adds friction for labs with non-RDML data pipelines
- –Workflow setup can feel technical compared with wizard-driven qPCR tools
- –Interface and reporting options require more configuration than GUI-only tools
Best for: Teams using RDML to standardize qPCR normalization and quantification workflows
Bioconductor qpcR
open-source-RqpcR in R computes quantification cycles, fits calibration and efficiencies, and produces model-based relative expression estimates for qPCR data.
Comprehensive qPCR curve handling with flexible threshold and baseline correction utilities
Bioconductor qpcR stands out for extending reproducible RT-qPCR workflows inside the R ecosystem with MIQE-oriented analysis steps. It supports automated plate-based quantification, baseline and threshold handling, and multiple normalization strategies for relative expression. The package integrates visualization and model-based summaries for both efficiency-aware and standard comparative methods.
- +R-based workflows with analysis reproducibility and scriptable plate processing
- +MIQE-aligned options for thresholding, baseline, and amplification curve QC
- +Normalization support including reference genes for relative quantification
- –R-centric setup requires coding familiarity for smooth adoption
- –Plate import and data formatting are a common friction point
- –Fewer point-and-click workflows than GUI-first qPCR tools
Best for: Researchers running scripted RT-qPCR analysis with R and consistent plate formats
R package dplyr-based qPCR workflows
scripted-RCRAN-hosted R packages enable scripted qPCR normalization, efficiency correction, and statistical testing using reproducible data pipelines.
Tidy, group-aware dplyr transformations for Ct summarization and normalization
dplyr-based qPCR workflows stand out because they express qPCR normalization and summarization using readable dplyr verbs on tidy data. Core capabilities include reshaping Ct tables into analysis-ready long formats, grouping by target and sample metadata, and computing normalized expression values. The workflow style supports reproducible pipelines for baseline correction and selection of control genes and reference conditions through declarative data transformations.
- +dplyr pipelines make Ct normalization steps traceable and reproducible
- +Group-wise operations handle many genes and samples consistently
- +Tidy reshaping works well with downstream statistical modeling
- –Assumes R familiarity and tidy data conventions for Ct inputs
- –Workflow logic can be harder to validate than wizard-based tools
- –Automation depends on the quality of provided metadata mappings
Best for: Biology teams automating qPCR normalization in R using tidy datasets
qBase R
open-source-RqBase R implements qBase-style relative quantification in R to calculate normalized expression with selectable reference genes and efficiencies.
Reference gene normalization using stability ranking and selection workflows in qBase R
qBase R stands out as an R-based tool for relative and absolute qPCR quantification built around a reproducible analysis workflow. It supports plate layout handling, multiple normalization strategies, and gene expression calculations using user-defined or recommended statistical models.
The software emphasizes MIQE-aligned preprocessing and flexible experimental metadata, so analyses can be rerun when inputs change. Output tables and visual summaries make it practical to compare reference genes and quantify fold changes across conditions.
- +Scriptable qPCR quantification in R with reproducible inputs and outputs
- +Strong support for multiple reference gene normalization and stability approaches
- +Handles plate and sample mapping for robust preprocessing and reruns
- +Produces calculation outputs for relative and absolute quantification
- –R-based workflow has a steeper learning curve than GUI-only tools
- –Setup of models and input formats can be time-consuming for small studies
- –Less intuitive exploratory plate QC for users expecting point-and-click workflows
Best for: Teams needing reproducible qPCR quantification workflows with R-based automation
FluoroFinder
mobile-analysisFluoroFinder is a mobile workflow for analyzing qPCR amplification data with Ct extraction and quantification steps suited to small experiments.
Guided qPCR plate workflow with visual Ct and amplification result interpretation
FluoroFinder focuses on converting qPCR plate data into interpretable results with a guided workflow. It supports common qPCR analysis steps such as Ct handling, threshold and baseline related processing, and exporting outputs for downstream review.
The tool is designed for visual inspection and repeatable analysis rather than scripting-first automation. Overall, it targets practical result generation for fluorescence-based assays where consistent plate interpretation matters.
- +Guided plate workflow reduces missed analysis steps
- +Visual result inspection supports rapid troubleshooting
- +Export-ready outputs make sharing analysis straightforward
- +Designed for fluorescence qPCR datasets and interpretation
- –Limited evidence of advanced statistical modeling for complex designs
- –Fewer automation and batch features for high-throughput workflows
- –Custom analysis control depth appears smaller than research-grade tools
Best for: Lab teams needing guided qPCR result processing and exports
RDML Navigator
RDML-UXRDML Navigator helps users visualize and validate RDML qPCR experiment structure before running quantification analyses.
RDML Navigator’s RDML-driven import and analysis workflow keeps plate and experiment metadata bound to results
RDML Navigator stands out by centering the RDML document format and the curated workflows used for qPCR plate analysis and results exchange. It supports importing RDML data, mapping experiments to standard analysis steps, and generating interpretable outputs for Ct-based and efficiency-aware workflows.
The tool also emphasizes collaboration-friendly reproducibility by keeping analysis context attached to the underlying RDML structure. Core capabilities focus on organizing runs, validating expected layout metadata, and producing analysis artifacts aligned to common qPCR reporting needs.
- +RDML-native workflow preserves analysis context with experimental data
- +Supports structured import and plate metadata handling for repeatable runs
- +Produces analysis outputs designed for downstream sharing and reporting
- +Validation steps help catch mismatched layouts early in processing
- –RDML-centric usage raises setup friction versus general qPCR tools
- –UI workflow can feel heavier for simple single-plate analyses
- –Limited accommodation for ad hoc nonstandard inputs without correct RDML
Best for: Teams exchanging RDML-linked qPCR results and requiring reproducible workflows
MIQE compliant spreadsheet workflows
template-basedPublic spreadsheet and notebook templates on GitHub implement MIQE-aligned qPCR analysis steps such as baseline correction, ΔCt computation, and QC flags.
MIQE compliance through standardized spreadsheet workflows and metadata-first organization
MIQE compliant spreadsheet workflows in GitHub deliver MIQE-aligned qPCR organization using structured spreadsheets and consistent templates. The workflows focus on traceable sample metadata, clear plate layouts, and analysis steps that map to MIQE expectations.
Output is designed to be reproducible through version-controlled spreadsheet files and documented workflow steps that align wet-lab reporting with computational processing. This approach supports spreadsheet-based transparency for Ct handling, normalization, and result reporting without locking users into a single proprietary interface.
- +MIQE-ready spreadsheet templates enforce consistent reporting fields
- +GitHub version control improves auditability of analysis spreadsheets
- +Works directly with standard qPCR plate and Ct workflows
- –Spreadsheet setup and validation require careful user configuration
- –Automation depth depends on spreadsheet formulas rather than robust code
- –Error detection for mismatched metadata and plate layouts can be limited
Best for: Teams needing MIQE-aligned, version-controlled qPCR analysis in spreadsheets
Conclusion
After evaluating 8 data science analytics, LightCycler Software stands out as our overall top pick — it scored highest across our combined criteria of features, ease of use, and value, which is why it sits at #1 in the rankings above.
Use the comparison table and detailed reviews above to validate the fit against your own requirements before committing to a tool.
How to Choose the Right Qpcr Analysis Software
This buyer’s guide covers how to select Qpcr analysis software across LightCycler Software, RDML Tools, Bioconductor qpcR, and spreadsheet and R workflow options. It explains what to look for in Ct calling, baseline and threshold handling, normalization, and reproducible reporting. It also maps tool choices to common lab setups including single-instrument workflows, RDML exchanges, and scripted R pipelines.
What Is Qpcr Analysis Software?
Qpcr analysis software processes real-time PCR fluorescence data into Ct determinations, amplification curve views, and quantification results. It solves problems like consistent baseline and threshold selection, normalization using reference genes, and repeatable export for plate records and downstream reporting. LightCycler Software shows the instrument-linked workflow model by combining LightCycler amplification and Ct review in one flow. RDML Tools shows the standardized data exchange model by parsing RDML files into structured inputs for normalization and quantification.
Key Features to Look For
The best Qpcr analysis tools reduce analyst variability by enforcing consistent parsing, QC steps, and normalization logic.
Instrument-linked Ct review and kinetic amplification workflows
LightCycler Software is built for LightCycler devices and pairs instrument-driven workflows with Ct calling and amplification plot inspection. This matters for routine runs because plate-oriented organization supports consistent review and audit-friendly recordkeeping.
Native RDML parsing that carries metadata into quantification
RDML Tools and RDML Navigator both center RDML handling so assay and run metadata remain bound to the analysis context. This matters because normalization and quantification become repeatable when the same RDML structure is parsed the same way each time.
Flexible baseline and threshold handling for curve analysis
Bioconductor qpcR provides comprehensive qPCR curve handling with flexible threshold and baseline correction utilities. This matters when Ct calls depend on analysis settings, especially for efficiency-aware and comparative expression workflows.
Reproducible, scriptable quantification in R
Bioconductor qpcR, qBase R, and dplyr-based qPCR workflows support reproducible plate-based processing through R scripting. This matters for teams automating many plates because scriptable transformations make normalization and summarization traceable.
Reference gene normalization with stability ranking workflows
qBase R emphasizes reference gene normalization using stability ranking and selection workflows. This matters when choosing reference genes across conditions because the tool supports reruns when experimental inputs change.
Guided plate workflows with export-ready visual inspection
FluoroFinder focuses on guided analysis with visual inspection of Ct and amplification interpretation, plus export-ready outputs. This matters for small experiments where consistent plate interpretation and fast troubleshooting matter more than deep custom modeling.
How to Choose the Right Qpcr Analysis Software
Selection works best by matching the tool’s input format and workflow depth to the lab’s instrument setup and reproducibility needs.
Match the tool to the data source you already have
LightCycler Software fits labs running LightCycler qPCR because it links acquisition and analysis for rapid amplification and Ct review. RDML Tools and RDML Navigator fit teams that already exchange or store experiment results in RDML, since both tools parse RDML and keep run context attached to analysis outputs.
Decide how much curve-calling control the workflow must support
Bioconductor qpcR targets flexible threshold and baseline handling with comprehensive curve utilities, which suits teams that need to tune analysis assumptions. If the primary need is guided interpretation instead of deep customization, FluoroFinder provides a guided plate workflow with visual Ct and amplification result inspection.
Pick normalization and reference gene workflows that align with study design
qBase R is designed around reference gene normalization with stability ranking and selection workflows, which fits experiments comparing multiple conditions. dplyr-based qPCR workflows and R package workflows fit biology teams that want normalization expressed through tidy, group-aware transformations on Ct tables.
Plan for reproducibility and audit readiness from day one
LightCycler Software supports exportable results with plate-oriented organization that supports audit-friendly documentation for routine runs. MIQE compliant spreadsheet workflows add version-controlled, MIQE-aligned templates on GitHub to keep Ct handling, ΔCt computation, and QC flags traceable through spreadsheet formulas and document steps.
Avoid tool mismatches that create workflow friction
RDML Tools and RDML Navigator add friction when the lab data pipeline is not RDML-centric, so spreadsheet and CSV-based workflows typically integrate less smoothly with RDML-first tools. qpcR, qBase R, and dplyr-based qPCR workflows require R familiarity, so these options are a poor fit when the workflow must be point-and-click without scripting.
Who Needs Qpcr Analysis Software?
Qpcr analysis software benefits teams that must turn amplification measurements into consistent Ct calls, normalized expression results, and shareable records.
LightCycler-focused labs that run routine assays on the same instrument
LightCycler Software is the best match for labs needing consistent analysis and reporting because it provides instrument-linked qPCR analysis with rapid amplification and Ct review plus plate organization. This setup reduces manual handling while keeping exportable results tied to plate structure.
Teams standardizing qPCR exchange and reporting through RDML
RDML Tools excels when RDML is already used because it provides native RDML parsing that carries assay and run metadata through quantification steps. RDML Navigator adds RDML validation and visualization so teams can catch mismatched layouts before quantification artifacts are generated.
Researchers running scripted RT-qPCR analysis in R with consistent plate processing
Bioconductor qpcR fits researchers who want scriptable qPCR curve handling with flexible threshold and baseline correction utilities. qBase R fits teams that want reference gene normalization using stability ranking and selection workflows within a reproducible R quantification workflow.
Lab teams needing guided interpretation and export for smaller experiments
FluoroFinder is aimed at guided plate workflows that support visual Ct and amplification interpretation plus export-ready outputs. MIQE compliant spreadsheet workflows suit teams that want MIQE-aligned, version-controlled analysis spreadsheets when the workflow must be transparent and trackable through GitHub-managed files.
Common Mistakes to Avoid
Common failures come from choosing a workflow that mismatches the lab’s input format and the level of analysis control needed for reliable quantification.
Using RDML-first tools on non-RDML pipelines
RDML Tools and RDML Navigator assume RDML-centric inputs and add friction when the lab relies on vendor formats or ad hoc exports. The workaround is to select MIQE compliant spreadsheet workflows or dplyr-based qPCR workflows when inputs are Ct tables rather than RDML documents.
Expecting point-and-click flexibility from R-centric quantification
Bioconductor qpcR, qBase R, and dplyr-based qPCR workflows require R familiarity and plate formatting discipline, which can slow down teams that expect wizard-driven analysis. FluoroFinder addresses this by providing guided plate workflow and visual inspection for Ct interpretation.
Skipping reference gene selection discipline
Normalization that treats reference genes as fixed without stability logic risks inconsistent results across conditions. qBase R includes reference gene normalization using stability ranking and selection workflows, which supports repeatable reference gene decisions.
Building non-auditable normalization steps
Untracked spreadsheet formula changes and inconsistent metadata mapping reduce audit clarity and complicate reruns. MIQE compliant spreadsheet workflows add MIQE-ready template structure with version control in GitHub, while LightCycler Software adds plate-oriented organization and exportable results for routine audit trails.
How We Selected and Ranked These Tools
We evaluated each Qpcr analysis software tool using three sub-dimensions. Features carried weight 0.4 in the overall scoring, ease of use carried weight 0.3, and value carried weight 0.3. The overall rating is the weighted average computed as overall = 0.40 × features + 0.30 × ease of use + 0.30 × value. LightCycler Software separated itself through instrument-linked qPCR analysis that couples amplification and Ct review in a single workflow, which strongly lifted the features sub-dimension for LightCycler labs.
Frequently Asked Questions About Qpcr Analysis Software
Which Qpcr analysis tool is best for LightCycler instrument files?
How do RDML-based tools keep analysis metadata attached to results?
Which R-based options provide scripted RT-qPCR pipelines with reproducible normalization?
What tool handles MIQE-aligned preprocessing most directly in non-proprietary formats?
Which software is most suitable for teams comparing reference genes and fold changes across conditions?
What is the best choice for guided, visual Ct and threshold interpretation instead of scripting-first automation?
How do these tools differ in baseline and threshold handling for amplification curves?
Which option fits teams that need version-controlled analysis artifacts for auditing?
Tools reviewed
Primary sources checked during evaluation.
Referenced in the comparison table and product reviews above.
Keep exploring
Comparing two specific tools?
Software Alternatives
See head-to-head software comparisons with feature breakdowns, pricing, and our recommendation for each use case.
Explore software alternatives→In this category
Data Science Analytics alternatives
See side-by-side comparisons of data science analytics tools and pick the right one for your stack.
Compare data science analytics tools→FOR SOFTWARE VENDORS
Not on this list? Let’s fix that.
Our best-of pages are how many teams discover and compare tools in this space. If you think your product belongs in this lineup, we’d like to hear from you—we’ll walk you through fit and what an editorial entry looks like.
Apply for a ListingWHAT THIS INCLUDES
Where buyers compare
Readers come to these pages to shortlist software—your product shows up in that moment, not in a random sidebar.
Editorial write-up
We describe your product in our own words and check the facts before anything goes live.
On-page brand presence
You appear in the roundup the same way as other tools we cover: name, positioning, and a clear next step for readers who want to learn more.
Kept up to date
We refresh lists on a regular rhythm so the category page stays useful as products and pricing change.