GITNUXSOFTWARE ADVICE
Data Science AnalyticsTop 10 Best Gis Visualization Software of 2026
Compare and rank the top 10 Gis Visualization Software tools for 2026. Explore best picks for mapping, data layers, and sharing.

How we ranked these tools
Core product claims cross-referenced against official documentation, changelogs, and independent technical reviews.
Analyzed video reviews and hundreds of written evaluations to capture real-world user experiences with each tool.
AI persona simulations modeled how different user types would experience each tool across common use cases and workflows.
Final rankings reviewed and approved by our editorial team with authority to override AI-generated scores based on domain expertise.
Score: Features 40% · Ease 30% · Value 30%
Gitnux may earn a commission through links on this page — this does not influence rankings. Editorial policy
Editor’s top 3 picks
Three quick recommendations before you dive into the full comparison below — each one leads on a different dimension.
ArcGIS Online
ArcGIS Dashboards with drill-down interactions across hosted feature layers
Built for teams building interactive web maps, dashboards, and story maps.
QGIS
Layout Manager with map composition, vector styling, and export for print-ready cartography
Built for teams needing desktop GIS visualization, mapping layouts, and analysis without vendor lock-in.
Mapbox
Mapbox GL layer system with custom vector tile rendering and expression-based styling
Built for developer-led teams building interactive web maps with custom data layers.
Related reading
Comparison Table
This comparison table evaluates GIS visualization tools used to publish maps, render geospatial layers, and support interactive exploration. It benchmarks options such as ArcGIS Online, QGIS, Mapbox, Cesium, and Google Earth across visualization capabilities, data integration patterns, deployment models, and typical use cases. Readers can use the results to match tool strengths to workflows that range from desktop mapping to real-time web globe rendering.
| # | Tool | Category | Overall | Features | Ease of Use | Value |
|---|---|---|---|---|---|---|
| 1 | ArcGIS Online Web GIS platform for publishing, sharing, and visualizing interactive maps and apps with hosted data layers and dashboards. | web GIS | 9.4/10 | 9.5/10 | 9.3/10 | 9.4/10 |
| 2 | QGIS Desktop GIS application for creating, styling, and analyzing spatial datasets with a visualization-focused map layout and project workflow. | desktop GIS | 9.1/10 | 9.1/10 | 8.9/10 | 9.4/10 |
| 3 | Mapbox Developer platform for map rendering and interactive GIS visualization using vector tiles, styles, and SDKs for custom web maps. | mapping SDK | 8.8/10 | 8.6/10 | 8.9/10 | 8.9/10 |
| 4 | Cesium 3D geospatial visualization engine for rendering interactive globes and maps from terrain and imagery datasets in web applications. | 3D globe | 8.5/10 | 8.5/10 | 8.6/10 | 8.3/10 |
| 5 | Google Earth Consumer and business geospatial visualization tool for exploring satellite imagery, terrain, and saved map layers. | geospatial viewer | 8.2/10 | 8.0/10 | 8.1/10 | 8.4/10 |
| 6 | Google Maps Platform Production mapping APIs for building custom GIS visualizations with interactive maps, geocoding, and related location services. | maps APIs | 7.8/10 | 7.9/10 | 7.9/10 | 7.5/10 |
| 7 | Kepler.gl Open-source geospatial visualization framework for GPU-accelerated interactive maps and spatial analytics in the browser. | open-source visualizer | 7.5/10 | 7.2/10 | 7.7/10 | 7.7/10 |
| 8 | GeoPandas Python library that extends pandas with geospatial data types and supports fast spatial plotting for GIS visual analytics workflows. | Python GIS | 7.1/10 | 6.9/10 | 7.2/10 | 7.4/10 |
| 9 | Plotly Interactive plotting library that renders choropleths, scatter maps, and mapbox-backed GIS visualizations for analytics and dashboards. | interactive charts | 6.8/10 | 6.5/10 | 7.0/10 | 7.0/10 |
| 10 | Grafana Dashboarding platform that supports GIS-style geospatial panels and interactive visualization with spatial data integrations. | observability dashboards | 6.5/10 | 6.9/10 | 6.2/10 | 6.2/10 |
Web GIS platform for publishing, sharing, and visualizing interactive maps and apps with hosted data layers and dashboards.
Desktop GIS application for creating, styling, and analyzing spatial datasets with a visualization-focused map layout and project workflow.
Developer platform for map rendering and interactive GIS visualization using vector tiles, styles, and SDKs for custom web maps.
3D geospatial visualization engine for rendering interactive globes and maps from terrain and imagery datasets in web applications.
Consumer and business geospatial visualization tool for exploring satellite imagery, terrain, and saved map layers.
Production mapping APIs for building custom GIS visualizations with interactive maps, geocoding, and related location services.
Open-source geospatial visualization framework for GPU-accelerated interactive maps and spatial analytics in the browser.
Python library that extends pandas with geospatial data types and supports fast spatial plotting for GIS visual analytics workflows.
Interactive plotting library that renders choropleths, scatter maps, and mapbox-backed GIS visualizations for analytics and dashboards.
Dashboarding platform that supports GIS-style geospatial panels and interactive visualization with spatial data integrations.
ArcGIS Online
web GISWeb GIS platform for publishing, sharing, and visualizing interactive maps and apps with hosted data layers and dashboards.
ArcGIS Dashboards with drill-down interactions across hosted feature layers
ArcGIS Online stands out with a mature map-centric workflow that combines data publishing, cartography, and interactive visualization in one place. It enables interactive web maps and web scenes with layers from ArcGIS services, hosted feature data, and custom sources through supported add-ons. The platform supports dashboards and configurable storytelling apps for communicating spatial insights beyond simple map viewing. Built-in sharing, roles, and organizational controls support repeatable visualization for teams and public audiences.
Pros
- Strong web map and web scene creation with configurable symbology
- Hosted feature layers streamline publishing and updating geospatial data
- Dashboards and story maps translate maps into interactive presentations
- Living Atlas basemaps and ready-to-use thematic layers speed setup
- Share controls support organization access and public publishing
Cons
- Advanced customization often requires deeper ArcGIS configuration knowledge
- Complex 3D scene performance depends heavily on layer design
- Offline workflows are limited for fully standalone map usage
- Vendor-specific data formats can increase migration effort later
Best For
Teams building interactive web maps, dashboards, and story maps
More related reading
QGIS
desktop GISDesktop GIS application for creating, styling, and analyzing spatial datasets with a visualization-focused map layout and project workflow.
Layout Manager with map composition, vector styling, and export for print-ready cartography
QGIS stands out as an open-source GIS desktop application with broad format support and a modular plugin ecosystem. It enables cartographic visualization through a full styling engine with labeled layers, symbology controls, and map composition tools. The software supports common geospatial workflows such as geoprocessing via integrated tools and spatial data editing with configurable forms. It also performs practical map publishing through print layouts and exportable outputs for reports and presentations.
Pros
- Strong cartography tools with advanced symbology, labels, and styling controls
- Broad raster and vector format support with reliable layer loading workflows
- Map layout composer supports print-ready compositions and export outputs
- Extensible via a large plugin ecosystem for specialized GIS functions
- Geoprocessing tools support many standard spatial analysis workflows
Cons
- Desktop UI can feel complex for users new to GIS concepts
- Performance can degrade with very large datasets without tuning
- Some workflows require plugins and extra configuration to finish end-to-end
- Advanced automation often needs Python scripting knowledge
Best For
Teams needing desktop GIS visualization, mapping layouts, and analysis without vendor lock-in
Mapbox
mapping SDKDeveloper platform for map rendering and interactive GIS visualization using vector tiles, styles, and SDKs for custom web maps.
Mapbox GL layer system with custom vector tile rendering and expression-based styling
Mapbox stands out with custom map styling and high-performance vector map rendering for web and mobile GIS visualization. It supports interactive basemaps, geocoding, and routing, which enables end-to-end map experiences beyond static layers. Developers can build custom layers with Mapbox GL, integrate data via tiles and vector sources, and visualize large datasets with fine-grained control. The platform also provides navigation components for applications that need turn-by-turn guidance.
Pros
- Vector basemap rendering with smooth zoom and pan
- Flexible map styling using expressions and layer controls
- Interactive layers support tooltips, hover states, and dynamic filtering
- Built-in geocoding and routing to power location workflows
- Strong support for custom basemap and vector tile sources
Cons
- GIS visualization requires developer implementation for advanced interactions
- Complex styling and layer management can be time-consuming
- Non-developer workflows depend heavily on custom front-end tooling
- Large-scale data requires careful tiling and performance tuning
Best For
Developer-led teams building interactive web maps with custom data layers
Cesium
3D globe3D geospatial visualization engine for rendering interactive globes and maps from terrain and imagery datasets in web applications.
3D Tiles streaming for massive scenes with view-dependent level of detail
Cesium stands out for rendering Earth-scale 3D with high-performance streaming and smooth camera controls across browser and desktop. It supports geospatial visualization with globe, terrain, 3D tiles, and layered imagery and vector data. Developers can add custom shaders and interaction logic to build tailored GIS visual experiences. The platform also integrates with common geospatial formats and workflows for mapping and data exploration.
Pros
- Real-time 3D globe rendering with streamed datasets and smooth navigation
- Native 3D Tiles support for efficient large-scale scene delivery
- Custom layers for imagery, terrain, and vector visualization workflows
- Shader and WebGL extensibility for bespoke visual effects and interactions
Cons
- Advanced customization requires strong JavaScript and graphics knowledge
- GIS analysis and editing tools are not the primary focus versus visualization
- Large datasets can demand careful asset pipeline and performance tuning
- Production deployments require engineering for robust data ingestion and styling
Best For
Teams building interactive 3D geospatial viewers with custom visualization logic
Google Earth
geospatial viewerConsumer and business geospatial visualization tool for exploring satellite imagery, terrain, and saved map layers.
3D globe with KML and KMZ place publishing and collaborative sharing
Google Earth delivers high-resolution 3D globes with instant location context across the planet. It supports browser-based viewing plus desktop-style tools for exploring terrain, imagery layers, and map data in a single interface. Users can import KML and KMZ to visualize points, lines, and polygons, then share scenes or places with others. Time-aware datasets are supported through Earth Engine integration for certain visualization workflows.
Pros
- Browser-based 3D globe speeds stakeholder review without special GIS setup
- KML and KMZ import supports common vector data exchange
- Search and layer controls make it easy to verify real-world locations
- Street View and historical imagery improve visual QA and orientation
Cons
- Limited advanced GIS analysis compared with dedicated desktop GIS software
- Precision editing and topology validation are not designed for production editing
- Large datasets can become sluggish during visualization and styling
- Workflow for complex geoprocessing requires external tools
Best For
Project teams needing fast 3D map visualization and lightweight geodata sharing
Google Maps Platform
maps APIsProduction mapping APIs for building custom GIS visualizations with interactive maps, geocoding, and related location services.
Places API provides structured location intelligence for POIs and address based map experiences
Google Maps Platform delivers high quality basemap rendering with geospatial APIs for embedding interactive maps into GIS workflows. Core capabilities include Maps JavaScript API, Static Maps, Routes and Distance Matrix APIs, and Places data that enriches location context. The platform also supports geocoding, reverse geocoding, and map styling controls through cloud hosted map services. Integrations with Google Cloud help teams combine maps with storage, analytics, and event driven systems for operational dashboards.
Pros
- High fidelity basemaps for consistent visualization across web and mobile apps
- Geocoding and reverse geocoding streamline address to coordinate workflows
- Routes and Distance Matrix power travel time and routing visualizations
- Places data enriches maps with POIs for context driven GIS views
- Map styling supports brand aligned themes and simplified symbology
Cons
- Geometry editing and analysis tools are limited compared to full GIS suites
- Advanced cartographic workflows require more custom front end development
- Large custom vector data visualization depends on app side rendering
Best For
Web GIS dashboards needing interactive maps, routing, and location enrichment
Kepler.gl
open-source visualizerOpen-source geospatial visualization framework for GPU-accelerated interactive maps and spatial analytics in the browser.
Brushing and selection that cross-filters linked layers for coordinated spatial analysis
Kepler.gl stands out for delivering interactive geospatial exploration inside the browser without building a custom GIS front end. It loads spatial datasets and renders them through multiple map layers with configurable styling, tooltips, and legends. The tool supports rich visual encodings like heatmaps and hexbin layers, plus dynamic interactions such as brushing and selection across layers. Kepler.gl also integrates with standard geospatial workflows by exporting configuration and working with common data formats for analysis and sharing.
Pros
- Browser-based interactive map rendering with layer controls and visual styling
- Heatmap and hexbin layers support fast density exploration
- Cross-filter interactions update highlights across linked visual layers
- Configuration exports enable repeatable visualization setups
Cons
- Large datasets can hit performance limits in the browser
- Advanced cartography options feel narrower than full desktop GIS
- Workflow for complex preprocessing often requires external tooling
- Project setup and layer configuration can be intricate for newcomers
Best For
Teams visualizing large tabular locations with interactive layer exploration
GeoPandas
Python GISPython library that extends pandas with geospatial data types and supports fast spatial plotting for GIS visual analytics workflows.
GeoDataFrame plotting via Matplotlib with CRS-aware geometry rendering
GeoPandas is distinct because it builds GIS-ready geospatial workflows on top of the Python data stack. It offers map-ready vector visualization from GeoDataFrame objects, with support for common geospatial operations like coordinate reference system handling. Plotting integrates with Matplotlib so styling, annotations, and figure export use the standard Python visualization ecosystem. It also supports efficient reading and processing of vector data sources used in geospatial analysis, then visualizing results directly in the same workflow.
Pros
- Native GeoDataFrame model simplifies geospatial data handling and plotting
- CRS-aware operations reduce projection mistakes during visualization
- Matplotlib integration enables precise styling and figure export
- Works well inside notebooks for iterative map exploration
- Vector data plotting supports layering and thematic styling
Cons
- No dedicated drag-and-drop GIS interface for non-coders
- Large raster visualization is not its primary strength
- Interactive web map publishing requires external tooling
- Topology editing tools are limited compared with full GIS apps
- Rendering performance can lag with extremely large geometries
Best For
Analysts needing Python-based geospatial visualization within data science workflows
Plotly
interactive chartsInteractive plotting library that renders choropleths, scatter maps, and mapbox-backed GIS visualizations for analytics and dashboards.
Scattergeo and choropleth map rendering with responsive hover and pan zoom interactions
Plotly stands out for producing highly interactive charts with WebGL-based rendering options that also support geospatial plots. It covers GIS-style visualization through scattergeo and choropleth maps with layout controls for projections, color scales, and hover tooltips. Data can be explored interactively via pan, zoom, and legend filtering while exporting figures for sharing and embedding in dashboards. The tool supports programmatic workflows for generating map visuals from dataframes across Python and JavaScript.
Pros
- Interactive scattergeo maps with zoom, pan, and hover tooltips for spatial exploration
- Choropleth support with custom color scales and clear legends for categorical geography
- WebGL rendering enables smooth interaction with large point datasets
Cons
- Map layers for GIS workflows like routing and topology analysis are not provided
- No native geodatabase, indexing, or spatial query engine for raw geospatial datasets
- Complex multi-layer geospatial styling can require custom code and careful figure assembly
Best For
Teams visualizing geo data interactively in dashboards and reports with code-driven control
Grafana
observability dashboardsDashboarding platform that supports GIS-style geospatial panels and interactive visualization with spatial data integrations.
Dashboard filtering and cross-panel drilldowns that keep GIS and time-series views synchronized
Grafana stands out for turning time-series dashboards into a unified observability hub with rich, interactive visualization options. It supports mapping through plugins and can render geospatial layers like markers, heatmaps, and choropleths in the same dashboard as metrics and logs. Data connections cover common sources and stream processing use cases, with drilldowns that link map panels to underlying time filters. It also enables dashboard sharing and governance through folder structures and access control, which helps teams operationalize GIS-informed monitoring.
Pros
- Interactive dashboards link map panels to time range and filters
- Extensible plugin ecosystem adds map layers and geospatial visualizations
- Unified views combine geospatial context with metrics and logs
Cons
- Core GIS modeling features are limited without additional plugins
- Geospatial performance can degrade with large point datasets
- Advanced cartographic workflows require external preprocessing
Best For
Teams visualizing location context alongside metrics, logs, and alerting workflows
How to Choose the Right Gis Visualization Software
This buyer’s guide explains how to select GIS visualization software for interactive maps, desktop cartography, and developer-built web experiences using tools like ArcGIS Online, QGIS, Mapbox, and Cesium. The guide also covers visualization-focused options for fast stakeholder review with Google Earth and operational map dashboards with Google Maps Platform and Grafana. Kepler.gl, GeoPandas, and Plotly are included for browser and Python-driven exploratory visualization.
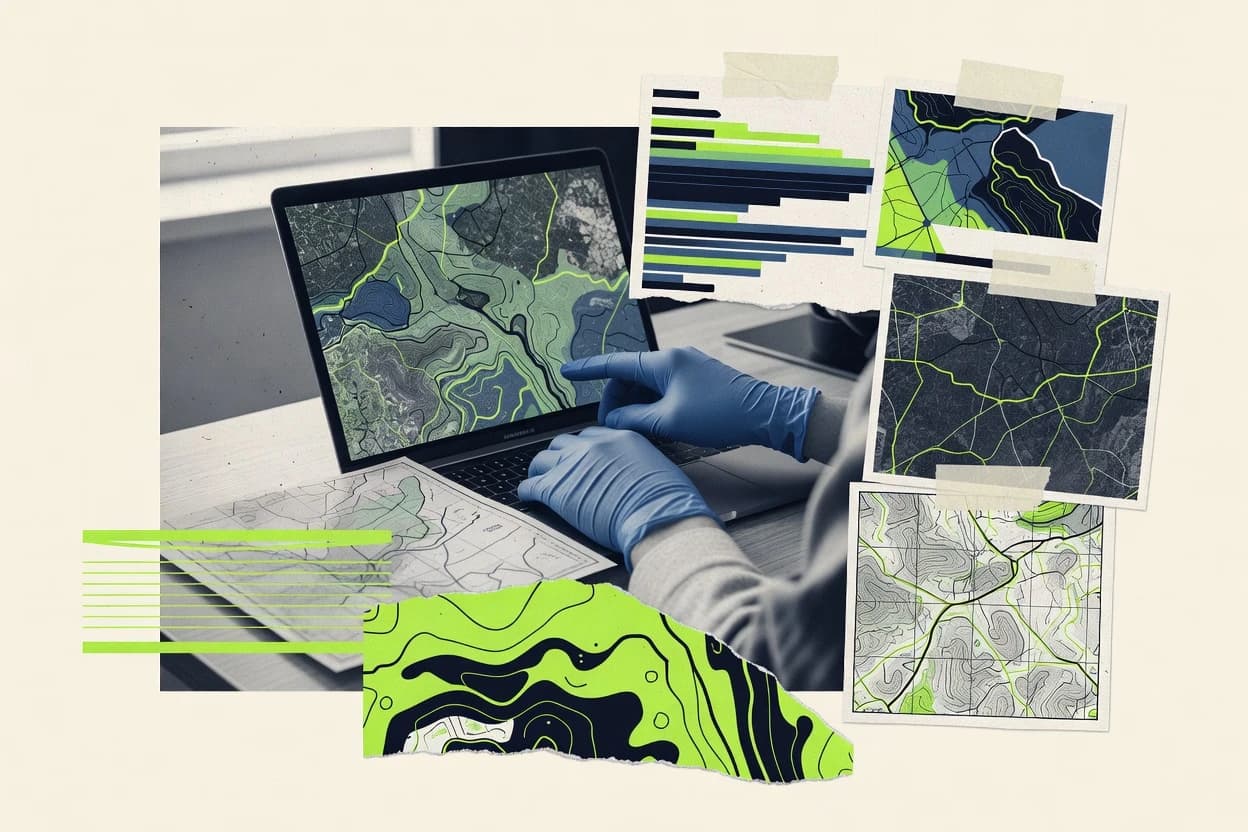
What Is Gis Visualization Software?
GIS visualization software turns geospatial data into interactive maps, 3D scenes, and map-based dashboards that help teams communicate location-based insights. These tools solve common problems like publishing map layers for sharing, styling data for clear cartography, and enabling interactions like filtering, tooltips, and drill-down from map panels. ArcGIS Online represents a web-first workflow for publishing hosted layers into dashboards and story maps, while QGIS represents a desktop workflow focused on map layouts, symbology, and export-ready compositions. Developer platforms like Mapbox and Cesium focus on custom rendering and interaction logic for web and 3D geospatial viewers.
Key Features to Look For
The most reliable GIS visualization outcomes depend on matching visualization depth, interaction behavior, and deployment workflow to the chosen tool.
Interactive web map and scene creation with hosted layers
ArcGIS Online excels at building interactive web maps and web scenes with hosted feature layers that streamline publishing and updating. This capability supports repeatable sharing with organizational controls and enables drill-down map-to-data interactions through ArcGIS Dashboards.
Print-ready cartography via map composition and export
QGIS provides a Layout Manager that supports map composition with vector styling, labels, and export for print-ready cartography. This matters for teams that need consistent report figures and presentation layouts without building a custom web app.
Expression-based vector styling with fast custom rendering
Mapbox delivers smooth vector basemap rendering with a Mapbox GL layer system that supports expression-based styling and dynamic filtering. This matters when interaction like hover states and tooltips must stay responsive for large datasets.
High-performance 3D globe and streamed scene delivery
Cesium provides real-time 3D globe rendering with native 3D Tiles streaming for massive scenes and view-dependent level of detail. This matters for interactive 3D viewers where asset pipeline and styling logic must stay efficient during navigation.
Stakeholder-ready 3D visualization with common geodata exchange
Google Earth supports a 3D globe experience with KML and KMZ import for points, lines, and polygons. This matters when shared place publishing and quick visual QA are needed without production-grade GIS editing or topology workflows.
Coordinated interaction across linked layers and filters
Kepler.gl supports brushing and selection that cross-filters linked visual layers, which enables coordinated spatial analysis across multiple map views. Plotly adds interactive scattergeo and choropleth behavior with pan, zoom, responsive hover tooltips, and legend filtering for exploration.
How to Choose the Right Gis Visualization Software
Selection should start from the required interaction model and the deployment target, then match those needs to the strongest workflow in the top tools.
Choose the deployment workflow: hosted web apps, desktop cartography, or developer-built rendering
For team publishing of interactive maps and apps with dashboards, ArcGIS Online fits a web-first workflow that combines data publishing, cartography, and configurable visualization. For print-ready cartography and layout export, QGIS fits desktop composition with a Layout Manager and advanced symbology controls. For developer-built custom web GIS rendering, Mapbox and Cesium support custom interaction and layer logic using their Mapbox GL and Cesium rendering engines.
Match interaction requirements to the tool’s built-in UI model
ArcGIS Online supports dashboard drill-down interactions across hosted feature layers in ArcGIS Dashboards. Kepler.gl provides brushing and selection that cross-filters linked layers for coordinated spatial exploration. Grafana offers dashboard filtering and cross-panel drilldowns that keep map panels synchronized with time filters, which supports location-aware operational monitoring.
Validate data styling depth and map composition needs
If complex map styling and print-ready compositions are the priority, QGIS excels with advanced symbology, labels, and exportable layouts. If the goal is brand-aligned map presentation with a simple styling workflow inside production apps, Google Maps Platform supports map styling controls alongside geocoding and POI enrichment. If the goal is highly custom vector basemap styling with dynamic filters, Mapbox supports expression-based styling through its GL layer system.
Assess 3D requirements and scene scale handling
Cesium should be selected for interactive 3D geospatial viewers that depend on 3D Tiles streaming for massive scene delivery with view-dependent level of detail. Google Earth should be selected for fast 3D stakeholder visualization using KML and KMZ place publishing and collaborative sharing, especially when advanced editing and topology validation are not required.
Plan for analytics integration level: geospatial visualization vs GIS-like data operations
For browser-based exploratory visualization without building a full GIS front end, Kepler.gl supports heatmap and hexbin layers plus linked brushing and selection across layers. For Python notebook workflows that need CRS-aware geometry handling and map-ready plotting, GeoPandas provides GeoDataFrame plotting via Matplotlib. For code-driven dashboard charts with interactive geo projections, Plotly provides scattergeo and choropleth rendering with hover tooltips and legend filtering.
Who Needs Gis Visualization Software?
Different GIS visualization tools fit distinct operational needs, from interactive web mapping to 3D scene viewing and Python-driven exploratory plotting.
Teams building interactive web maps, dashboards, and story maps
ArcGIS Online fits this audience because it combines interactive web map and web scene creation with dashboards and storytelling apps, plus drill-down interactions across hosted feature layers. The built-in sharing model and role-based organizational controls support repeatable publishing for both teams and public audiences.
Teams needing desktop GIS visualization with print-ready cartography and analysis workflows
QGIS fits this audience because the Layout Manager enables map composition, vector styling, and export for print-ready cartography. QGIS also supports geoprocessing via integrated tools and includes a plugin ecosystem to extend visualization capabilities.
Developer-led teams building interactive web maps with custom layers and rendering
Mapbox fits developer-led teams because it provides a Mapbox GL layer system with expression-based styling, tooltips, and dynamic filtering. Cesium fits teams focused on interactive 3D geospatial viewers because it supports real-time streamed rendering with native 3D Tiles and WebGL extensibility.
Project teams needing fast 3D map visualization and lightweight sharing of geodata
Google Earth fits projects that need quick stakeholder review because it delivers a 3D globe in browser-based viewing plus desktop-style controls for exploring imagery layers and terrain. KML and KMZ import support enables place publishing and collaborative sharing without relying on production GIS editing tools.
Common Mistakes to Avoid
Selection mistakes usually come from mismatching GIS visualization goals to the tool’s intended workflow and rendering model.
Selecting a web visualization tool for production-grade GIS editing and topology validation
Google Earth supports KML and KMZ visualization but it is not designed for precision editing and topology validation for production editing. QGIS and ArcGIS Online are better matches when cartography and editing-like workflows must be handled with GIS tools rather than just viewing and importing.
Assuming desktop cartography workflows will automatically translate into reusable web interactions
QGIS excels at desktop layout and export but it does not provide the same hosted interactive dashboard experience as ArcGIS Online. ArcGIS Online and Grafana are more direct fits when interactive dashboard filtering and drill-down interactions must stay synchronized with map panels.
Underestimating the engineering effort required for advanced interactions in rendering engines
Mapbox and Cesium deliver powerful rendering but advanced GIS visualization interactions require developer implementation. Complex styling and layer management in Mapbox and shader and WebGL extensibility in Cesium demand engineering time compared with configuration-driven dashboards in ArcGIS Online.
Ignoring performance limits when visualizing very large datasets in browser-only tools
Kepler.gl can hit browser performance limits with large datasets and may require external preprocessing for complex workflows. Cesium and ArcGIS Online are more aligned with large-scene delivery patterns because Cesium uses native 3D Tiles streaming and ArcGIS Online supports optimized hosted feature layer visualization.
How We Selected and Ranked These Tools
we evaluated each GIS visualization tool by scoring features with weight 0.4, ease of use with weight 0.3, and value with weight 0.3, then computed overall as 0.40 × features + 0.30 × ease of use + 0.30 × value. ArcGIS Online separated itself from lower-ranked options through concrete dashboard interactivity, because ArcGIS Dashboards support drill-down interactions across hosted feature layers that connect spatial context to detailed data views. Tools like QGIS and Kepler.gl scored strongly in their visualization-specific strengths, but their best-fit workflows concentrate on desktop cartography export or browser exploratory analysis rather than hosted dashboard drill-down as a primary workflow. Developer platforms like Mapbox and Cesium delivered deep rendering control, but they require engineering for advanced interactions, which affects ease of use for non-developer teams.
Frequently Asked Questions About Gis Visualization Software
Which GIS visualization tool is best for building interactive dashboards and story maps without custom frontend work?
ArcGIS Online is the most complete fit because it combines web maps and web scenes with configurable dashboards and storytelling apps. It supports drill-down interactions across hosted feature layers so users can move from overview maps to detail views without building a custom UI.
Which option is the strongest desktop choice for desktop styling, labeled cartography, and print-ready layouts?
QGIS is the top desktop pick because it has a full styling engine with symbology controls, labeled layers, and map composition tools. Its Layout Manager produces exportable outputs for print-ready cartography and report figures.
What tool is best when the goal is developer-controlled basemaps, custom vector layers, and high-performance rendering?
Mapbox is designed for developer-led teams that need custom styling and vector rendering via Mapbox GL. The layer system supports expression-based styling and interactive components like geocoding and routing for end-to-end map experiences.
Which software is best for browser-based Earth-scale 3D visualization with massive datasets?
Cesium is the primary choice because it streams 3D Tiles with view-dependent level of detail across a globe and terrain stack. Developers can add custom shaders and interaction logic while keeping smooth camera controls in the browser or desktop.
Which tool fits teams that need to share and explore geodata quickly using KML and KMZ?
Google Earth is built for fast context because it delivers a high-resolution 3D globe and supports KML and KMZ import. It also enables scene sharing that works well for collaboration and lightweight visualization without building a custom GIS app.
Which platform is better for embedding maps in web apps with routing, places data, and geocoding workflows?
Google Maps Platform fits best when map embedding and location intelligence are required alongside visualization. It provides Maps JavaScript API plus geocoding and Places data that enriches points of interest and address-based experiences.
Which tool supports interactive exploration of large tabular location data without building a full GIS frontend?
Kepler.gl is designed for this workflow because it loads datasets directly into a browser-based, multi-layer map view. It supports heatmaps and hexbin encodings and enables brushing and selection that cross-filters linked layers for coordinated analysis.
Which library is most appropriate for Python-centric geospatial visualization with CRS-aware plotting and exportable figures?
GeoPandas is the best match for Python teams because it plots GeoDataFrame objects with CRS-aware geometry handling. Its plotting integrates with Matplotlib so annotations, styling, and figure export use the standard Python visualization ecosystem.
How do teams handle interactive choropleths and geo scatter plots inside dashboards using code-driven visualization?
Plotly fits teams that need interactive GIS-style plots using code, since it supports scattergeo and choropleth maps with pan, zoom, and hover tooltips. It also allows responsive exploration and export for embedding in reports and dashboards.
Which platform is best for linking time-series monitoring to maps with drill-down and synchronized filters?
Grafana fits teams that want location context next to metrics, logs, and alerting because it supports map panels through plugins. It can render geospatial markers, heatmaps, and choropleths while keeping dashboard filtering and cross-panel drilldowns synchronized with time filters.
Conclusion
After evaluating 10 data science analytics, ArcGIS Online stands out as our overall top pick — it scored highest across our combined criteria of features, ease of use, and value, which is why it sits at #1 in the rankings above.
Use the comparison table and detailed reviews above to validate the fit against your own requirements before committing to a tool.
Tools reviewed
Referenced in the comparison table and product reviews above.
Keep exploring
Comparing two specific tools?
Software Alternatives
See head-to-head software comparisons with feature breakdowns, pricing, and our recommendation for each use case.
Explore software alternatives→In this category
Data Science Analytics alternatives
See side-by-side comparisons of data science analytics tools and pick the right one for your stack.
Compare data science analytics tools→FOR SOFTWARE VENDORS
Not on this list? Let’s fix that.
Our best-of pages are how many teams discover and compare tools in this space. If you think your product belongs in this lineup, we’d like to hear from you—we’ll walk you through fit and what an editorial entry looks like.
Apply for a ListingWHAT THIS INCLUDES
Where buyers compare
Readers come to these pages to shortlist software—your product shows up in that moment, not in a random sidebar.
Editorial write-up
We describe your product in our own words and check the facts before anything goes live.
On-page brand presence
You appear in the roundup the same way as other tools we cover: name, positioning, and a clear next step for readers who want to learn more.
Kept up to date
We refresh lists on a regular rhythm so the category page stays useful as products and pricing change.