GITNUXSOFTWARE ADVICE
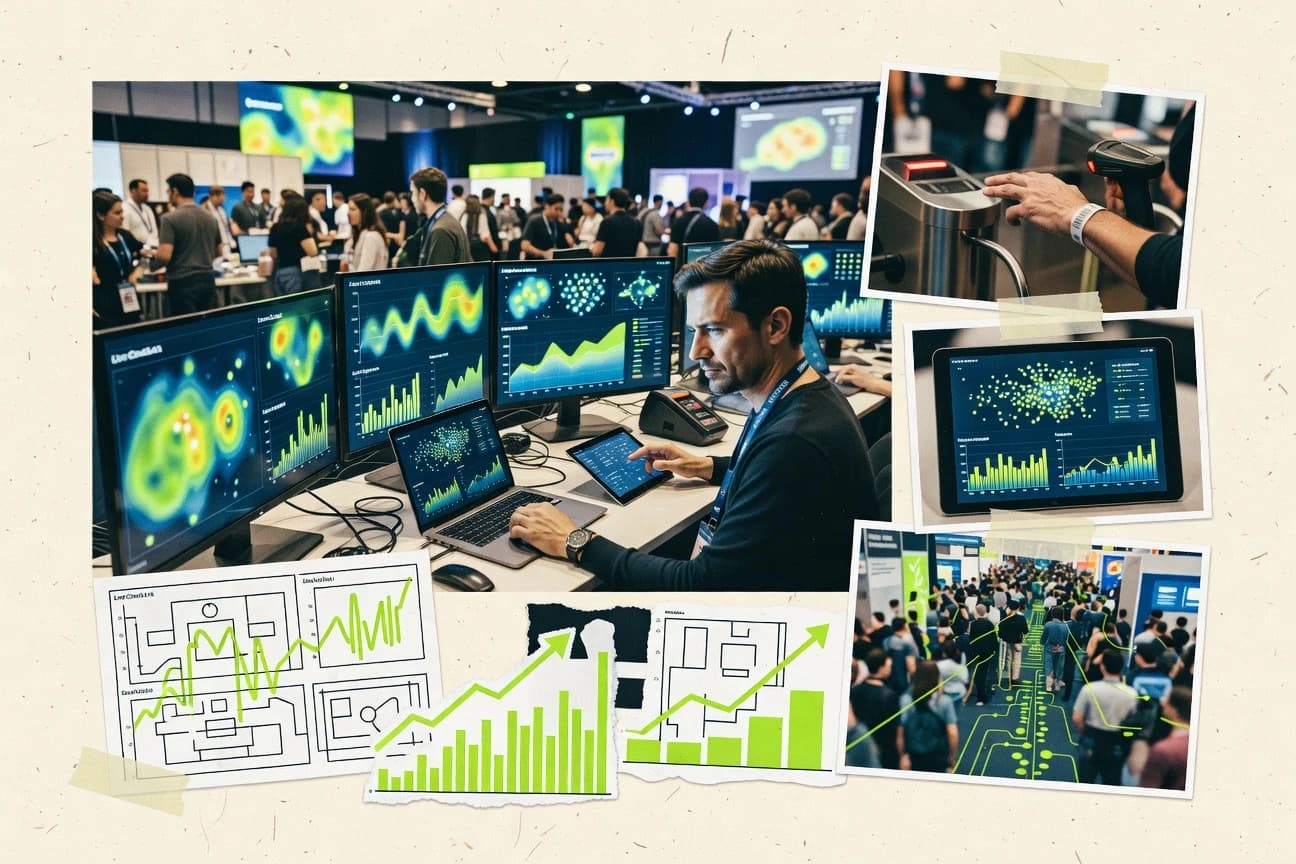
Data Science AnalyticsTop 10 Best Event Analytics Software of 2026
Discover the top 10 event analytics software to track, analyze, and optimize your events. Find the best tools to boost engagement and ROI—start exploring now.

How we ranked these tools
Core product claims cross-referenced against official documentation, changelogs, and independent technical reviews.
Analyzed video reviews and hundreds of written evaluations to capture real-world user experiences with each tool.
AI persona simulations modeled how different user types would experience each tool across common use cases and workflows.
Final rankings reviewed and approved by our editorial team with authority to override AI-generated scores based on domain expertise.
Score: Features 40% · Ease 30% · Value 30%
Gitnux may earn a commission through links on this page — this does not influence rankings. Editorial policy
Editor’s top 3 picks
Three quick recommendations before you dive into the full comparison below — each one leads on a different dimension.
Mixpanel
Funnels and retention cohorts tied to event properties for cohort-level behavior tracking
Built for product and growth teams needing behavioral analytics with funnels and retention.
Amplitude
Editor pickCohort and retention analysis with flexible segmentation and behavioral breakdowns
Built for product and growth teams needing journey analytics and experimentation reporting.
Heap
Editor pickAutomatic event capture with full-fidelity replays of user interaction data for analysis
Built for product teams needing fast behavioral analytics with minimal instrumentation overhead.
Related reading
Comparison Table
This comparison table reviews leading event analytics platforms, including Mixpanel, Amplitude, Heap, Segment, and Snowplow, plus additional tools with distinct strengths. It maps each product’s event tracking model, analysis capabilities, data routing options, and integration approach so teams can compare fit for product, marketing, and engineering workflows.
Mixpanel
product analyticsProvides event-based product analytics with dashboards, funnels, cohorts, and attribution to measure attendee and engagement behaviors.
Funnels and retention cohorts tied to event properties for cohort-level behavior tracking
Mixpanel stands out for its event-first analytics built around behavioral funnels, retention cohorts, and conversion paths. It provides robust segmentation with property filters, user profiles for drill-down, and actionable breakdowns across time windows.
Analysts can turn event data into dashboards, alerts, and guided exploration workflows without relying on spreadsheet exports. Advanced teams get powerful schema and tracking governance to keep event definitions consistent across releases.
- +Funnel, retention, and path analysis support deep product behavior questions
- +Cohort segmentation enables fast comparisons across user lifecycles
- +User profiles and drill-down speed root-cause investigation after KPI shifts
- +Dashboards and saved analyses reduce repeat work for common reports
- +Alerting highlights metric changes so teams act without manual checks
- –Event schema design takes upfront effort to avoid unusable analytics later
- –Complex multi-step paths can become slower to iterate on
- –Some advanced workflows require careful setup of tracked properties
- –Visualization options feel less flexible than dedicated BI tools for custom layouts
Best for: Product and growth teams needing behavioral analytics with funnels and retention
More related reading
Amplitude
behavior analyticsDelivers event analytics with behavioral cohorts, funnels, experimentation analytics, and lifecycle views for optimizing event experiences.
Cohort and retention analysis with flexible segmentation and behavioral breakdowns
Amplitude stands out for its product analytics workflow that connects event data to user journeys and decision-making at scale. Core capabilities include event tracking, cohort and retention analysis, funnel exploration, and segmentation across attributes.
The platform also supports behavioral modeling with predictive insights, plus experimentation reporting that ties changes to user outcomes. Visualization, alerting, and collaboration features help teams operationalize metrics across releases.
- +Advanced funnel and journey analysis for granular user path optimization
- +Cohorts and retention reporting support deep lifecycle analytics
- +Strong event segmentation enables fast slices across attributes
- +Predictive insights help prioritize product opportunities
- –Event model setup and schema governance require disciplined instrumentation
- –Complex analyses can feel heavy without clear dashboard conventions
- –Cross-team collaboration depends on consistent naming and taxonomy
Best for: Product and growth teams needing journey analytics and experimentation reporting
Heap
event captureAutomatically captures user events and generates analytics without manual instrumentation to track and optimize event interactions.
Automatic event capture with full-fidelity replays of user interaction data for analysis
Heap stands out with automatic event capture that minimizes manual instrumentation across web and mobile experiences. It unifies product analytics with segmentation, funnels, retention, and cohort analysis built on collected behavioral data. Core workflows center on dashboards and exploratory analysis that connect events to user properties for rapid root-cause investigation.
- +Automatic event capture reduces engineering effort to start analyzing behavior
- +Powerful funnels, retention, and cohort tools support common product analytics workflows
- +Segmentation uses event and user properties for precise behavioral comparisons
- –Schema growth from auto-capture can complicate governance and maintainability
- –Advanced analysis depends on clean naming and property consistency across teams
- –Large event volumes can increase attention needed for performance and filtering
Best for: Product teams needing fast behavioral analytics with minimal instrumentation overhead
Segment
event pipelineCentralizes event collection and routing with a customer data pipeline so event analytics tools receive consistent tracking data.
Event routing with identity resolution for consistent tracking across destinations
Segment distinguishes itself with a unified customer data pipeline that routes event data from many sources into multiple destinations. It supports event collection, schema governance, and real-time and batch streaming workflows so event analytics stays consistent across tools.
Segment also provides tools for identity resolution and data transformation, which helps teams connect anonymous and known user journeys. Analysts get cleaner, more reliable event streams for funnels, retention, and behavioral analysis in downstream analytics platforms.
- +Strong event pipeline orchestration across many sources and destinations
- +Identity resolution and tracking normalization reduce fragmented user journeys
- +Built-in transformation workflows improve analytics-ready event data
- –Configuration complexity grows with advanced routing and data governance
- –Debugging event issues can require expertise across pipeline stages
- –Real analytics output depends heavily on chosen downstream tools
Best for: Product and analytics teams standardizing event data for multiple BI tools
Snowplow
self-hostable analyticsCollects and processes behavioral events through a customizable pipeline to power real-time and batch event analytics for events.
Enrichment pipeline for transforming events into analytics-ready structures
Snowplow stands out for event tracking built around an open schema and flexible pipeline controls. It provides end-to-end event ingestion with enrichment and transformation, then routes clean analytics-ready data to downstream tools.
The platform supports both JavaScript tracking and server-side event collection for handling complex data flows. Strong emphasis on privacy tooling and operational control helps teams govern event data across environments.
- +Flexible event collection with browser and server-side tracking options
- +Enrichment pipeline transforms raw events into analytics-ready fields
- +Privacy controls and governance features support regulated tracking needs
- +Works with many destinations through a modular data pipeline
- –Setup and pipeline tuning require engineering effort
- –Powerful configuration can slow down early experimentation
- –Operational overhead increases with self-managed deployments
- –Less streamlined UI experience than some hosted analytics suites
Best for: Teams needing governed event pipelines and enrichment without rigid analytics constraints
Google Analytics
web analyticsTracks event interactions on web properties with event parameters, funnels, and reporting to measure registration and onsite engagement.
Event reports and Explorations built on event parameters in GA4
Google Analytics stands out for event measurement that scales from basic page interactions to custom event tracking with Google Tag integration. It supports event-based reporting through Event reports, conversion tracking, and audience building for downstream analysis. Deep exploration features enable funnel and segment analysis using event parameters, while BigQuery export supports event-level analysis outside the standard dashboards.
- +Robust event tracking with custom event parameters and conversions
- +Powerful exploration tools for segments and funnels using event data
- +Seamless integration with Google Tag and advertising audiences
- –Event setup requires careful schema discipline across teams
- –Advanced analysis often depends on BigQuery or exploration workflows
- –Attribution modeling can be complex for multi-touch event journeys
Best for: Teams tracking customer interactions with event parameters and segmentation
Microsoft Clarity
behavior insightsAnalyzes on-page behavior with session recordings, heatmaps, and event insights to improve event landing pages.
Session recordings paired with click and scroll heatmaps for immediate UX diagnosis
Microsoft Clarity stands out by focusing on session behavior using heatmaps, scroll maps, and recordings rather than event instrumentation dashboards. It captures click, tap, and scroll interactions and links them to visual playback so teams can trace issues from visual evidence.
The tool also supports conversion goals and funnels, letting teams quantify where users drop off after specific interactions. Lightweight integrations with Microsoft ecosystems help teams deploy it quickly across web pages.
- +Session recordings with heatmaps connect user intent to real on-page behavior
- +Scroll and click heatmaps reveal friction without complex query building
- +Conversion goals and funnels support actionable drop-off analysis
- –Primarily web UX analytics limits depth for non-web event tracking
- –Advanced event schemas and custom event logic require extra setup effort
- –Large recordings can become hard to manage without strong filtering
Best for: Product teams analyzing web UX friction with event-driven goals and visual proof
Eventbrite Analytics
event platform analyticsOffers built-in reporting for ticket sales, attendee engagement, and performance metrics for hosted events on the Eventbrite platform.
Ticket sales and attendance dashboards that tie check-ins to event performance
Eventbrite Analytics centers reporting on ticketing and attendance metrics tied to events and organizers. Dashboards surface performance trends like ticket sales velocity, check-in counts, and revenue signals for past events and ongoing campaigns. It also supports audience and engagement views by drilling into attendee data and channel-level performance when available.
- +Event-level dashboards show ticket sales trends, check-ins, and revenue indicators in one view
- +Organizer summaries consolidate performance across events without building custom reports
- +Attendee-focused drilldowns help connect marketing activity to attendance outcomes
- –Deep analytics depend on Eventbrite event data, limiting cross-platform comparisons
- –Advanced segmentation and custom metrics are constrained compared with dedicated BI tools
- –Exporting and shaping data for complex dashboards takes more work than expected
Best for: Event teams tracking ticketing performance and attendance without BI engineering
HubSpot Marketing Analytics
marketing analyticsTracks marketing events and campaign performance with attribution reporting and dashboards tied to leads and contacts.
Contact-based attribution analytics that ties event engagement to lifecycle stages and pipeline
HubSpot Marketing Analytics connects event registration, email, web activity, and CRM records into one reporting layer tied to contacts and lifecycle stages. It supports campaign-level dashboards, attribution-style reporting across channels, and cohort views that reveal how audiences convert after attending or engaging.
The analytics experience becomes most useful inside the HubSpot ecosystem where marketing events sync with lists, workflows, and sales reporting. Visualizations are practical for monitoring performance but can feel limiting for highly custom event taxonomies and bespoke metrics.
- +Centralized reporting links event engagement to contact records and CRM outcomes
- +Campaign dashboards provide fast visibility into registrations, conversions, and pipeline impact
- +Cohort and lifecycle reporting helps track audience behavior after events
- –Event-specific reporting limits deeper custom metrics and complex session-level breakdowns
- –Reporting depends on proper HubSpot tracking and data hygiene to stay accurate
- –Advanced segmentation across many event attributes can be cumbersome
Best for: Marketing teams tracking event outcomes inside HubSpot with CRM-linked reporting
Tableau
BI dashboardsBuilds interactive dashboards and visual analytics for event KPIs by connecting event data from databases and analytics tools.
Tableau dashboard actions enable cross-filtering and drill paths across multiple event views
Tableau stands out for turning event-style data into interactive visual analytics through drag-and-drop design. It supports dashboards with filters, drill-down views, and calculated fields that help analysts explore user journeys and funnel steps. Its connections to many data sources and its publishing workflow enable shared, governed dashboards across teams.
- +Drag-and-drop dashboard building with interactive filters and drill-down
- +Strong calculated fields for transforming event attributes and metrics
- +Broad data connectivity supports multi-source event analytics workflows
- –Data modeling for complex event schemas can become labor-intensive
- –Performance tuning is needed for large, high-cardinality event datasets
- –Governance and security configuration adds overhead for distributed teams
Best for: Teams analyzing event journeys and funnels with interactive BI dashboards
Conclusion
After evaluating 10 data science analytics, Mixpanel stands out as our overall top pick — it scored highest across our combined criteria of features, ease of use, and value, which is why it sits at #1 in the rankings above.
Use the comparison table and detailed reviews above to validate the fit against your own requirements before committing to a tool.
How to Choose the Right Event Analytics Software
This buyer’s guide explains how to choose Event Analytics Software using concrete capabilities from Mixpanel, Amplitude, Heap, Segment, Snowplow, Google Analytics, Microsoft Clarity, Eventbrite Analytics, HubSpot Marketing Analytics, and Tableau. It maps behavioral analytics, event pipelines, and UX visualization into selection criteria that fit specific teams and event use cases.
What Is Event Analytics Software?
Event Analytics Software tracks user and attendee interactions as events, then analyzes those events with funnels, cohorts, segments, and dashboards. It solves problems like identifying where engagement drops, comparing user behavior across lifecycle stages, and linking actions to outcomes. Product analytics platforms like Mixpanel and Amplitude focus on behavioral funnels and retention cohorts from event streams. Event pipeline and enrichment tools like Segment and Snowplow ensure analytics-ready event data so downstream analysis stays consistent across sources.
Key Features to Look For
The right feature set depends on whether the organization needs behavioral analytics, governed event pipelines, marketing attribution, or visual UX diagnosis.
Behavioral funnels and step-by-step conversion analysis
Mixpanel provides funnels that connect event properties to conversion steps, which supports product behavior questions that require multi-event definitions. Amplitude also focuses on funnel exploration for journey-level optimization, which helps teams quantify where users change behavior across attributes.
Retention cohorts tied to event properties and lifecycle behavior
Mixpanel supports retention cohorts tied to event properties so cohort-level behavior stays connected to how events are defined. Amplitude delivers cohort and retention analysis with flexible segmentation and behavioral breakdowns for lifecycle comparisons.
Journey path and conversion-path exploration
Mixpanel emphasizes path analysis around funnels and event properties so teams can drill into behavior sequences after KPI shifts. Tableau supports interactive drill-down and calculated fields so analysts can explore event journeys across multiple dashboard views.
Automatic or low-instrumentation event capture
Heap reduces engineering effort with automatic event capture so teams can start analyzing funnels, retention, and cohorts from collected behavioral data. This approach fits organizations that need fast behavioral visibility without building a full manual tracking schema.
Event routing, identity resolution, and analytics-ready transformations
Segment centralizes event collection and routes events to multiple destinations with identity resolution so anonymous and known journeys can be normalized for analysis. Snowplow adds enrichment pipeline controls that transform raw events into analytics-ready structures for governed ingestion across environments.
Event-driven UX diagnosis with recordings and heatmaps
Microsoft Clarity pairs session recordings with click and scroll heatmaps so teams can diagnose landing page friction with visual evidence. Google Analytics complements event-driven measurement with GA4 Event reports and Explorations built on event parameters for onsite engagement and funnel segment analysis.
How to Choose the Right Event Analytics Software
A practical selection framework matches the tool’s event model, pipeline responsibilities, and reporting style to the organization’s event maturity and decision workflows.
Start by defining the event questions that must be answered
For drop-off and conversion questions, Mixpanel and Amplitude both provide funnel exploration that is built around event steps and event attributes. For lifecycle comparisons, Mixpanel retention cohorts and Amplitude cohort and retention reporting answer questions about how behavior changes across time and segments.
Decide whether tracking instrumentation or pipeline governance is the main bottleneck
If manual instrumentation is the blocker, Heap’s automatic event capture reduces the effort required to begin analyzing behavioral funnels, retention, and cohorts. If the blocker is consistency across sources, Segment identity resolution and Snowplow enrichment pipelines help ensure analytics-ready event structures reach analytics destinations in a controlled way.
Match reporting depth to how the team will operationalize insights
If the team needs dashboards and saved analyses for repeated KPI checks, Mixpanel supports dashboards and saved analyses so recurring behavior reports do not require rebuilding. If reporting must support highly interactive BI-style exploration, Tableau’s drag-and-drop dashboard building, calculated fields, and dashboard actions enable cross-filtering and drill paths across multiple views.
Validate that the tool fits the event environment and data flow
For regulated or complex event collection needs, Snowplow supports browser and server-side tracking options and privacy controls with modular pipeline routing. For standardized event data from many systems, Segment’s routing and transformation workflows reduce fragmented journeys that break attribution and funnel accuracy in downstream analytics.
Pick an output format that aligns with the stakeholders
For web UX troubleshooting with visual proof, Microsoft Clarity provides click and scroll heatmaps plus session recordings tied to user behavior. For organizer-level event operations on the Eventbrite platform, Eventbrite Analytics delivers ticket sales velocity, check-in counts, and revenue signals in event-level dashboards that avoid BI engineering.
Who Needs Event Analytics Software?
Different organizations need different kinds of event analytics because event sources, instrumentation maturity, and reporting goals vary widely.
Product and growth teams focused on behavioral analytics with funnels and retention
Mixpanel fits teams that need funnels and retention cohorts tied to event properties for cohort-level behavior tracking and fast root-cause drill-down. Amplitude also fits teams that need journey analytics with experimentation reporting and cohort and retention analysis with flexible segmentation.
Product teams that want analytics now without heavy instrumentation work
Heap is designed for fast start-up of behavioral analytics through automatic event capture and full-fidelity replays for analysis. This setup reduces engineering time spent defining every event property before insights are available.
Product and analytics teams standardizing event tracking across many tools and environments
Segment is the fit when multiple sources and destinations need consistent tracking because it centralizes event collection and routing with identity resolution. Snowplow is the fit when enrichment, transformation, and privacy-governed ingestion need to be controlled before events reach analytics consumers.
Marketing and CRM-driven teams measuring event engagement outcomes inside a single platform
HubSpot Marketing Analytics fits marketing teams that need contact-based attribution linking event registration and engagement to lifecycle stages and pipeline outcomes. This tool is most effective when HubSpot tracking and data hygiene keep event engagement connected to lead and contact records.
Common Mistakes to Avoid
Common failure points come from mismatching event governance to the tool’s strengths and overcomplicating event schemas without a plan for maintainability.
Designing an event schema without a governance plan
Mixpanel and Amplitude both require disciplined instrumentation and event definitions so funnels, cohorts, and segmentation remain usable after releases. Google Analytics and Heap also rely on clean naming and property consistency so Explorations and auto-captured insights do not degrade from schema drift.
Choosing a visual UX tool when deeper cross-event behavioral analysis is required
Microsoft Clarity focuses on session behavior with recordings, heatmaps, and visual diagnosis rather than deep multi-event analytics across complex journey definitions. Tableau and Mixpanel better match when the goal is event-based funnels, retention cohorts, and interactive journey exploration across properties.
Skipping identity resolution or event transformations before cross-destination analysis
Segment and Snowplow exist to prevent fragmented user journeys by normalizing identity and transforming events into analytics-ready fields. Without these steps, downstream funnels and retention work can become inconsistent across tools because event streams do not share the same identity mapping.
Building complex path analyses without performance and iteration discipline
Mixpanel supports multi-step path analysis but complex paths can be slower to iterate when event definitions expand. Tableau can also require performance tuning for large high-cardinality event datasets, so dashboards must be optimized as event volume grows.
How We Selected and Ranked These Tools
we evaluated every tool on three sub-dimensions with features weighted 0.4, ease of use weighted 0.3, and value weighted 0.3. The overall rating is computed as overall = 0.40 × features + 0.30 × ease of use + 0.30 × value for each product. Mixpanel separated itself through higher features performance tied to behavioral funnels and retention cohorts that are directly connected to event properties, which supports deeper analysis workflows for event-based product behavior. This same features strength also improved how quickly teams can investigate KPI shifts because user profiles and drill-down speed reduce the effort needed to turn event changes into actionable conclusions.
Frequently Asked Questions About Event Analytics Software
How do event-first analytics tools like Mixpanel and Amplitude differ from session-focused tools like Microsoft Clarity?
Which tools are best for retention and cohort analysis when event properties drive user behavior?
What is the most reliable way to standardize event tracking across multiple data sources and destinations?
Which platforms minimize manual instrumentation for web and mobile event capture?
How do analytics tools handle experimentation and tie changes to user outcomes?
Which tool is best for governed event ingestion, server-side collection, and enrichment pipelines?
What integration approach works when the goal is event-level analysis outside standard dashboards?
How can event analytics connect to CRM workflows for lifecycle and attribution reporting?
When dashboarding requires interactive drill-down across multiple views, which tool fits best?
Tools reviewed
Primary sources checked during evaluation.
Referenced in the comparison table and product reviews above.
Keep exploring
Comparing two specific tools?
Software Alternatives
See head-to-head software comparisons with feature breakdowns, pricing, and our recommendation for each use case.
Explore software alternatives→In this category
Data Science Analytics alternatives
See side-by-side comparisons of data science analytics tools and pick the right one for your stack.
Compare data science analytics tools→FOR SOFTWARE VENDORS
Not on this list? Let’s fix that.
Our best-of pages are how many teams discover and compare tools in this space. If you think your product belongs in this lineup, we’d like to hear from you—we’ll walk you through fit and what an editorial entry looks like.
Apply for a ListingWHAT THIS INCLUDES
Where buyers compare
Readers come to these pages to shortlist software—your product shows up in that moment, not in a random sidebar.
Editorial write-up
We describe your product in our own words and check the facts before anything goes live.
On-page brand presence
You appear in the roundup the same way as other tools we cover: name, positioning, and a clear next step for readers who want to learn more.
Kept up to date
We refresh lists on a regular rhythm so the category page stays useful as products and pricing change.