GITNUXSOFTWARE ADVICE
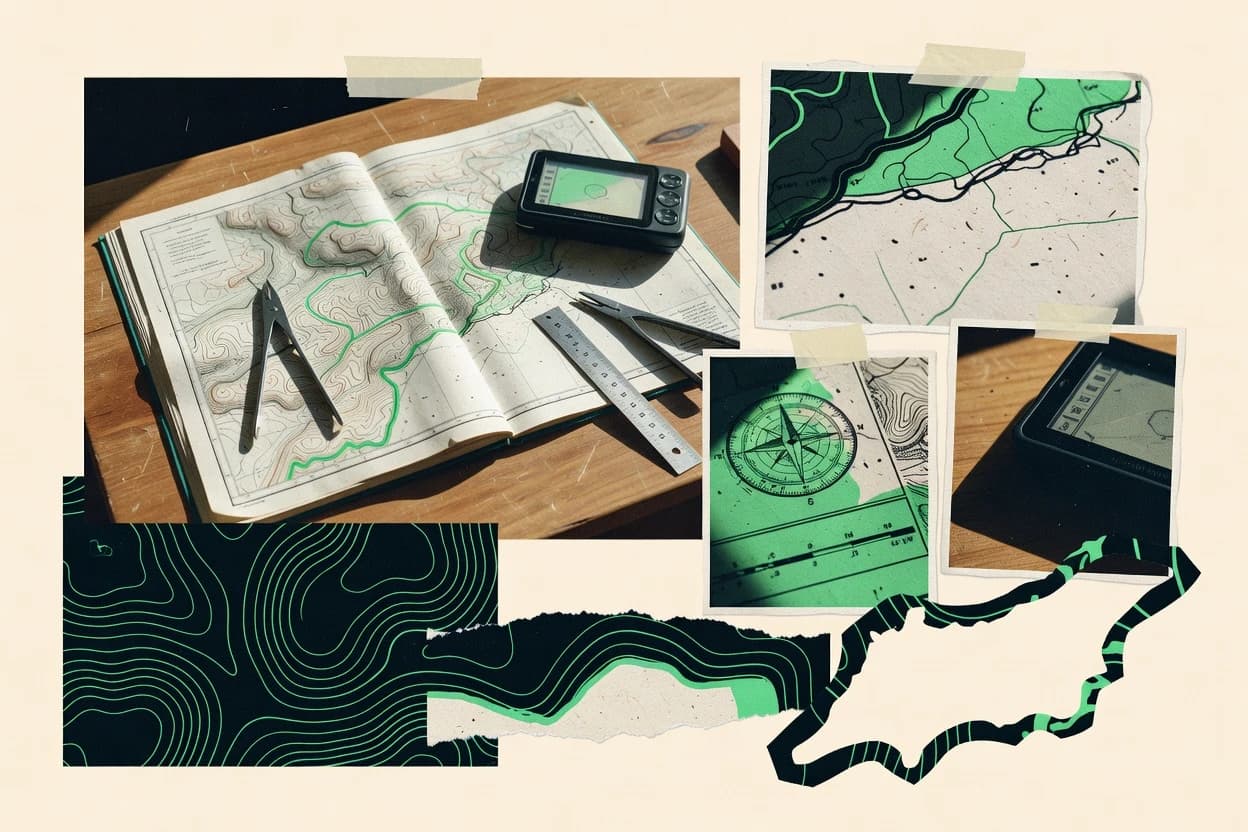
Science ResearchTop 10 Best Cartography Software of 2026
Compare the Top 10 Best Cartography Software picks for 2026, including QGIS, ArcGIS Pro, and ArcGIS Online. Explore rankings.

How we ranked these tools
Core product claims cross-referenced against official documentation, changelogs, and independent technical reviews.
Analyzed video reviews and hundreds of written evaluations to capture real-world user experiences with each tool.
AI persona simulations modeled how different user types would experience each tool across common use cases and workflows.
Final rankings reviewed and approved by our editorial team with authority to override AI-generated scores based on domain expertise.
Score: Features 40% · Ease 30% · Value 30%
Gitnux may earn a commission through links on this page — this does not influence rankings. Editorial policy
Editor’s top 3 picks
Three quick recommendations before you dive into the full comparison below — each one leads on a different dimension.
QGIS
Map Composer layout with Atlas-driven map series exporting
Built for cartographers and GIS teams producing styled maps and repeatable map series.
ArcGIS Pro
Editor pickCartographic Map Series for generating consistent map atlases from index features
Built for gIS-first teams producing repeatable, publication-ready maps with labeling automation.
ArcGIS Online
Editor pickMap Viewer style controls with web-friendly labeling and symbology
Built for teams publishing and maintaining cartographic web maps with controlled workflows.
Related reading
Comparison Table
This comparison table maps cartography and geospatial tooling across desktop GIS platforms, web mapping services, and Python-driven workflows. It contrasts QGIS, ArcGIS Pro, ArcGIS Online, GRASS GIS, GeoPandas, and related options by capability focus, typical use cases, and integration paths for building and publishing maps.
QGIS
desktop GISGIS desktop software for creating, editing, analyzing, and publishing map projects from spatial datasets.
Map Composer layout with Atlas-driven map series exporting
QGIS stands out by combining full GIS cartography with a modular plugin ecosystem and a mature desktop workflow. It supports map layout design with precise cartographic styling through vector, raster, and processing tools, including labeling, symbology, and scale-dependent rendering.
The Atlas and print layout features enable repeatable map series exports with controlled typography and legends. Tight interoperability with common geospatial formats makes it practical for end-to-end cartography from data prep to final map production.
- +High-fidelity map layouts with scalable legends, grids, and typographic control
- +Powerful labeling and rule-based symbology for consistent cartographic styling
- +Large plugin library for specialized cartography and data workflows
- +Strong support for map projections and geospatial format interoperability
- –Advanced cartographic tuning can feel complex without established workflows
- –Some export and rendering edge cases appear across different output formats
- –Performance can drop on heavy projects with large rasters and many layers
Best for: Cartographers and GIS teams producing styled maps and repeatable map series
More related reading
ArcGIS Pro
enterprise GISProfessional GIS application for building maps, performing spatial analysis, and authoring research-ready layouts.
Cartographic Map Series for generating consistent map atlases from index features
ArcGIS Pro stands out for cartographic production built directly into a GIS workflow with layout-aware styling and symbology management. It supports high-quality map layouts with annotation, map series, dynamic text, and export formats suitable for print and publishing.
Advanced geoprocessing and geodatabase-driven cartography enable repeatable map creation with automated updates to layers and labels. The tool also integrates strongly with ArcGIS data management for consistent cartographic rules across projects.
- +Layout and cartographic styling stay tightly linked to GIS layers
- +Map series and dynamic elements support repeatable production workflows
- +Robust labeling tools with expression-driven text and placement control
- +Strong symbology control for scale-based and attribute-driven cartography
- +Export options cover common print and publishing deliverables
- –UI complexity increases time-to-proficiency for labeling and layout tools
- –Some fine cartographic controls require iterative tweaking and testing
- –Best results depend on clean geodata and well-structured symbology rules
Best for: GIS-first teams producing repeatable, publication-ready maps with labeling automation
ArcGIS Online
web mappingCloud GIS platform for hosting web maps and feature layers used in interactive cartography and research sharing.
Map Viewer style controls with web-friendly labeling and symbology
ArcGIS Online stands out for cartography built directly around map publishing, styling, and collaboration tied to a large geographic data ecosystem. It supports layer-based thematic mapping, web map authoring, labeling controls, and cartographic visualization through built-in tools and configurable styles.
The platform also integrates with ArcGIS Pro workflows for symbol and style consistency, and it enables sharing maps and apps with role-based access. Cartography quality is strong for web publishing, while deep print-layout precision and highly custom cartographic automation can require additional design effort outside the core editor.
- +Publish web maps quickly with ready-to-use cartographic styles and basemaps
- +Labeling, symbology, and layer ordering tools cover common cartography needs
- +Collaboration features support shared maps and reproducible map services
- +Integration with ArcGIS Pro preserves styling consistency across products
- –Fine-grained map layout control for print outputs is limited versus desktop design tools
- –Advanced cartographic automation often needs external scripting or workflows
- –Complex symbol logic and multi-scale styling can become harder to manage
Best for: Teams publishing and maintaining cartographic web maps with controlled workflows
More related reading
GRASS GIS
open-source analysisOpen-source GIS and geospatial analysis suite for raster and vector processing used in scientific cartography workflows.
GRASS GIS map algebra and raster analysis modules integrated into cartographic layer creation
GRASS GIS stands out for its deep geospatial processing engine built around raster and vector operations, not just map styling. It supports cartographic workflows like map algebra, terrain analysis, and raster-to-vector processing that feed directly into cartographic output. Rendered maps can be produced via built-in display, layout tools, and export pipelines that integrate with standard GIS data formats.
- +Extensive raster and vector toolsets that directly support cartographic production
- +Powerful terrain and map algebra workflows for repeatable thematic mapping
- +Strong geoprocessing for cleaning, transforming, and preparing cartographic layers
- –Command-driven workflows can slow down purely design-focused cartography
- –Layout and styling capabilities are less intuitive than dedicated cartography tools
- –Scripting support adds flexibility but increases setup and maintenance overhead
Best for: Geospatial teams needing reproducible cartography driven by advanced GIS processing
GeoPandas
Python geospatialPython library that extends pandas with geospatial types and supports cartographic plotting and spatial analysis.
GeoPandas overlay and spatial join operations built on vector geometry operations
GeoPandas stands out by combining pandas-style data manipulation with geospatial geometry types in Python. It supports reading and writing common geospatial vector formats, spatial predicates, and robust geometry operations for cartography-ready datasets.
Cartographic output is typically produced by pairing GeoPandas with plotting libraries like Matplotlib, with control over projections, styles, and legends. Its core strength is transforming and validating spatial data to power reliable map creation workflows.
- +Pandas-like workflow for spatial joins and geometry transformations
- +Rich geometry operations including buffers, unions, and overlays
- +Direct support for many vector formats through common geospatial IO
- –Map styling and layout are limited compared with dedicated cartography tools
- –Large datasets can slow down without careful indexing and geometry handling
- –Python coding and environment setup are required for most cartography tasks
Best for: Data teams producing maps through code-based spatial processing
PostGIS
spatial databaseSpatial database extension for PostgreSQL that stores geometry and enables SQL-based spatial queries for mapping research.
ST_Intersects for spatial joins and overlay queries at scale
PostGIS stands out by adding spatial data types and geospatial functions directly to PostgreSQL. It supports core cartography workflows through geometry handling, topological analysis, and spatial indexing for fast map-oriented queries. Feature styles and rendering are not PostGIS strengths, so it serves best as a geospatial database and analytics engine feeding map tools.
- +Rich spatial types and functions for geometry editing and analysis
- +R-tree and GiST spatial indexes for fast map queries
- +SQL-first workflow fits automated geospatial ETL and processing
- +Supports reprojection and geometry validity tooling for clean layers
- –No built-in cartographic styling or rendering controls
- –Mapping workflows require external GIS or server integration
- –Complex spatial SQL can slow adoption for non-database users
Best for: Teams building spatial databases that power map rendering and analytics
More related reading
GeoServer
OGC publishingServer software that publishes geospatial data as OGC-compliant services for use in map clients and scientific dashboards.
SLD and Styled Layer Descriptor rules for server-side cartographic rendering
GeoServer stands out for enabling map publishing through open geospatial standards like WMS, WFS, and WCS. It supports advanced cartography workflows with SLD styling, dynamic layer configuration, and rich geospatial data integration from common databases and files.
The platform excels at producing reusable services for web maps and geospatial applications, with metadata, security, and output formats built around server-side rendering. It is less suited to fully graphical cartography pipelines because styling and publishing are primarily configured through service definitions and configuration files rather than visual drag-and-drop tools.
- +Standards-based publishing with WMS, WFS, and WCS for broad interoperability
- +SLD styling enables fine-grained cartographic control per layer and rule
- +Supports tiled outputs and multiple rendering formats for web performance
- –Configuration relies heavily on server settings and SLD authoring
- –Styling iteration is slower than purely GUI-based cartography tools
- –Complex deployments require careful management of data sources and security
Best for: Teams publishing standards-based maps and feature services with SLD-driven cartography
MapLibre GL
vector tilesClient-side library for rendering interactive vector tile maps that supports scientific cartography interfaces.
Custom style JSON with expression-based layer styling for vector tiles
MapLibre GL stands out for enabling custom, code-driven web map rendering using an open, Mapbox GL–compatible rendering stack. It supports vector tiles, custom style JSON, interactive layers, and GPU-accelerated cartography in the browser.
The toolkit includes robust event handling for user interaction and flexible styling for markers, lines, polygons, and raster overlays. MapLibre GL is best suited to cartographic products that ship as web applications with dynamic styling and interaction rather than static map production.
- +Vector tile and style JSON pipeline enables detailed, scalable cartography
- +GPU-accelerated rendering keeps layers responsive during pan and zoom
- +Rich layer styling supports lines, polygons, symbols, and raster overlays
- +Event APIs enable click, hover, and filter-driven interactivity
- –Requires engineering work for tile hosting, styling, and data pipelines
- –Style JSON debugging can be time-consuming for complex layer stacks
- –Advanced cartographic effects depend on custom expressions and careful tuning
Best for: Teams building interactive web maps with vector-tile styling control
More related reading
Leaflet
web mappingOpen-source JavaScript library for building interactive web maps with layers, markers, and custom projections for research.
Layer system with GeoJSON support and interactive vector events
Leaflet stands out for building interactive web maps with lightweight, standards-based JavaScript. Core capabilities include tile-layer rendering, vector overlays, and event-driven interactivity for markers, polygons, and popups.
Strong plugin support covers geocoding, heatmaps, and additional controls, while Mapbox-style advanced cartographic pipelines are mostly out of scope. The result fits teams that need fast, customizable cartography delivered in browsers.
- +Lightweight map rendering with predictable performance for standard web tiles
- +First-class interactivity for markers, layers, and popups using simple APIs
- +Plugin ecosystem extends controls, visualization layers, and data handling options
- –No built-in styling workflow for complex cartographic symbolization
- –Advanced projections and geospatial analysis require external libraries
- –State management and data scaling depend heavily on custom application code
Best for: Teams shipping interactive web maps with custom styling and overlays
OpenLayers
GIS web clientJavaScript mapping library that supports multiple map sources and projections for building research-grade web cartography.
Layer-based rendering with vector styling and built-in WMS and WMTS support
OpenLayers stands out for its map-rendering library focus, letting developers compose custom cartographic experiences in a flexible JavaScript stack. It provides core web mapping capabilities like tile layers, vector layers, styling, projections, and rich view interactions.
It also integrates with common geospatial workflows through Web Mercator support, GeoJSON handling, and extensible controls. The result is strong control over rendering and interaction design, with less built-in structure for end-to-end cartography authoring.
- +Highly customizable rendering with vector styling and layer-level control
- +Broad standards support including WMS and WMTS tile services
- +Extensive interaction and control system for pan, zoom, and editing
- –Requires significant JavaScript and geospatial setup for productive use
- –Less turnkey cartography authoring than GIS desktop or web studios
- –Complex styling and projection handling can create integration overhead
Best for: Developers building interactive web maps with custom cartographic behavior
How to Choose the Right Cartography Software
This buyer's guide helps cartography teams choose among QGIS, ArcGIS Pro, ArcGIS Online, GRASS GIS, GeoPandas, PostGIS, GeoServer, MapLibre GL, Leaflet, and OpenLayers. It maps common cartographic outcomes like layout production, reproducible map series, web publishing, and code-driven rendering to concrete tool capabilities and limitations.
What Is Cartography Software?
Cartography software covers the workflows used to style spatial data, label features, compose map layouts, and publish maps for print or web. Many solutions also include geospatial processing tools that prepare layers for consistent cartographic output. QGIS demonstrates desktop cartography with Map Composer layout and Atlas-driven map series exporting, while ArcGIS Pro demonstrates GIS-integrated cartography with cartographic Map Series and layout-aware styling. Teams typically use these tools to produce publication-ready maps, interactive web maps, or standards-based map services.
Key Features to Look For
The fastest path to better cartography comes from matching cartographic output needs to the tool’s strongest pipeline, whether that is desktop layout, GIS-integrated map series, or web rendering stacks.
Atlas-driven map series exporting for repeatable layouts
Atlas-driven exports keep legends, typography, and map framing consistent across a map series. QGIS supports Atlas-driven Map Composer map series exporting for controlled print-ready output, while ArcGIS Pro provides cartographic Map Series built from index features for repeatable atlases.
Layout-aware styling with dynamic labels and annotation control
Layout-aware styling ties symbology and labeling behavior to the map frame and export context. ArcGIS Pro keeps layout and cartographic styling linked to GIS layers and supports robust labeling with expression-driven text, while QGIS provides labeling and symbology controls plus typographic control in its layout workflow.
Rule-based symbology and scale-dependent cartography controls
Scale-dependent and attribute-driven rules prevent symbol logic from breaking across zoom levels and map scales. QGIS enables powerful labeling and rule-based symbology for consistent styling, and ArcGIS Pro provides strong symbology control for scale-based and attribute-driven cartography.
Web cartography publishing with style controls
Web cartography tooling should prioritize map authoring and styling that ships to viewers and collaborators. ArcGIS Online focuses on publishable web maps with ready-to-use cartographic styles plus map publishing workflows, while its Map Viewer style controls support web-friendly labeling and symbology.
Standards-based server publishing with SLD-driven cartography
OGC service publishing helps teams share layers across clients while keeping cartographic rendering rules under server control. GeoServer supports WMS, WFS, and WCS and uses SLD and Styled Layer Descriptor rules for server-side cartographic rendering.
Code-driven interactive rendering for vector tiles and overlays
Interactive web cartography benefits from developer control over tile delivery, expressions, and GPU rendering behavior. MapLibre GL provides custom style JSON with expression-based layer styling for vector tiles, while Leaflet offers a lightweight layer system with GeoJSON support and interactive vector events.
How to Choose the Right Cartography Software
Selection should start with the output format and workflow ownership, then map those needs to the strongest cartography and publishing capabilities across the top tools.
Decide the delivery target: print layout, interactive web, or standards-based services
If map delivery is print-focused with controlled typography and repeatable exports, start with QGIS or ArcGIS Pro because both include map layout production plus series exporting via Atlas-driven or Map Series workflows. If delivery is interactive web maps, use MapLibre GL or Leaflet because both are designed for browser rendering with vector overlays and event-driven interaction.
Pick the tool that owns cartographic consistency end-to-end
For consistent cartographic rules from data to styled output, ArcGIS Pro is built around GIS layers that feed layout-aware styling and Map Series generation. For desktop teams that want precise cartographic tuning with a modular plugin ecosystem, QGIS offers Map Composer layouts with Atlas-driven map series exporting and detailed labeling plus symbology controls.
Match styling workflow to where symbol logic will be maintained
If symbol logic must be maintained in a server-side publishing model, choose GeoServer because it renders cartography through SLD Styled Layer Descriptor rules for WMS and other OGC services. If symbol logic must be maintained in a client rendering pipeline, choose MapLibre GL with style JSON and expression-based styling for vector tiles.
Plan for data processing depth versus design-first cartography
If the primary bottleneck is raster-to-vector preparation, terrain analysis, and repeatable geoprocessing feeding cartography, GRASS GIS provides map algebra and raster analysis modules integrated into cartographic layer creation. If the primary bottleneck is spatial joins, overlays, and geometry validation for cartography-ready datasets, GeoPandas supports GeoPandas overlay and spatial join operations built on vector geometry operations.
Use databases and GIS engines when cartography depends on spatial queries at scale
If cartography relies on fast spatial joins and overlay queries from a centralized data store, PostGIS provides spatial types, geometry functions, and ST_Intersects for spatial joins at scale. If web clients need flexible access to geospatial layers through service endpoints, GeoServer and ArcGIS Online can publish map content as WMS style-driven layers or web maps that collaborators can share with role-based access.
Who Needs Cartography Software?
Different cartography needs map directly to different tool strengths across desktop layout production, server publishing, vector-tile rendering, and code-driven spatial processing.
Cartographers and GIS teams producing styled maps and repeatable map series
QGIS fits this need because Map Composer supports Atlas-driven map series exporting with scalable legends, grids, and typographic control. ArcGIS Pro also fits this need with cartographic Map Series that generate consistent map atlases from index features.
GIS-first teams building publication-ready layouts with labeling automation
ArcGIS Pro fits because its cartographic workflow keeps layout and styling linked to GIS layers and includes expression-driven labeling and placement control. QGIS also supports robust labeling and typographic control for repeatable production, especially when desktop export pipelines are required.
Teams publishing and maintaining cartographic web maps
ArcGIS Online fits because it enables publishable web maps with ready-to-use cartographic styles plus collaboration features for shared maps. MapLibre GL fits teams that need interactive, custom vector-tile cartography with style JSON and expression-driven styling.
Geospatial teams needing reproducible cartography driven by advanced GIS processing
GRASS GIS fits because it provides deep raster and vector toolsets with map algebra and terrain analysis modules that feed cartographic layer creation. GeoPandas fits teams that want code-based spatial workflows using overlay and spatial join operations for cartography-ready datasets.
Common Mistakes to Avoid
Common selection errors come from choosing a tool for the wrong stage of the pipeline, like using a database extension for rendering or underestimating the setup needed for code-driven cartography.
Choosing a rendering tool for server cartography rules without SLD support
GeoServer includes SLD and Styled Layer Descriptor rules for server-side cartographic rendering through WMS and related OGC services, which fits teams that need standardized service delivery. Map styling iteration is slower in GeoServer because configuration relies on server settings and SLD authoring rather than purely visual workflows.
Expecting PostGIS or GeoPandas to provide finished cartographic layouts
PostGIS provides spatial types, functions, and indexes like GiST plus ST_Intersects for joins, but it has no built-in cartographic styling or rendering controls. GeoPandas supports geometry operations for cartography-ready datasets but typically requires pairing with plotting libraries like Matplotlib for map output.
Underestimating desktop layout complexity and fine cartographic tuning effort
ArcGIS Pro can take longer to reach labeling and layout proficiency because the UI complexity increases time-to-proficiency for labeling and layout tools. QGIS offers powerful cartographic controls but advanced cartographic tuning can feel complex without established workflows.
Building interactive web maps without planning for tile hosting and style JSON debugging
MapLibre GL requires engineering work for tile hosting, styling, and data pipelines, and style JSON debugging can become time-consuming for complex layer stacks. OpenLayers also requires significant JavaScript and geospatial setup for productive use, so teams need engineering capacity for custom cartographic behavior.
How We Selected and Ranked These Tools
we evaluated every tool on three sub-dimensions. features carry a weight of 0.4. ease of use carries a weight of 0.3. value carries a weight of 0.3. overall equals 0.40 × features plus 0.30 × ease of use plus 0.30 × value. QGIS separated itself through high-fidelity desktop cartography features like Map Composer layout with Atlas-driven map series exporting, which directly strengthened the features dimension.
Frequently Asked Questions About Cartography Software
Which cartography tool is best for producing repeatable print map series with consistent typography and legends?
What’s the most direct choice for cartography that stays inside a GIS database workflow?
Which tool should be selected for standards-based map publishing to web clients using OGC services?
Which platform is strongest for web cartography that uses vector tiles and custom style logic in code?
Which tool is best for automating spatial data transformations before cartographic styling?
When should a team use GeoPandas instead of a full desktop GIS layout tool?
What’s the practical difference between ArcGIS Online and QGIS for cartography outcomes?
Which option is best for implementing interactive cartographic layers in a browser with minimal framework overhead?
Why might GRASS GIS be chosen over PostGIS for cartographic production?
Conclusion
After evaluating 10 science research, QGIS stands out as our overall top pick — it scored highest across our combined criteria of features, ease of use, and value, which is why it sits at #1 in the rankings above.
Use the comparison table and detailed reviews above to validate the fit against your own requirements before committing to a tool.
Tools reviewed
Primary sources checked during evaluation.
Referenced in the comparison table and product reviews above.
Keep exploring
Comparing two specific tools?
Software Alternatives
See head-to-head software comparisons with feature breakdowns, pricing, and our recommendation for each use case.
Explore software alternatives→In this category
Science Research alternatives
See side-by-side comparisons of science research tools and pick the right one for your stack.
Compare science research tools→FOR SOFTWARE VENDORS
Not on this list? Let’s fix that.
Our best-of pages are how many teams discover and compare tools in this space. If you think your product belongs in this lineup, we’d like to hear from you—we’ll walk you through fit and what an editorial entry looks like.
Apply for a ListingWHAT THIS INCLUDES
Where buyers compare
Readers come to these pages to shortlist software—your product shows up in that moment, not in a random sidebar.
Editorial write-up
We describe your product in our own words and check the facts before anything goes live.
On-page brand presence
You appear in the roundup the same way as other tools we cover: name, positioning, and a clear next step for readers who want to learn more.
Kept up to date
We refresh lists on a regular rhythm so the category page stays useful as products and pricing change.