GITNUXSOFTWARE ADVICE
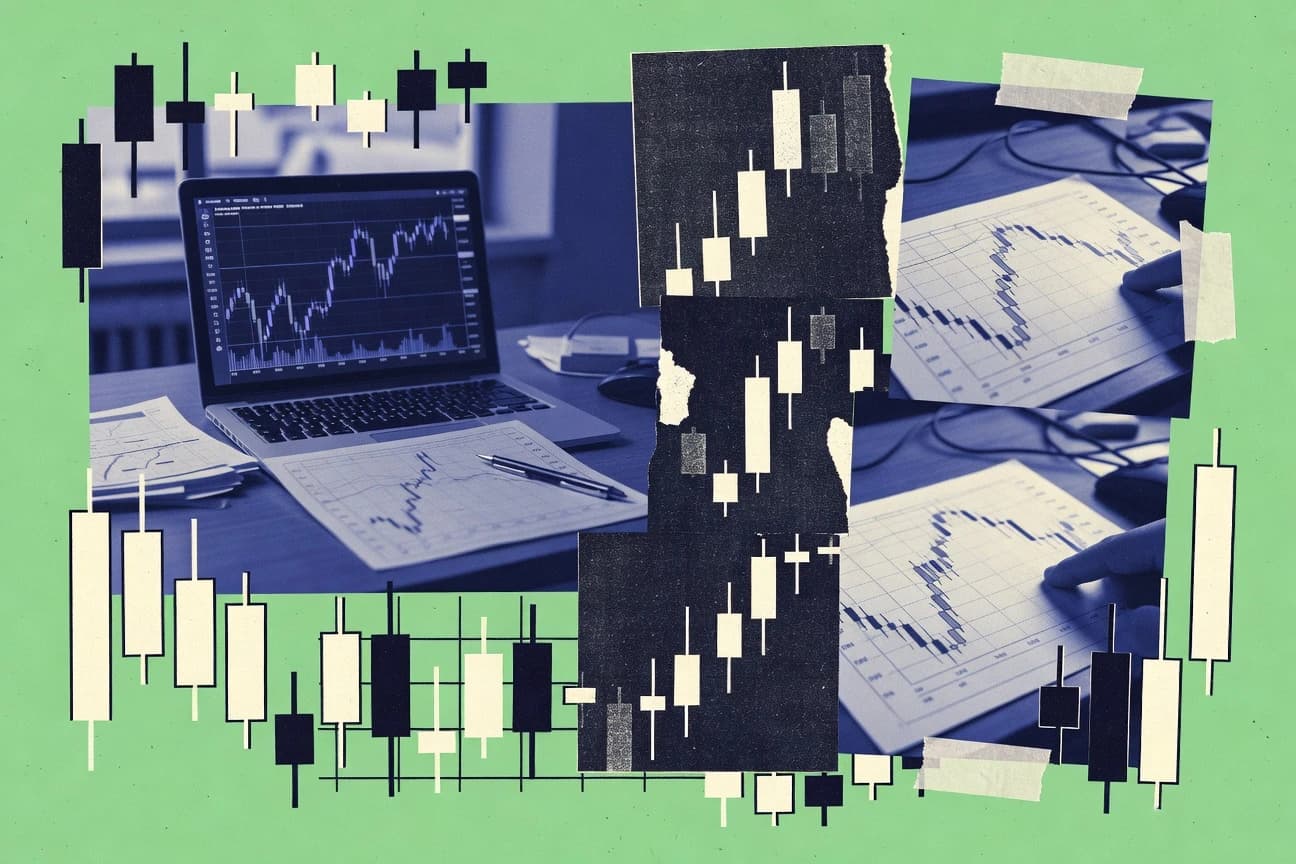
Data Science AnalyticsTop 10 Best Candlestick Chart Software of 2026
Top 10 Candlestick Chart Software picks ranked for charting power and speed. Compare TradingView and MetaTrader 5. Explore the best options.

How we ranked these tools
Core product claims cross-referenced against official documentation, changelogs, and independent technical reviews.
Analyzed video reviews and hundreds of written evaluations to capture real-world user experiences with each tool.
AI persona simulations modeled how different user types would experience each tool across common use cases and workflows.
Final rankings reviewed and approved by our editorial team with authority to override AI-generated scores based on domain expertise.
Score: Features 40% · Ease 30% · Value 30%
Gitnux may earn a commission through links on this page — this does not influence rankings. Editorial policy
Editor’s top 3 picks
Three quick recommendations before you dive into the full comparison below — each one leads on a different dimension.
TradingView
Pine Script backtesting with custom indicators directly on candlestick charts
Built for traders needing highly configurable candlestick charts plus Pine-based automation.
MetaTrader 5
Editor pickStrategy Tester with multi-currency and tick modeling for EA performance
Built for traders needing candlestick charting plus automated strategy backtesting.
MetaTrader 4
Editor pickStrategy Tester with tick-driven backtesting for indicators and Expert Advisors
Built for traders needing candlestick charting plus automated execution tools.
Related reading
Comparison Table
This comparison table evaluates candlestick charting software across TradingView, MetaTrader 5, MetaTrader 4, NinjaTrader, cTrader, and additional platforms that support OHLC visualization and technical analysis workflows. Readers can scan side-by-side differences in charting features, order execution tools, market connectivity, indicator support, and automation options to match platform capabilities to specific trading styles.
TradingView
web-based chartsProvides interactive candlestick charting with built-in technical indicators, watchlists, alerts, and broker integration for market analysis.
Pine Script backtesting with custom indicators directly on candlestick charts
TradingView stands out with an always-on web charting experience that makes candlestick analysis immediately interactive. It supports drawing tools, multiple chart types, and a full technical-indicator stack designed for candle-centric workflows.
The Pine Script environment enables custom indicators and strategies with backtesting so candlestick patterns can be automated and tested. Social ideas and watchlists add context around the same symbols and intervals used for candlestick charting.
- +Web-based candlestick charts load quickly with smooth pan and zoom
- +Pine Script supports custom indicators and strategy backtesting on candles
- +Large indicator library covers trend, momentum, and volatility models
- +Rich drawing tools include patterns, trendlines, and multi-timeframe studies
- +Watchlists and alerts integrate directly with chart views
- –Alert and automation workflows can feel complex for candle-only tasks
- –Advanced Pine customization requires programming discipline
- –Some data subscriptions and exchanges limit specific candle ranges
- –Backtests can diverge from execution realities without careful modeling
Best for: Traders needing highly configurable candlestick charts plus Pine-based automation
More related reading
MetaTrader 5
platform + algoDelivers professional candlestick charting with depth-of-market views, indicators, and automated trading support via MQL5.
Strategy Tester with multi-currency and tick modeling for EA performance
MetaTrader 5 stands out with a charting and trading workspace that tightly integrates candlestick analysis with automated strategies and execution. It supports multiple timeframes, chart indicators, and drawing tools built for markups on candlestick charts.
Its strategy tester and order management tools support structured backtesting workflows and live chart-based monitoring. The platform also scales across many brokers and instruments, which matters for candlestick patterns that depend on consistent symbol data.
- +Multi-timeframe candlestick charts with fast zoom and scroll
- +Rich indicator library with customizable studies for pattern confirmation
- +Built-in algorithmic trading tools tied to chart updates
- –Advanced customization has a steep learning curve for many workflows
- –Resource use can rise with many symbols, indicators, and objects
- –UX for candlestick-only analysis feels less focused than dedicated charting tools
Best for: Traders needing candlestick charting plus automated strategy backtesting
MetaTrader 4
platform + algoOffers candlestick charting with customizable indicators and strategy development through MQL4 for forex and CFD markets.
Strategy Tester with tick-driven backtesting for indicators and Expert Advisors
MetaTrader 4 stands out for its mature candlestick charting workflow and extensive indicator ecosystem. It supports multi-timeframe candlestick analysis with drawing tools, automated trading via Expert Advisors, and script-based chart utilities.
The platform enables customizable chart layouts and visual levels for trade planning, while relying on broker-provided feeds for symbol coverage. Candle-by-candle inspection and event-driven order execution make it suitable for technical traders who want both charts and execution in one environment.
- +Strong candlestick charting with many indicators and customizable templates
- +Integrated trade execution from chart trading and order management windows
- +Built-in backtesting and strategy testing for indicator and EA workflows
- +Extensive drawing tools for trendlines, channels, and annotation
- –UI complexity grows with many panels, indicators, and templates
- –Chart performance can degrade with heavy indicator stacks on slower machines
- –Broker symbol availability and data quality can limit consistent analysis
Best for: Traders needing candlestick charting plus automated execution tools
More related reading
NinjaTrader
advanced chartingSupports advanced candlestick charting with order flow tools, automated strategies, and historical market data for futures and forex.
NinjaScript supports custom candlestick indicators and automated strategies
NinjaTrader stands out with deep trading automation support alongside full candlestick charting and market analysis. The platform provides configurable candlestick charts with technical indicators, strategy testing, and order management workflows that integrate directly with chart views. Built-in drawing tools support price-action annotation, and the NinjaScript programming interface enables custom candlestick logic, indicators, and automated strategies.
- +Advanced candlestick chart customization with multiple overlays and studies
- +NinjaScript enables custom candlestick indicators and strategy logic
- +Backtesting and strategy tools connect tightly to chart-driven workflows
- –Charting UI has a steeper learning curve than simpler chart platforms
- –Custom candlestick logic often requires coding in NinjaScript
- –Advanced setup for automation and execution can add configuration overhead
Best for: Active traders needing candlestick charting plus programmable automation
cTrader
trading platformProvides candlestick charting with technical indicators, watchlists, and algorithmic trading automation for FX and CFDs.
cTrader Automate integration between chart signals and algorithmic trade strategies
cTrader’s standout edge for candlestick charting is its tight integration with algorithmic order execution and its highly responsive charting workspace. It provides robust drawing tools for candlestick structure work, including multi-timeframe chart views, customizable indicators, and alerting tied to price action. Chart customization and layout control are strong enough for systematic review cycles, while advanced analysis workflows may require extra setup when using third-party indicators.
- +Multi-timeframe candlestick layouts support fast structure comparison
- +Extensive drawing tools for trendlines, zones, and candle annotations
- +Indicator and strategy integration supports automated workflows
- +Clear chart customization improves readability for different trading styles
- –Advanced candlestick workflows can feel complex versus simpler charting tools
- –Some power features depend on additional configuration and scripting
- –Candlestick-focused layout management is less streamlined than top chart-first platforms
Best for: Traders who pair candlestick analysis with automated execution workflows
ChartIQ
developer chartingDelivers a JavaScript charting engine that renders candlestick charts and supports custom indicators for web trading interfaces.
ChartIQ custom studies and drawing tools built for embedded candlestick chart interactions
ChartIQ stands out for its developer-focused charting engine aimed at embedding fully interactive candlestick charts into custom trading interfaces. It supports rich interactions like drawing tools, annotations, and technical-study overlays driven by a configurable chart layout.
The platform emphasizes responsive chart performance and real-time update handling so candlesticks can stay synchronized with incoming market data. Built for application integration, it offers fewer out-of-the-box trading workflows than charting suites that prioritize user-first terminals.
- +Highly embeddable candlestick engine for building custom trading interfaces
- +Strong support for interactive drawings, annotations, and chart controls
- +Smooth handling of dynamic updates for real-time candlestick streams
- +Flexible theming and configuration for chart behavior and presentation
- –More engineering effort than user-first chart terminals
- –Depth of trading workflows lags platforms focused on execution and scanning
- –Advanced study customization requires developer familiarity
- –Feature usage depends on correct integration and data feed wiring
Best for: Developers building embedded candlestick charting into custom trading tools
More related reading
Highcharts
UI chart librarySupports candlestick series rendering with interactive tooltips, zooming, and theming for embedding financial charts in analytics apps.
Candlestick series support with extensive plot options for realistic OHLC styling
Highcharts stands out for fast, browser-native rendering of financial chart types like candlesticks with a strong JavaScript charting focus. It provides a dedicated candlestick series with configurable plot options, axes, tooltips, and interactive behaviors such as hover states and legend-driven series control.
Chart customization is extensive through theming, event hooks, and the ability to augment series data processing before rendering. Large dashboards benefit from reusable configuration patterns and consistent styling across multiple chart types.
- +Rich candlestick series configuration with tight control over colors and styling
- +Interactive tooltips and hover behavior work well for financial time-series inspection
- +Solid API for axes, extremes, and series updates without reloading charts
- +Theming and chart-level options support consistent styling across dashboards
- –Advanced behaviors require deeper JavaScript knowledge and careful event wiring
- –Highly custom financial overlays can demand substantial configuration and iteration
- –Performance tuning can be necessary for very large datasets and frequent updates
Best for: Teams embedding interactive candlestick charts into web apps with code control
StockCharts
technical analysisProvides candlestick and other chart types with screening, pattern tools, and indicator overlays for equity technical analysis.
StockCharts SharpCharts with saved indicators and chart templates for candlestick workflows
StockCharts stands out for its extensive candlestick charting workflows built around customizable indicators and chart templates. It supports drawing tools, multi-timeframe views, and technical scans that connect candlestick patterns with watchlists and screening results. The platform also emphasizes usability for recurring technical setups through saved chart settings and indicator presets.
- +Robust candlestick chart styling with templates for repeatable setups
- +Large indicator library with quick switching and overlay combinations
- +Integrated scanning and watchlists that pair well with candlestick analysis
- +Solid drawing tools for trendlines, channels, and annotations
- +Timeframe and layout controls support multi-chart technical reviews
- –Advanced customization can feel complex for pure candlestick users
- –Chart layout management takes extra steps for frequent reconfiguration
- –Trading-focused workflows like order ticketing are limited for many users
Best for: Active investors using candlestick charts with indicator presets and screening workflows
More related reading
Chart.js
open-source libraryImplements candlestick-style financial charts via plugins that add high-low-open-close rendering to interactive analytics dashboards.
Extensible plugin and custom chart-type API for building OHLC candlestick rendering
Chart.js stands out as a lightweight, canvas-based charting library that renders candlestick-style visuals using custom chart types or plugins. It offers a rich configuration model for scales, axes, tooltips, and interactive hover behavior, which supports financial-style chart interactions.
Candlestick rendering requires additional setup beyond the built-in chart types, but the underlying extensibility makes it feasible. Data handling and rendering remain tightly coupled to the provided dataset format and custom logic for open-high-low-close values.
- +Canvas rendering delivers fast redraws for interactive candlestick hover states
- +Plugin architecture enables custom scales, formatters, and candlestick draw logic
- +Configurable axes, tooltips, and legends support financial-style presentation needs
- –Candlestick charting often requires a custom chart type or plugin implementation
- –No dedicated OHLC data model reduces plug-and-play readiness for candlesticks
- –Advanced financial features like volume overlays need custom composition work
Best for: Developers embedding lightweight candlestick visuals into web apps with custom logic
Plotly
data visualizationCreates interactive candlestick charts with extensive customization for analytics notebooks and dashboards.
Candlestick trace with built-in interactivity and seamless Dash callback integration
Plotly stands out for generating interactive, browser-ready financial charts with candlestick support and rich hover details. It pairs declarative chart construction with reusable Python and JavaScript APIs that expose axis, styling, and layout controls for OHLC data.
The library also supports dashboard integration via Plotly Dash, enabling coordinated views and interactive callbacks around trading-style analytics. For candlestick chart software tasks, it covers rendering, annotation, and interactivity, while automated trading indicators and broker connectivity are not the focus.
- +Interactive candlestick charts with detailed hover and zoom controls
- +Strong theming options for candles, axes, and annotations
- +Dash integration enables linked views and responsive dashboards
- –Requires code or dashboard setup for repeatable workflows
- –Financial indicator libraries are not built-in at trading-platform level
- –Large datasets can slow rendering without optimization
Best for: Teams building interactive OHLC candlestick dashboards with code-based customization
How to Choose the Right Candlestick Chart Software
This buyer’s guide explains how to choose candlestick chart software across TradingView, MetaTrader 5, MetaTrader 4, NinjaTrader, cTrader, ChartIQ, Highcharts, StockCharts, Chart.js, and Plotly. It covers charting depth, indicator and automation fit, and developer embedding needs using concrete capabilities like Pine Script backtesting and NinjaScript custom logic. It also highlights common failure modes like overly complex alert automation and chart performance degradation from heavy indicator stacks.
What Is Candlestick Chart Software?
Candlestick chart software renders OHLC price action as candlesticks and adds interactivity like pan and zoom plus drawing tools such as trendlines and annotations. It solves workflow problems around identifying candle structure, validating signals with indicator overlays, and reviewing multi-timeframe behavior consistently. Many platforms also connect chart views to automation, such as TradingView’s Pine Script backtesting directly on candlestick charts. Some tools target technical users building custom dashboards, such as Highcharts, Chart.js, and Plotly, which focus on candlestick rendering and interactivity inside web or notebook environments.
Key Features to Look For
The right candlestick software depends on how strongly it matches signal discovery, visual markup, and automation to the same candle-driven workflow.
Candle-native chart interactivity and drawing tools
Fast pan and zoom plus responsive hover inspection matter when reviewing candle-by-candle structure. TradingView delivers smooth web chart navigation with rich drawing tools, while StockCharts provides solid drawing support for trendlines, channels, and annotations tied to recurring technical setups.
Built-in indicator and studies library for candlestick confirmation
A large indicator library reduces the need to recreate basic trend, momentum, and volatility models. TradingView includes a large indicator library spanning trend, momentum, and volatility, and StockCharts offers quick switching among a large indicator library with saved presets.
Custom indicator and automation framework tied to candlesticks
Automation matters when candle patterns drive repeatable strategies and systematic reviews. TradingView pairs Pine Script custom indicators with strategy backtesting directly on candle charts, and NinjaTrader provides NinjaScript to build custom candlestick indicators and automated strategies.
Backtesting and strategy testing with candlestick and tick modeling
Backtesting quality changes outcomes, so the testing model should match trading reality. MetaTrader 5 includes a Strategy Tester with multi-currency and tick modeling for EA performance, and MetaTrader 4 offers a Strategy Tester with tick-driven backtesting for indicators and Expert Advisors.
Multi-timeframe charting for structure comparison
Candlestick patterns often confirm across multiple timeframes, so layouts and time navigation must be fast. MetaTrader 5 and MetaTrader 4 support multi-timeframe candlestick analysis with zoom and scroll, and cTrader supports multi-timeframe candlestick layouts for structure comparison.
Embedding and integration controls for candlestick dashboards
Teams that build custom web interfaces need a candlestick engine with strong configuration and event hooks. ChartIQ is a developer-focused embeddable JavaScript candlestick engine built for interactive drawings and real-time update handling, while Highcharts and Plotly provide candlestick series or traces with interactive tooltips and dashboard integration.
How to Choose the Right Candlestick Chart Software
Selection works best by mapping charting, indicators, automation, and integration requirements to specific platform capabilities.
Define the candlestick workflow scope
If the workflow centers on interactive candle analysis plus custom strategy automation, TradingView is a strong match because Pine Script lets custom indicators and strategy logic run directly on candlestick charts. If the workflow must combine charting with automated execution inside a trading terminal, MetaTrader 5 and MetaTrader 4 provide chart-driven order management alongside strategy testing.
Match automation and backtesting to the execution model
Choose a platform whose backtesting uses the testing model needed for the instrument class and strategy style. MetaTrader 5 uses a Strategy Tester with multi-currency and tick modeling for EA performance, and MetaTrader 4 offers tick-driven backtesting for indicators and Expert Advisors.
Verify multi-timeframe and markup efficiency for your setup style
If repeated analysis cycles depend on fast structure comparison, confirm that the platform supports multi-timeframe layouts and efficient drawing tools. cTrader supports multi-timeframe candlestick layouts with responsive chart customization, while StockCharts supports multi-timeframe views with saved chart templates for repeatable setups.
Decide between terminal-first charting and developer-embedded charting
If the goal is a user-first charting and trading workspace, NinjaTrader, MetaTrader 5, and TradingView keep candlestick analysis close to execution and strategy tooling. If the goal is embedding candlesticks into a custom product or analytics interface, ChartIQ, Highcharts, Chart.js, and Plotly focus on candlestick rendering, interactivity, and configurable chart behavior.
Test the exact features that drive daily decisions
Run a short scenario using the features that matter most to signal review, such as alerts, drawings, and custom studies. TradingView supports watchlists and alerts directly tied to chart views, while Highcharts focuses on candlestick series configuration and interactive tooltips, and Plotly supports Dash-linked callbacks for coordinated candlestick dashboard views.
Who Needs Candlestick Chart Software?
Candlestick chart software fits distinct roles depending on whether the primary output is chart-based trading decisions, automated strategy execution, or embedded analytics visuals.
Chart-first traders who also want automation on candle signals
TradingView fits this segment because Pine Script supports custom indicators plus strategy backtesting directly on candlestick charts. NinjaTrader fits traders who want NinjaScript custom candlestick logic with automated strategies tightly connected to chart-driven workflows.
Traders using MetaTrader Expert Advisors and structured backtesting
MetaTrader 5 is built for candlestick charting plus automated strategy backtesting and its Strategy Tester includes tick modeling for EA performance. MetaTrader 4 serves the same chart-and-execution role with tick-driven backtesting for indicators and Expert Advisors.
Active traders who prioritize order flow workflows alongside candlestick analysis
NinjaTrader fits active traders because it pairs configurable candlestick charts with order management workflows connected to chart views. It also supports custom candlestick indicators and strategy automation through NinjaScript.
Investors who rely on screening and repeatable technical setups
StockCharts fits active investors because it connects candlestick workflows with screening, watchlists, and saved chart templates through SharpCharts. Its indicator presets and timeframe layout controls support recurring technical reviews built around candlestick structure.
Common Mistakes to Avoid
Common selection mistakes come from buying a candlestick tool that mismatches automation depth, customization effort, or chart performance needs.
Overbuying chart automation when only candle-only workflows are needed
TradingView’s Pine Script and automation workflows can feel complex for candle-only tasks, so tools like StockCharts may be a better fit for repeatable chart templates and indicator presets. StockCharts emphasizes saved chart settings and indicator combinations for recurring technical setups rather than heavy automation configuration.
Ignoring the testing model behind strategy backtests
MetaTrader 5 and MetaTrader 4 provide tick modeling in their Strategy Tester paths, so backtest expectations should align with those testing behaviors. Skipping tick-model-aware validation can cause backtests to diverge from execution realities.
Choosing a developer-embedded library without planning for integration effort
ChartIQ, Highcharts, Chart.js, and Plotly require engineering effort to wire data feeds, event handlers, and recurring workflows. Chart.js also lacks a dedicated OHLC candlestick data model, so candlestick rendering often needs custom chart-type or plugin implementation.
Building indicator-heavy layouts that degrade chart performance
MetaTrader 4 can see chart performance degrade with heavy indicator stacks on slower machines, and ChartIQ feature usage depends on correct integration and data feed wiring. Keeping indicator overlays focused helps maintain smooth candle navigation and interaction.
How We Selected and Ranked These Tools
we evaluated every tool on three sub-dimensions with features weighted at 0.4, ease of use weighted at 0.3, and value weighted at 0.3. The overall rating for each tool is the weighted average computed as overall = 0.40 × features + 0.30 × ease of use + 0.30 × value. TradingView separated itself from lower-ranked tools on the features dimension because Pine Script supports custom indicators and strategy backtesting directly on candlestick charts. Tools like Highcharts and Plotly scored strongly for features related to candlestick rendering and interactivity in dashboards, while ChartIQ leaned more heavily toward embeddable chart engine capabilities that favor developer integration over user-first terminal workflows.
Frequently Asked Questions About Candlestick Chart Software
Which candlestick chart platform offers built-in automation for candle-pattern testing?
Which option fits candlestick charting plus real trade execution without switching tools?
Which tools are best for embedding interactive candlestick charts inside a custom web or app interface?
Which platform supports custom candlestick indicators and automated strategies through programming?
Which candlestick chart software is strongest for multi-timeframe pattern review and visual markups?
Which option helps teams coordinate candlestick charts with other analytics in dashboards?
What causes candlestick charts to display inconsistently across platforms, and how can it be mitigated?
Which platform is best for performance when rendering many candlestick charts in a browser?
Which tool is better suited for systematic review workflows with saved indicators and chart templates?
When setting up candlestick charting for analysis versus full trading automation, what difference matters most?
Conclusion
After evaluating 10 data science analytics, TradingView stands out as our overall top pick — it scored highest across our combined criteria of features, ease of use, and value, which is why it sits at #1 in the rankings above.
Use the comparison table and detailed reviews above to validate the fit against your own requirements before committing to a tool.
Tools reviewed
Primary sources checked during evaluation.
Referenced in the comparison table and product reviews above.
Keep exploring
Comparing two specific tools?
Software Alternatives
See head-to-head software comparisons with feature breakdowns, pricing, and our recommendation for each use case.
Explore software alternatives→In this category
Data Science Analytics alternatives
See side-by-side comparisons of data science analytics tools and pick the right one for your stack.
Compare data science analytics tools→FOR SOFTWARE VENDORS
Not on this list? Let’s fix that.
Our best-of pages are how many teams discover and compare tools in this space. If you think your product belongs in this lineup, we’d like to hear from you—we’ll walk you through fit and what an editorial entry looks like.
Apply for a ListingWHAT THIS INCLUDES
Where buyers compare
Readers come to these pages to shortlist software—your product shows up in that moment, not in a random sidebar.
Editorial write-up
We describe your product in our own words and check the facts before anything goes live.
On-page brand presence
You appear in the roundup the same way as other tools we cover: name, positioning, and a clear next step for readers who want to learn more.
Kept up to date
We refresh lists on a regular rhythm so the category page stays useful as products and pricing change.