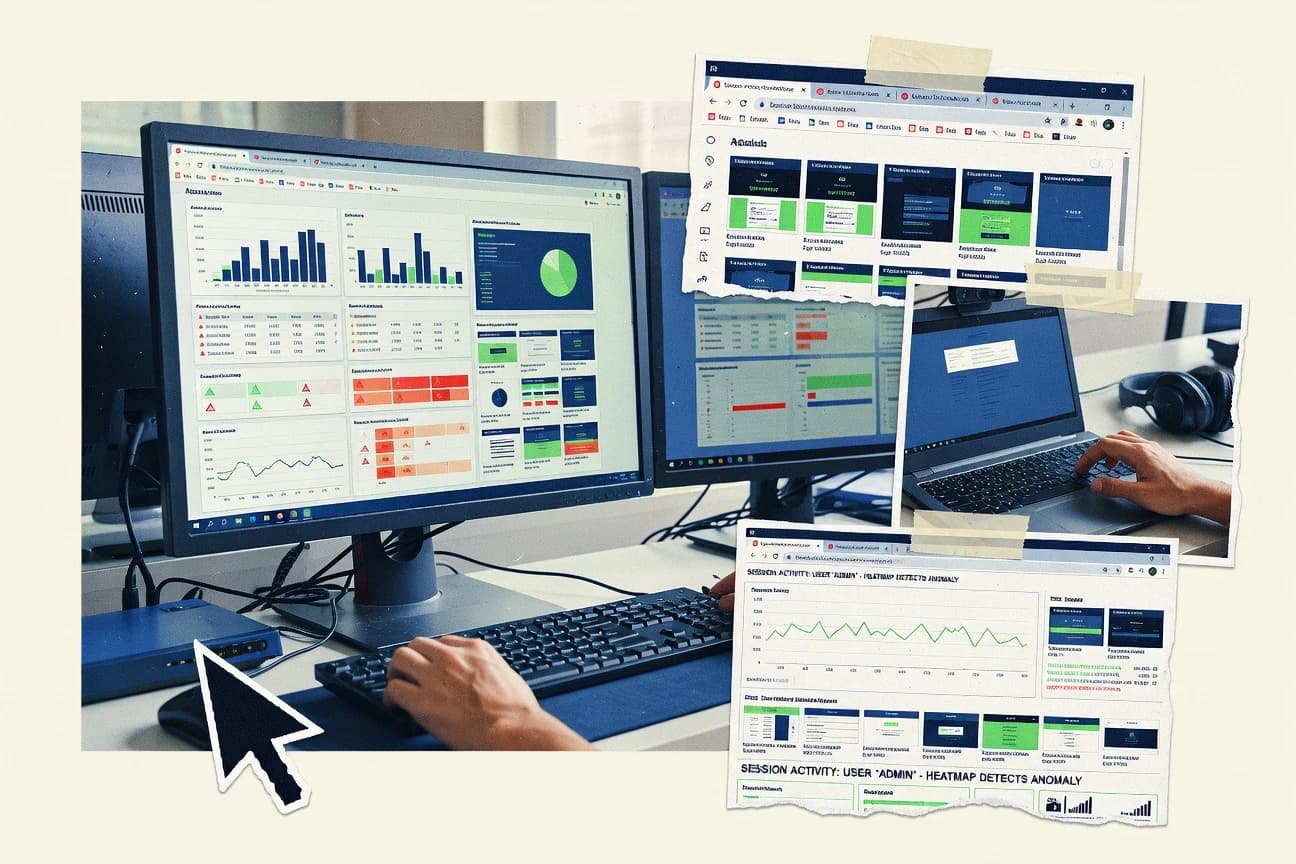
GITNUXSOFTWARE ADVICE
Technology Digital MediaTop 10 Best Browser Monitoring Software of 2026
Explore top browser monitoring tools to track performance, user behavior, enhance health. Compare features and find the best fit for you today.

How we ranked these tools
Core product claims cross-referenced against official documentation, changelogs, and independent technical reviews.
Analyzed video reviews and hundreds of written evaluations to capture real-world user experiences with each tool.
AI persona simulations modeled how different user types would experience each tool across common use cases and workflows.
Final rankings reviewed and approved by our editorial team with authority to override AI-generated scores based on domain expertise.
Score: Features 40% · Ease 30% · Value 30%
Gitnux may earn a commission through links on this page — this does not influence rankings. Editorial policy
Editor’s top 3 picks
Three quick recommendations before you dive into the full comparison below — each one leads on a different dimension.
Grafana Faro
Session Replay context with traces via Grafana Faro and Grafana observability data model
Built for teams standardizing on Grafana for end-to-end performance visibility.
Datadog Browser Monitoring
Editor pickDatadog RUM plus distributed tracing correlation for browser-to-backend root-cause triage
Built for teams already using Datadog that need correlated RUM and synthetic monitoring.
New Relic Browser
Editor pickSession replay with synchronized performance context and user journey details
Built for teams instrumenting browser UX to correlate with backend performance signals.
Related reading
- Technology Digital MediaTop 10 Best Web Browser Tracking Software of 2026
- Technology Digital MediaTop 10 Best Internet Speed Monitoring Software of 2026
- Technology Digital MediaTop 10 Best Cross Browser Testing Software of 2026
- Technology Digital MediaTop 10 Best Network Traffic Monitoring Software of 2026
Comparison Table
This comparison table benchmarks browser monitoring platforms such as Grafana Faro, Datadog Browser Monitoring, New Relic Browser, Dynatrace Browser Monitoring, and Elastic APM Real User Monitoring. It summarizes how each tool collects real user metrics, surfaces frontend performance and errors, and supports alerting and investigation so teams can match capabilities to their observability stack.
Grafana Faro
RUM analyticsClient-side browser real user monitoring that instruments web apps to collect performance metrics, JavaScript errors, and session traces in Grafana.
Session Replay context with traces via Grafana Faro and Grafana observability data model
Grafana Faro distinguishes itself by adding real user monitoring capabilities that integrate directly into the Grafana and Grafana Tempo ecosystem. It captures browser-side performance signals like navigation timing, resource timing, and client-side errors, then routes them into the same visualization and alerting workflows used for backend telemetry.
The solution emphasizes actionable session and trace context so teams can move from dashboards to root-cause investigation. It also supports privacy controls and sampling patterns to reduce unwanted data exposure while still preserving debugging usefulness.
- +Deep integration with Grafana dashboards and alerting workflows
- +Captures navigation, resource, and client error signals for debugging
- +Connects browser events to tracing context for faster root-cause work
- +Privacy controls and sampling reduce sensitive data and noise
- –Value depends on adopting Grafana for visualization and triage
- –More effective when instrumented with consistent tracing conventions
- –Browser monitoring breadth may lag specialized APM suites
Best for: Teams standardizing on Grafana for end-to-end performance visibility
More related reading
Datadog Browser Monitoring
enterprise observabilityBrowser real user monitoring that tracks page load performance, user interactions, and frontend errors with automated diagnostics in Datadog.
Datadog RUM plus distributed tracing correlation for browser-to-backend root-cause triage
Datadog Browser Monitoring stands out by tying real-user browser data into the same Datadog observability model used for infrastructure and application monitoring. It captures page-load and user interaction performance with session context, waterfall breakdowns, and key web vitals style metrics.
The product supports synthetic checks and correlates browser issues with backend services to speed up root-cause analysis. Dashboards and alerting help teams track regressions across releases and geographies.
- +Deep correlation between browser performance and backend services in one observability workflow
- +Actionable performance timelines with waterfall views for page-load bottlenecks
- +Synthetic monitoring and RUM metrics support both proactive and reactive detection
- +Powerful alerting and dashboards for regression tracking and triage
- –Best results require careful tagging, deployment strategy, and signal tuning
- –Setup and ongoing maintenance of instrumentation can be time intensive
- –Advanced visual breakdowns can be noisy without strict filters and baselines
- –Browser-focused analysis still depends on correct backend service mapping
Best for: Teams already using Datadog that need correlated RUM and synthetic monitoring
New Relic Browser
observability suiteBrowser monitoring that captures performance spans, client-side errors, and user journey timing to power frontend insights in New Relic.
Session replay with synchronized performance context and user journey details
New Relic Browser Monitoring focuses on real user monitoring for web experiences, linking client-side performance to backend traces. It provides session replays and performance waterfalls that pinpoint slow resources and rendering delays in the browser.
It also supports synthetic checks for scripted journeys and alerts tied to web vitals and error signals. Data is visualized in the New Relic platform with cross-product correlation to application telemetry.
- +Session replays reveal exact UX failures and timing from real users
- +Performance waterfalls highlight slow requests and client-side bottlenecks
- +Correlates browser signals with backend traces for faster root-cause analysis
- +Synthetic journeys catch regressions before they impact real users
- –Setup and instrumentation require careful configuration of source maps and events
- –High-cardinality custom instrumentation can increase operational complexity
- –Investigations often require switching across multiple New Relic views
- –Large replay volumes can make it harder to triage the most relevant sessions
Best for: Teams instrumenting browser UX to correlate with backend performance signals
Dynatrace Browser Monitoring
end-to-end APMSynthetic and real user browser monitoring that correlates frontend performance and JavaScript errors with backend traces in Dynatrace.
Session replay with performance and error context for real end-user troubleshooting
Dynatrace Browser Monitoring focuses on real user monitoring by capturing end-user sessions in the browser and mapping them to application performance. It provides session replay, JavaScript error visibility, and detailed frontend timing breakdowns such as page load and user flows.
Integration with Dynatrace full-stack observability lets browser signals connect to backend traces and infrastructure context. The result is strong troubleshooting coverage for frontend issues tied to overall service health.
- +Session replay captures user interactions with frontend timing and context
- +JavaScript error tracking highlights failing code paths during real sessions
- +Front-end and backend traces correlate to speed root-cause analysis
- +Dashboards and user journey views support ongoing performance monitoring
- –Browser instrumentation depth increases setup and configuration effort
- –High data volume can add complexity to triage and filtering
- –Deeper workflows often require Dynatrace cross-product knowledge
Best for: Teams needing fast frontend root-cause with session replay and trace correlation
Elastic APM Real User Monitoring
open analyticsBrowser monitoring via Elastic APM that collects frontend transaction traces, performance metrics, and errors into Elasticsearch and Kibana.
Distributed correlation between browser RUM transactions and backend APM traces
Elastic APM Real User Monitoring focuses on collecting browser-side performance and error signals and correlating them with backend traces in Elastic. Core browser monitoring includes RUM event collection, page load timing breakdown, and automatic capture of front-end errors and user impact metrics.
It also supports distributed tracing integration so RUM transactions can be linked to server spans for root-cause analysis across layers. Visual analytics and alerting in the Elastic Observability UI help teams investigate slow experiences and regressions over time.
- +Links RUM browser sessions to backend traces for end-to-end debugging
- +Strong performance and error visibility with actionable timing breakdowns
- +Elastic Observability UI supports slicing impact by user and environment
- +Works well alongside APM data for unified service maps and workflows
- –Requires Elastic stack setup knowledge to instrument and tune correctly
- –RUM configuration can be complex for multi-page and SPA routing cases
- –High event volume can increase ingest and storage pressure without tuning
Best for: Teams using Elastic Observability for cross-layer performance and error root-cause analysis
Sentry
error and performanceFrontend monitoring that captures browser errors, performance spans, and session context to help detect regressions and root causes.
Release tracking with sourcemap-backed stack traces across frontend and backend events
Sentry stands out for correlating browser-side errors with server traces in a single observability workflow. It provides JavaScript source maps, release tracking, and session replay signals alongside real-user monitoring.
Browser performance coverage includes page load timing and custom metrics, with alerting tied to error groups and performance regressions. Deep debugging relies on event grouping, breadcrumbs, and stack trace enrichment to speed triage.
- +Correlates frontend errors with backend performance traces for faster root-cause analysis
- +Source map support improves stack traces and accelerates debugging across releases
- +Session replay and breadcrumbs provide context around user impact
- +Release health views highlight new regressions by version and environment
- –Browser performance insights require careful event instrumentation and dashboards
- –Event volume controls are necessary to avoid noisy error grouping
- –Complex alerting setups can feel heavy for smaller teams
Best for: Teams needing browser error triage with release tracking and trace correlation
Amazon CloudWatch Synthetics
synthetic checksManaged synthetic browser checks that execute scripted journeys and report availability and performance metrics to CloudWatch.
Canaries that capture screenshots and artifacts for failed synthetic browser runs
Amazon CloudWatch Synthetics stands out for browser-based monitoring built on AWS-managed canaries that execute real user journeys in a headless browser. It supports scripted steps, TLS and network checks, and uploads screenshots and artifacts to CloudWatch for troubleshooting.
Monitoring results flow into CloudWatch metrics and alarms, and visual evidence is attached to failures to speed root-cause analysis. The focus stays on availability and functional checks rather than full session replay or deep user analytics.
- +Visual artifacts like screenshots and HAR files accelerate failure diagnosis
- +Scripted canaries run real browser flows with repeatable steps
- +CloudWatch metrics and alarms integrate directly with AWS monitoring
- –Journey scripting adds overhead versus simple URL uptime checks
- –Deep browser debugging beyond artifacts still requires additional tooling
- –Scaling many unique journeys can increase management complexity
Best for: AWS-centric teams needing automated browser availability tests with visual evidence
Google Cloud Monitoring for Web Vitals
performance metricsWeb performance monitoring using client-side instrumentation for metrics like Core Web Vitals and alerting in Google Cloud Monitoring.
Core Web Vitals collection with Cloud Monitoring integration for correlated alerting
Google Cloud Monitoring for Web Vitals centers on RUM-style performance data using Core Web Vitals signals such as LCP, FID, and CLS. It integrates these measurements with Google Cloud Monitoring so teams can correlate web performance trends with other metrics and alerts in the same observability environment.
Setup and data routing depend on using the Google-provided web vitals instrumentation and connecting it to Cloud Monitoring. The solution emphasizes reliability and operational consistency over deep browser-session analytics.
- +Core Web Vitals metrics like LCP, FID, and CLS are first-class measurements
- +Correlates web performance telemetry with Cloud Monitoring metrics and alerting
- +Fits existing Google Cloud observability workflows for teams already on GCP
- –Requires web vitals instrumentation to generate useful browser performance signals
- –Limited session replay and user-level investigation compared with dedicated browser tools
- –Alert tuning can take time due to variability across devices and pages
Best for: Google Cloud teams needing Core Web Vitals monitoring tied to existing alerts
Pingdom Browser Monitoring
synthetic websiteSynthetic monitoring that validates web pages with browser checks and records performance timing and failure details.
Scripted browser journeys that measure step-level performance and assertions
Pingdom Browser Monitoring stands out for turning real browser sessions into repeatable checks that capture how pages load visually. It supports scripted user journeys with steps, assertions, and timing metrics so teams can pinpoint where performance degrades. Monitoring results are organized into session data and reports that complement Pingdom’s broader uptime and performance tooling.
- +Browser-based journeys capture realistic rendering and user flow timing
- +Step-level timing highlights the exact action that causes delays
- +Visual session outputs make regressions easier to understand
- –Journey authoring can feel heavy compared with lightweight monitors
- –Complex workflows need careful step design to avoid brittle checks
- –Action-result reporting may require additional analysis for root cause
Best for: Teams needing browser-session validation for key user flows
Uptrends
synthetic monitoringWebsite and browser-based synthetic monitoring that measures load time and page behavior from multiple locations.
Web transactions with step-by-step browser flow validation and performance timing
Uptrends focuses on browser-based synthetic monitoring that captures real user journeys through scripted and form-driven checks. It supports scheduled tests for websites and web applications, including key page flows, transaction testing, and performance measurements like load timing and page rendering behavior. Alerts and reporting connect monitoring results to actionable diagnostics, which helps teams track issues across time and release cycles.
- +Browser and transaction monitoring for realistic page and workflow validation
- +Detailed performance timings tied to monitored steps and page loads
- +Clear reporting and alerting for trends and incident visibility
- –Building complex flows can take time to set up and maintain
- –Diagnostics can require expertise to translate failures into fixes
- –Monitoring sprawl across many pages increases operational overhead
Best for: Teams needing scripted browser journeys and performance visibility for web apps
Conclusion
After evaluating 10 technology digital media, Grafana Faro stands out as our overall top pick — it scored highest across our combined criteria of features, ease of use, and value, which is why it sits at #1 in the rankings above.
Use the comparison table and detailed reviews above to validate the fit against your own requirements before committing to a tool.
How to Choose the Right Browser Monitoring Software
This buyer's guide explains how to choose browser monitoring software that captures real-user performance signals, frontend errors, and user journey context across platforms. It covers Grafana Faro, Datadog Browser Monitoring, New Relic Browser, Dynatrace Browser Monitoring, Elastic APM Real User Monitoring, Sentry, Amazon CloudWatch Synthetics, Google Cloud Monitoring for Web Vitals, Pingdom Browser Monitoring, and Uptrends. The guidance maps concrete feature capabilities to specific tool strengths so teams can pick the right fit for RUM, session replay, distributed tracing correlation, and scripted synthetic browser journeys.
What Is Browser Monitoring Software?
Browser monitoring software instruments web experiences to measure what users experience in the browser. It captures page load timing, frontend performance signals, and JavaScript errors so teams can detect regressions and locate failing code paths. Many tools also correlate browser sessions with backend traces so debugging moves from symptoms to root cause. Grafana Faro and Datadog Browser Monitoring illustrate this category by collecting browser-side session signals that tie into broader observability workflows for investigation and alerting.
Key Features to Look For
Browser monitoring tools differ most by what evidence they collect, how they connect it to backend systems, and how quickly teams can turn signals into action.
Trace-correlated real-user monitoring for end-to-end debugging
Look for RUM transactions that link browser sessions to backend traces so investigations connect frontend slowness to specific services. Datadog Browser Monitoring correlates browser issues with backend services in one observability workflow, and Elastic APM Real User Monitoring links browser RUM transactions to backend APM traces in Elastic.
Session replay with synchronized performance and context
Prioritize tools that replay user sessions and keep performance context attached so UX failures are diagnosable from real user behavior. New Relic Browser and Dynatrace Browser Monitoring provide session replay tied to performance waterfalls and user journey or frontend error context.
Navigation and resource timing plus frontend error visibility
Browser instrumentation should cover navigation timing and resource timing plus client-side errors so the slowest step is measurable. Grafana Faro captures navigation and resource timing and also records client-side errors, and Sentry supports frontend error monitoring backed by source maps and release health tracking.
Synthetic checks for proactive regression detection
Choose a tool with synthetic monitoring when teams must detect issues before real users report them. Datadog Browser Monitoring supports synthetic checks alongside RUM metrics, and New Relic Browser includes synthetic journeys for scripted monitoring.
Step-level scripted browser journeys and visual failure evidence
For flow validation, select tools that measure step-level timings and produce artifacts that speed diagnosis after failures. Amazon CloudWatch Synthetics runs scripted canary journeys and uploads screenshots and artifacts to CloudWatch, and Uptrends provides web transaction monitoring with step-by-step browser flow validation and performance timing.
Observability-platform-native analytics and alerting integration
Align browser monitoring with an existing observability stack so dashboards, alerts, and triage workflows match existing operations. Grafana Faro integrates into Grafana and Grafana Tempo workflows, and Google Cloud Monitoring for Web Vitals integrates Core Web Vitals telemetry with Google Cloud Monitoring alerts.
How to Choose the Right Browser Monitoring Software
The right selection depends on which evidence matters most: trace-correlated RUM and session replay, Core Web Vitals focused reliability signals, or scripted synthetic journeys with artifacts.
Define the primary troubleshooting path
If root-cause requires connecting browser sessions to backend traces, prioritize tools like Datadog Browser Monitoring or Elastic APM Real User Monitoring because they correlate browser performance to backend services or APM traces. If UX-level failures must be visually replayed with timing context, prioritize New Relic Browser or Dynatrace Browser Monitoring because their session replay includes synchronized performance details and frontend context.
Match your instrumentation depth to your investigation style
Grafana Faro is strong when teams want navigation timing, resource timing, and client error signals routed into Grafana dashboards for debugging and alerting. Sentry fits teams that prioritize JavaScript error triage with sourcemap-backed stack traces, breadcrumbs, and release health so debugging follows error groups and release regressions.
Decide whether synthetic monitoring is a requirement or a supplement
If proactive detection for scripted journeys is required, select Datadog Browser Monitoring, New Relic Browser, or Pingdom Browser Monitoring because each supports browser-based journeys and performance timing with assertions or waterfall diagnostics. If the goal is operationally managed availability checks inside AWS with failure artifacts, Amazon CloudWatch Synthetics provides scripted canaries with screenshots and HAR-like troubleshooting artifacts in CloudWatch.
Align the tool to the analytics and alerting platform already in use
Teams standardizing on Grafana should evaluate Grafana Faro because it instruments web apps and routes browser telemetry into the Grafana visualization and alerting workflow with session and trace context. Teams already operating in Google Cloud should evaluate Google Cloud Monitoring for Web Vitals because it focuses on Core Web Vitals like LCP, FID, and CLS and integrates them into Google Cloud Monitoring alerting.
Validate workflow scalability before committing
Replay and event-heavy setups can add operational complexity, so teams should plan filtering, tagging discipline, and signal tuning with tools like Datadog Browser Monitoring and Dynatrace Browser Monitoring. Teams also need to account for integration effort with Elastic APM Real User Monitoring and Dynatrace Browser Monitoring because both require correct instrumentation and trace correlation to produce useful end-to-end investigations.
Who Needs Browser Monitoring Software?
Browser monitoring software benefits teams that must detect frontend regressions, measure real-user performance, and connect browser behavior to backend impact.
Teams standardizing on Grafana observability for unified frontend and backend triage
Grafana Faro fits because it adds browser real user monitoring into Grafana and Grafana Tempo workflows with navigation timing, resource timing, and client error signals tied to traces. This approach supports session context that speeds root-cause investigation across frontend and distributed backend performance.
Teams using Datadog that need correlated RUM and synthetic monitoring
Datadog Browser Monitoring fits because it ties browser real-user performance and frontend errors into the Datadog observability model with dashboards and alerting for regression tracking. It also adds synthetic checks so teams can validate scripted journeys proactively and correlate issues with backend services.
Teams prioritizing UX debugging through session replay and performance waterfalls
New Relic Browser fits because it provides session replay with synchronized performance context and user journey details. Dynatrace Browser Monitoring fits because it pairs session replay with JavaScript error visibility and detailed frontend timing breakdowns.
AWS-centric teams that need browser availability tests with visual artifacts
Amazon CloudWatch Synthetics fits because it executes scripted journeys in AWS-managed canaries and uploads screenshots and artifacts to CloudWatch when checks fail. This focuses on repeatable availability and functional checks with visual evidence rather than deep user session analytics.
Google Cloud teams that want Core Web Vitals monitoring tied into existing alerting
Google Cloud Monitoring for Web Vitals fits because it collects Core Web Vitals like LCP, FID, and CLS and integrates them into Google Cloud Monitoring alerts. This reduces investigation scope to reliability and performance SLO-style signals rather than full session replay.
Teams that want release-focused frontend error triage with source maps
Sentry fits because it supports JavaScript source maps and release tracking, and it correlates browser errors with server traces in a single workflow. Breadcrumbs and session replay signals help teams reproduce impact context around error groups and regressions.
Common Mistakes to Avoid
Browser monitoring projects commonly fail when signal collection is misaligned with troubleshooting goals or when teams do not manage instrumentation complexity and noise.
Picking session replay without planning for triage volume
Session replay tools can generate large replay volumes, and that increases the difficulty of finding the most relevant sessions. New Relic Browser and Dynatrace Browser Monitoring both provide session replay, so teams must set up filtering and triage workflows early to avoid replay sprawl.
Expecting root cause without enforcing trace correlation conventions
Cross-layer debugging fails when teams do not keep tracing conventions consistent across browser and backend events. Grafana Faro depends on instrumentation patterns that connect session context to tracing workflows, and Datadog Browser Monitoring relies on correct backend service mapping for browser-to-backend correlation.
Using synthetic journey checks without step-level assertions and stable flows
Synthetic journeys become brittle when step design lacks clear assertions or stable selectors, which increases false failures. Pingdom Browser Monitoring uses step-level timing with assertions, and Uptrends provides step-by-step flow validation, so both require careful journey design to keep checks reliable.
Relying only on Core Web Vitals for investigations that require user-level evidence
Core Web Vitals focused monitoring captures reliability metrics but does not replace deep session and UX diagnostics. Google Cloud Monitoring for Web Vitals supports LCP, FID, and CLS, while tools like Dynatrace Browser Monitoring and New Relic Browser deliver session replay and synchronized context for user-level investigation.
How We Selected and Ranked These Tools
We evaluated every tool on three sub-dimensions with explicit weights. Features were weighted at 0.4 because browser monitoring needs evidence quality like session replay, error visibility, and trace correlation. Ease of use was weighted at 0.3 because instrumentation and filtering determine whether teams can operationalize browser signals. Value was weighted at 0.3 because teams need actionable outcomes from dashboards, alerting, and investigation workflows. The overall rating is calculated as overall = 0.40 × features + 0.30 × ease of use + 0.30 × value. Grafana Faro separated from lower-ranked tools by combining deep observability integration with clear session and trace context so browser signals land directly inside Grafana dashboards and alerting workflows for faster investigation.
Frequently Asked Questions About Browser Monitoring Software
Which browser monitoring tools connect browser sessions to backend traces for root-cause analysis?
Which option is best when teams need real user session replay linked to performance timing?
What tool supports browser error triage with release tracking and source maps?
Which browser monitoring solution is strongest for organizations already standardized on a single observability platform?
Which tools target scripted browser journeys rather than deep real user analytics?
How do teams compare real user monitoring approaches when they also run synthetic checks?
Which option is most aligned with Web Vitals monitoring and operational alert correlation in cloud tooling?
What are common integration workflows for connecting browser data to existing observability pipelines?
Which tools emphasize privacy controls or data reduction for browser monitoring collection?
Tools reviewed
Primary sources checked during evaluation.
Referenced in the comparison table and product reviews above.
Keep exploring
Comparing two specific tools?
Software Alternatives
See head-to-head software comparisons with feature breakdowns, pricing, and our recommendation for each use case.
Explore software alternatives→In this category
Technology Digital Media alternatives
See side-by-side comparisons of technology digital media tools and pick the right one for your stack.
Compare technology digital media tools→FOR SOFTWARE VENDORS
Not on this list? Let’s fix that.
Our best-of pages are how many teams discover and compare tools in this space. If you think your product belongs in this lineup, we’d like to hear from you—we’ll walk you through fit and what an editorial entry looks like.
Apply for a ListingWHAT THIS INCLUDES
Where buyers compare
Readers come to these pages to shortlist software—your product shows up in that moment, not in a random sidebar.
Editorial write-up
We describe your product in our own words and check the facts before anything goes live.
On-page brand presence
You appear in the roundup the same way as other tools we cover: name, positioning, and a clear next step for readers who want to learn more.
Kept up to date
We refresh lists on a regular rhythm so the category page stays useful as products and pricing change.