GITNUXSOFTWARE ADVICE
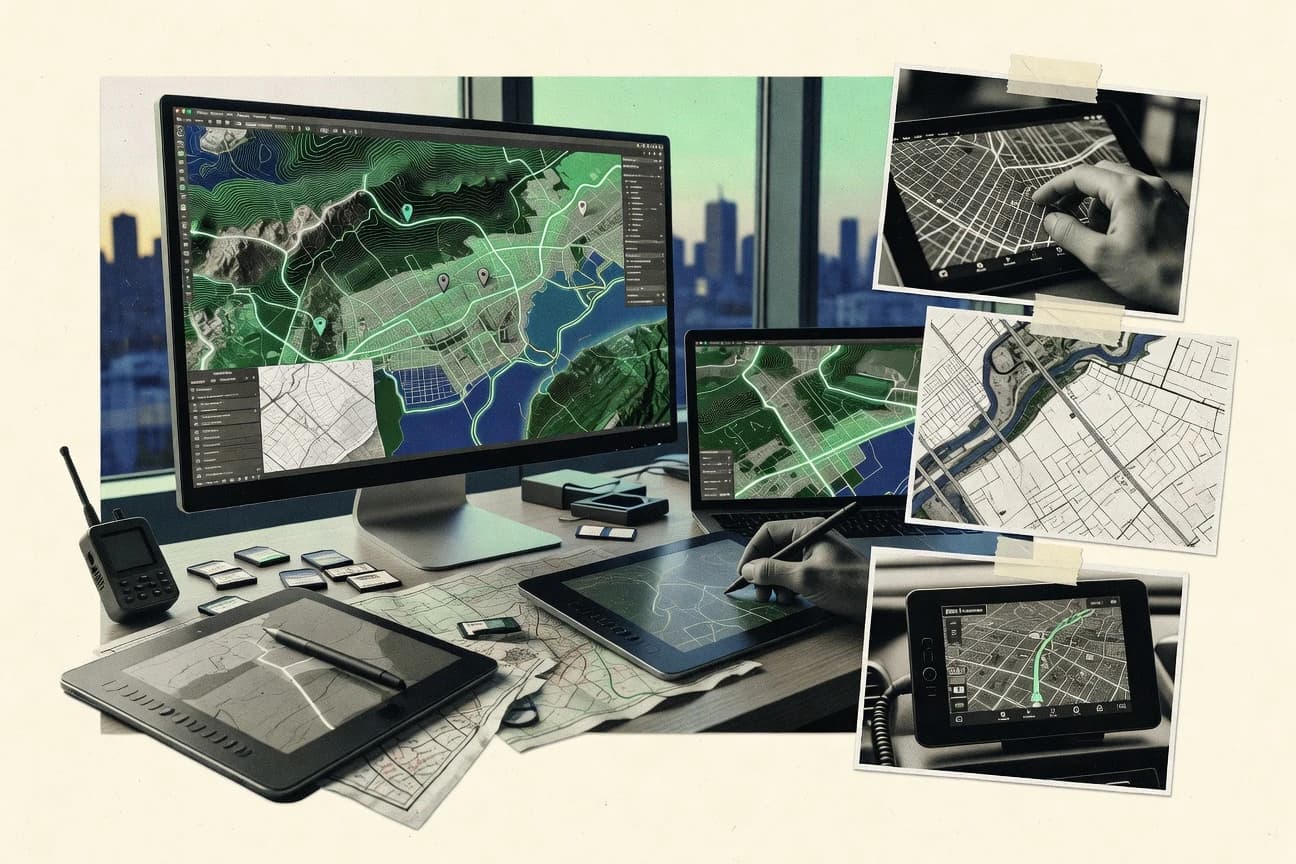
Technology Digital MediaTop 10 Best Computer Mapping Software of 2026
Discover the top 10 best computer mapping software to visualize data effectively.

How we ranked these tools
Core product claims cross-referenced against official documentation, changelogs, and independent technical reviews.
Analyzed video reviews and hundreds of written evaluations to capture real-world user experiences with each tool.
AI persona simulations modeled how different user types would experience each tool across common use cases and workflows.
Final rankings reviewed and approved by our editorial team with authority to override AI-generated scores based on domain expertise.
Score: Features 40% · Ease 30% · Value 30%
Gitnux may earn a commission through links on this page — this does not influence rankings. Editorial policy
Editor’s top 3 picks
Three quick recommendations before you dive into the full comparison below — each one leads on a different dimension.
QGIS
Processing toolbox with model builder and PyQGIS for repeatable geoprocessing automation
Built for geospatial analysts needing powerful GIS mapping, analysis, and extensible workflows.
ArcGIS Online
Editor pickHosted feature layers powering editable web maps with configurable popups and forms
Built for gIS teams building shared web maps and interactive analysis outputs.
Mapbox
Editor pickVector tiles with Mapbox Studio style editing and WebGL rendering
Built for teams building interactive, branded mapping apps with geocoding and routing.
Related reading
Comparison Table
This comparison table evaluates leading computer mapping tools, including QGIS, ArcGIS Online, Mapbox, Google Maps Platform, and Leaflet, to visualize spatial data with different levels of control and workflow depth. It summarizes key differences in data sources, rendering options, customization, and typical use cases so readers can match each platform to mapping needs and team skill sets.
QGIS
desktop GISDesktop GIS software that creates, edits, and visualizes map data layers with symbology, projections, and extensive geoprocessing tools.
Processing toolbox with model builder and PyQGIS for repeatable geoprocessing automation
QGIS stands out for its flexible desktop GIS workflow that blends map creation, spatial analysis, and data management in a single application. It supports vector and raster editing, spatial joins, topology tools, and a wide range of geoprocessing algorithms that run via the Processing toolbox.
Symbology, styling, layout printing, and map export cover both exploratory analysis and publication-quality cartography. Its plugin ecosystem extends capabilities for specialized formats, geocoding, and automation using PyQGIS.
- +Rich Processing toolbox supports many raster and vector geoprocessing workflows
- +Mature symbology engine and print layouts produce publication-ready map exports
- +Plugin architecture and PyQGIS scripting expand functionality beyond core modules
- +Strong data interoperability for common GIS formats and coordinate systems
- +Topology tools and editing tools support rigorous vector dataset maintenance
- –Dense interface can slow onboarding for new users
- –Managing large rasters may require careful performance tuning
- –Some advanced workflows depend on plugins and external dependencies
- –Geoprocessing reproducibility requires discipline with models and parameters
Best for: Geospatial analysts needing powerful GIS mapping, analysis, and extensible workflows
More related reading
ArcGIS Online
web mappingCloud mapping and visualization platform that hosts web maps and apps with feature layers, dashboards, and sharing controls.
Hosted feature layers powering editable web maps with configurable popups and forms
ArcGIS Online stands out for browser-first mapping and sharing, with rapid creation of interactive web maps and web apps from hosted geospatial content. It supports core mapping workflows including data hosting, attribute-driven visualization, geocoding, and web editing with published feature layers.
Strong analysis and visualization come through ArcGIS Living Atlas layers, dashboard and story-style app building, and integration with ArcGIS geoprocessing services. The platform can be powerful for GIS teams, but advanced automation and highly custom workflows often require tight alignment with ArcGIS services and conventions.
- +Browser-first authoring for web maps and web apps with hosted layers
- +Rich visualization options with symbols, popups, and configurable layer styling
- +Built-in collaboration via sharing, groups, and item-based workflows
- +Integrated Living Atlas datasets accelerate baseline mapping and context
- +Supports dashboards, story maps, and configurable application templates
- –Deep customization can require ArcGIS-specific skills and service configuration
- –Complex modeling workflows can be constrained by available hosted tools
- –Data governance across many layers can become operationally heavy
- –Performance depends on published layer design and query patterns
Best for: GIS teams building shared web maps and interactive analysis outputs
Mapbox
API-first mappingAPI-driven mapping platform that renders custom maps and supports geocoding, tiles, and interactive web visualization.
Vector tiles with Mapbox Studio style editing and WebGL rendering
Mapbox stands out for production-grade mapping via customizable web map styling and programmatic geospatial rendering. Core capabilities include vector tile basemaps, SDKs for web and mobile, and geocoding and routing services that integrate into interactive applications.
Mapbox also supports map visualization pipelines and event-driven map interactivity, which suits interactive GIS experiences beyond static cartography. The platform’s flexibility comes with an engineering footprint that can be heavier than traditional desktop GIS tools.
- +Vector tile rendering and styling for high-performance custom map design
- +Solid SDK coverage for web and mobile map interactions
- +Built-in geocoding, routing, and place search for location-based apps
- +Good tooling for generating and managing custom map styles
- –Requires software engineering skills for full control and deployment
- –Less suited for deep desktop GIS analysis compared with GIS-first platforms
- –Complex configuration can slow down initial prototypes
Best for: Teams building interactive, branded mapping apps with geocoding and routing
Google Maps Platform
developer mapsDeveloper mapping stack that powers interactive maps, places, geocoding, and routing used in digital media data visualizations.
Places Autocomplete with session tokens and biasing controls
Google Maps Platform stands out for high-fidelity mapping data and widely adopted developer APIs. It supports building interactive web and mobile map experiences with Places, Geocoding, Directions, and routing via the Maps JavaScript API, along with Maps SDKs.
Advanced capability comes from tools like Geolocation, Street View, and Static Maps for visualization and embedding. Location intelligence can be scaled with Places Autocomplete and server-side search patterns, though complex GIS workflows require external systems.
- +High-accuracy geocoding and reverse geocoding for production-grade location inputs.
- +Robust routing and Directions support for turn-by-turn use cases.
- +Places APIs enable search, autocomplete, and enriched venue details.
- +Street View and Static Maps simplify visual context without custom rendering.
- –GIS analysis features like spatial joins and custom indexing need external tooling.
- –Advanced customization often requires substantial API and data-model design work.
- –Vector styling and offline use cases can be limited compared with dedicated GIS stacks.
Best for: Product teams embedding maps, routing, and location search into apps without full GIS.
Leaflet
open-source web mapsOpen-source JavaScript library that renders interactive maps in browsers and supports custom layers and overlays.
Marker and popup interactivity with layered vectors and event-driven map controls
Leaflet stands out for its lightweight JavaScript library that renders interactive maps in the browser using simple configuration. It supports common visualization needs like tile layers, markers, popups, vector paths, and custom controls.
The ecosystem includes plugins for clustering, drawing, and additional overlays, enabling many mapping workflows without full GIS software overhead. It is best suited for embedding mapping into existing web applications rather than building a standalone geospatial platform.
- +Lightweight core delivers fast map rendering with minimal setup
- +Rich layer model supports tile layers, markers, and vector overlays
- +Large plugin ecosystem expands capabilities like drawing and clustering
- +Works smoothly with standard web stacks and existing UI components
- –Advanced geospatial analysis requires external libraries or services
- –No built-in data pipeline for editing, validation, or attribution management
- –Complex styling and interactions can become code-heavy at scale
Best for: Web teams embedding interactive maps and custom geospatial UI
OpenLayers
open-source web mapsOpen-source JavaScript mapping library that builds interactive, layer-based maps with support for many OGC data sources.
Vector layer styling with feature-level rendering and interactive event handling
OpenLayers stands out as a developer-first mapping library that renders interactive maps in the browser using well-defined map and layer abstractions. Core capabilities include support for many standards-based map services, layer styling, feature interaction, and pan and zoom controls built for customization. It also provides an ecosystem of extensions for common GIS tasks like editing, measurement, and offline-like workflows through caching strategies.
- +Rich layer system with Web map rendering, vector styling, and interaction hooks
- +Strong support for common map service standards like WMS, WMTS, and vector tiles
- +Highly customizable controls for zoom, navigation, overlays, and feature popups
- +Broad community examples for common GIS UI patterns
- –Core is a library, so full applications require engineering and integration
- –Advanced workflows demand deeper GIS and web development knowledge
- –Large datasets can require careful performance tuning and tile strategies
Best for: Teams building custom web maps needing standards support and deep control
Cesium
3D geospatial3D geospatial visualization engine that renders globe and terrain layers for browser-based mapping and spatial storytelling.
Cesium 3D Tiles streaming for large-scale, level-of-detail geospatial visualization
Cesium stands out for rendering high-fidelity 3D geospatial scenes directly in web browsers using a globe-based engine. It supports streamed terrain, imagery, and 3D tiles so large datasets load progressively with spatial indexing. Core capabilities include geospatial visualization, interactive camera controls, and the ability to integrate custom data sources for mapping workflows.
- +High-performance 3D globe rendering with streamed imagery and terrain
- +3D Tiles support enables scalable visualization of city-scale datasets
- +Strong interoperability with common geospatial data pipelines
- –Best results require engineering work for data prep and integration
- –Complex scene setup can slow teams without 3D web development skills
- –Advanced analysis features are limited versus GIS desktop platforms
Best for: Teams building browser-based 3D mapping viewers with streamed geodata
Kepler.gl
WebGL visualizationOpen-source geospatial visualization framework that renders interactive maps and charts from large datasets using WebGL.
Visual layer editor with linked filters and map interactions across multiple layers
Kepler.gl stands out for turning geospatial data into interactive, browser-based dashboards with a visual layer builder. It supports point, line, and polygon visualizations with configurable styling, tooltips, and map interactions.
The tool focuses on exploratory analysis workflows such as filtering, animating, and linking multiple layers. It is especially useful for teams that need fast spatial iteration without building a full custom mapping application.
- +Layer-based visual builder enables quick thematic map creation
- +Rich interactivity includes hover tooltips, selection, and filtering across layers
- +Works well for large exploratory datasets with client-side rendering
- +Supports multiple geometry types with consistent styling controls
- –Exporting polished standalone maps requires extra work beyond interactive viewing
- –Complex multi-layer dashboards can feel harder to maintain over time
- –Advanced customization often needs data restructuring more than scripting
- –Performance can degrade with very large data when styling is heavy
Best for: Analysts creating interactive map dashboards for exploration and reporting workflows
Tableau
data visualizationAnalytics and visualization software that includes mapping views for plotting geographic fields and interactive spatial dashboards.
Geographic roles and map layers that respond to dashboard filters and parameters
Tableau stands out with interactive dashboards that combine geospatial views and drill-down analytics in a single workflow. It supports mapping by geocoding addresses and generating filled and proportional maps tied to data fields.
Visual filters, parameter-driven views, and story-style presentations help turn map exploration into repeatable reporting for stakeholders. Tableau also integrates with spatial data through connectors and can overlay map layers with supplemental fields for contextual analysis.
- +Strong interactive map filtering with drill-down across linked charts
- +Fast geocoding and map creation tied directly to dataset fields
- +Dashboard storytelling with parameters for guided spatial analysis
- +Broad connector ecosystem for ingesting location-aware data
- –Limited advanced GIS operations compared with dedicated mapping platforms
- –Spatial workflows like editing geometries are not the primary focus
- –Performance can degrade with very large or highly detailed geospatial datasets
Best for: Teams creating interactive location analytics dashboards without deep GIS editing
Power BI
BI mappingBusiness intelligence tool that creates map-based visualizations for geographic analysis using built-in map visuals.
Customizable filled and bubble map visuals driven by filters and measures
Power BI stands out with interactive dashboards and a strong data preparation plus analytics workflow. Spatial mapping capabilities are primarily delivered through its geographic visual layer and tight integration with data modeling and transformations.
It supports point, bubble, and filled map style visualization patterns that work best for aggregated location data rather than pixel-accurate cartography. For Computer Mapping Software tasks that need GIS editing, routing, or full GIS tooling, Power BI offers limited native functionality.
- +Interactive maps update automatically as filters and slicers change
- +Strong data modeling and transformation with built-in query and shaping tools
- +Fast dashboard publishing workflow for location-based reporting
- –Limited GIS editing tools for creating and editing map geometry
- –Weaker support for routing, geocoding workflows, and spatial analysis
- –Map visuals focus on aggregation rather than detailed cartographic control
Best for: Teams producing location dashboards from existing datasets
Conclusion
After evaluating 10 technology digital media, QGIS stands out as our overall top pick — it scored highest across our combined criteria of features, ease of use, and value, which is why it sits at #1 in the rankings above.
Use the comparison table and detailed reviews above to validate the fit against your own requirements before committing to a tool.
How to Choose the Right Computer Mapping Software
This buyer’s guide helps teams choose computer mapping software for desktop GIS mapping, browser-first web maps, and embedded geospatial experiences. It covers QGIS, ArcGIS Online, Mapbox, Google Maps Platform, Leaflet, OpenLayers, Cesium, Kepler.gl, Tableau, and Power BI. The guide focuses on fit for workflows like spatial analysis, web app authoring, 3D globe viewing, and map-driven analytics dashboards.
What Is Computer Mapping Software?
Computer mapping software turns geographic data into interactive maps, spatial analysis outputs, and map-based visual dashboards. It solves problems like layering data with correct projections, styling features for interpretation, and building workflows that connect location to attributes. Desktop GIS mapping is represented by QGIS with a Processing toolbox that supports raster and vector geoprocessing plus symbology and layout export. Browser-first mapping and shared web outputs are represented by ArcGIS Online with hosted feature layers that power editable web maps with configurable popups and forms.
Key Features to Look For
These capabilities determine whether a mapping tool can deliver the exact outputs needed for analysis, publication, or embedded applications.
Repeatable geoprocessing automation for spatial workflows
QGIS supports repeatable geoprocessing automation using its Processing toolbox with model builder and PyQGIS scripting. This matters for repeatable spatial analysis runs where consistent parameters and repeatable models must stay aligned across projects.
Hosted feature layers for editable web maps
ArcGIS Online powers editable web maps through hosted feature layers with configurable popups and forms. This matters for teams that need collaboration and field-ready interactivity without building everything from scratch in custom code.
Vector tile rendering and programmatic map styling
Mapbox delivers production-grade vector tile rendering plus Mapbox Studio style editing and WebGL rendering for custom experiences. This matters when brand styling and high-performance web map delivery are core requirements.
Location search and geocoding APIs for production apps
Google Maps Platform provides Places Autocomplete with session tokens and biasing controls plus geocoding and reverse geocoding for location inputs. This matters for product teams that need accurate location search and turn-key integration into app workflows.
Standards-based web mapping with OGC service support
OpenLayers supports map and layer abstractions with direct support for WMS, WMTS, and vector tiles. This matters for teams that must consume standards-based map services while retaining deep control of interactions and rendering.
Interactive exploratory map dashboards for large datasets
Kepler.gl provides a visual layer editor with linked filters and map interactions across multiple layers for exploration. This matters for analysts who need fast iteration with point, line, and polygon visualizations without building a full custom application.
How to Choose the Right Computer Mapping Software
Choosing the right tool depends on the output type needed, the level of GIS analysis versus UI embedding, and the data delivery model required for the workflow.
Match the tool to the required workflow type
Choose QGIS when the workflow requires full desktop GIS mapping plus spatial analysis and rigorous data management with topology and editing tools. Choose ArcGIS Online when the workflow requires browser-first mapping with hosted feature layers that support editable maps with configurable popups and forms. Choose Mapbox or Google Maps Platform when the workflow requires embedded maps with geocoding and interactive app integration rather than desktop GIS editing.
Define the map interactivity and authoring model
Select ArcGIS Online when interactive web maps need dashboard-ready sharing through groups and item-based workflows plus Living Atlas context layers. Select Leaflet or OpenLayers when custom code must control interactivity like feature popups, event handling, and navigation controls. Select Kepler.gl when interactive filtering and linked map interactions are needed for exploratory dashboards built quickly from layers.
Confirm analysis depth versus presentation needs
Pick QGIS for geoprocessing depth with its Processing toolbox plus model builder and PyQGIS automation for repeatable spatial analysis. Pick Tableau or Power BI when the primary need is location-aware analytics dashboards where maps respond to filters and linked views instead of geometry editing. For 3D visualization with streamed datasets, pick Cesium for globe rendering with 3D Tiles streaming and level-of-detail visualization.
Plan how geospatial data will be delivered to users
Use ArcGIS Online when the delivery model is hosted feature layers that can be edited and shared as web maps. Use Mapbox, Leaflet, OpenLayers, or Cesium when the delivery model is browser rendering where client-side performance and styling control are central. Use Kepler.gl when the delivery model is interactive exploration where linked filtering and tooltips drive understanding for multiple geometry types.
Test against realistic dataset and performance constraints
Stress-test large rasters and complex vector editing in QGIS since large raster performance can require careful tuning during onboarding and workflow setup. Validate web map performance in Mapbox and Cesium because complex scene setup in Cesium can slow teams without 3D web development skills. Validate how dashboards scale in Kepler.gl because performance can degrade with very large datasets when styling is heavy.
Who Needs Computer Mapping Software?
Computer mapping software serves distinct audiences based on whether the priority is GIS analysis, web mapping authoring, embedded UI, or location analytics dashboards.
Geospatial analysts who need desktop mapping plus spatial analysis and extensibility
QGIS fits this audience because it combines vector and raster editing, symbology, layout printing, and a Processing toolbox with model builder and PyQGIS scripting. QGIS also supports topology tools and editing tools that support rigorous vector dataset maintenance.
GIS teams that must publish shared interactive web maps
ArcGIS Online fits this audience because hosted feature layers power editable web maps with configurable popups and forms. ArcGIS Online also supports dashboards and story-style app building with Living Atlas layers for baseline mapping context.
Teams building branded interactive mapping apps with geocoding and routing
Mapbox fits this audience because vector tiles and Mapbox Studio style editing plus WebGL rendering support production-grade custom map experiences. Google Maps Platform fits this audience because Places Autocomplete with session tokens and biasing controls plus routing and Directions are built into the developer APIs.
Analysts and business users who want interactive location analytics without deep GIS editing
Tableau fits this audience because geographic roles and map layers respond to dashboard filters and parameters with drill-down across linked charts. Power BI fits this audience because filled and bubble map visuals update automatically from slicers and filters using its data modeling and transformation workflow.
Common Mistakes to Avoid
Frequent selection errors come from mismatching the platform to the required analysis depth, authoring model, or performance expectations.
Choosing a web visualization library when full GIS analysis and repeatable geoprocessing are required
Leaflet and OpenLayers excel at interactive browser mapping but they do not provide desktop-grade geometry editing and deep geoprocessing workflows like QGIS. QGIS avoids this mismatch by offering a Processing toolbox with model builder and PyQGIS automation for repeatable spatial analysis.
Building a custom web map UI without accounting for the engineering integration effort
Mapbox, Leaflet, and OpenLayers require engineering skills for full control of deployment and app integration. ArcGIS Online avoids this mismatch for teams that want browser-first authoring with hosted feature layers and configurable popups.
Relying on a BI mapping tool for pixel-accurate cartography or geometry editing
Power BI focuses on aggregation-driven filled and bubble map visuals and has limited GIS editing tools for creating and editing map geometry. Tableau also emphasizes dashboards and analytics mapping and limits advanced GIS operations compared with dedicated mapping platforms like QGIS.
Underestimating data performance needs in interactive map dashboards
Kepler.gl can experience performance degradation with very large datasets when styling becomes heavy, and complex multi-layer dashboards can become harder to maintain. Cesium can also slow teams during scene setup if 3D web development skills are not available, even though it streams terrain and 3D Tiles.
How We Selected and Ranked These Tools
we evaluated every tool on three sub-dimensions that match buyers’ tradeoffs: features with weight 0.4, ease of use with weight 0.3, and value with weight 0.3. The overall rating is computed as overall = 0.40 × features + 0.30 × ease of use + 0.30 × value. QGIS separated from lower-ranked tools by combining a strong features profile with automation that supports repeatable geoprocessing through the Processing toolbox with model builder and PyQGIS scripting. That automation improves execution consistency for spatial analysis projects, which directly improves the practical features score tied to real mapping workflows.
Frequently Asked Questions About Computer Mapping Software
Which tool works best for desktop GIS editing plus spatial analysis in one application?
What’s the fastest path to publish interactive web maps and dashboards for a team?
Which option is best for building a custom branded map application with routing and geocoding?
When should a team choose Leaflet instead of OpenLayers or Mapbox for a web map?
Which tool is best for 3D browser-based visualization at scale?
How do teams handle interactive spatial exploration without building a custom application?
What’s the best choice for generating map views as part of BI workflows instead of GIS editing?
Which tools support automation and repeatable geoprocessing workflows?
What common technical issue happens during map integration, and how do these tools address it?
Tools reviewed
Primary sources checked during evaluation.
Referenced in the comparison table and product reviews above.
Keep exploring
Comparing two specific tools?
Software Alternatives
See head-to-head software comparisons with feature breakdowns, pricing, and our recommendation for each use case.
Explore software alternatives→In this category
Technology Digital Media alternatives
See side-by-side comparisons of technology digital media tools and pick the right one for your stack.
Compare technology digital media tools→FOR SOFTWARE VENDORS
Not on this list? Let’s fix that.
Our best-of pages are how many teams discover and compare tools in this space. If you think your product belongs in this lineup, we’d like to hear from you—we’ll walk you through fit and what an editorial entry looks like.
Apply for a ListingWHAT THIS INCLUDES
Where buyers compare
Readers come to these pages to shortlist software—your product shows up in that moment, not in a random sidebar.
Editorial write-up
We describe your product in our own words and check the facts before anything goes live.
On-page brand presence
You appear in the roundup the same way as other tools we cover: name, positioning, and a clear next step for readers who want to learn more.
Kept up to date
We refresh lists on a regular rhythm so the category page stays useful as products and pricing change.