GITNUXSOFTWARE ADVICE
Telecommunications ConnectivityTop 10 Best Bandwidth Testing Software of 2026
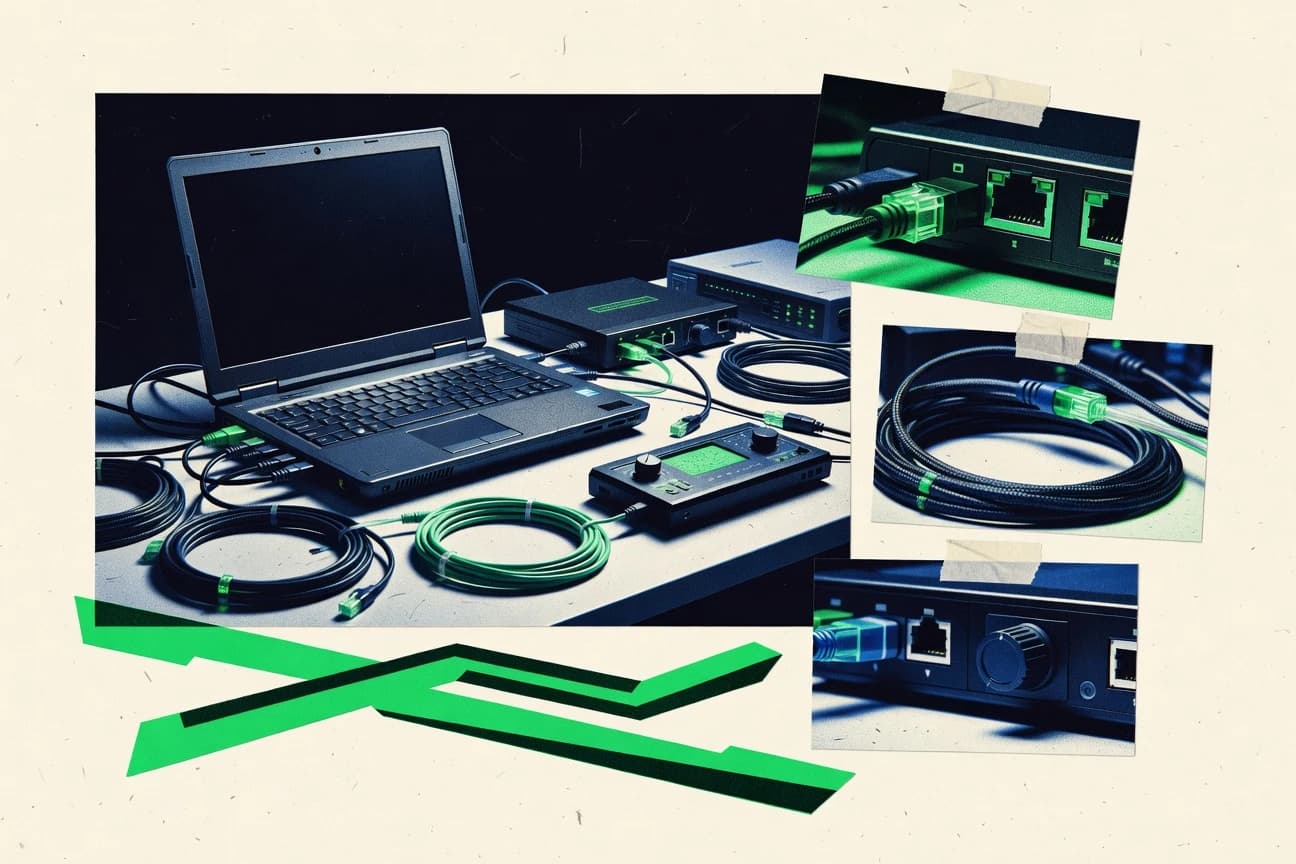
Top 10 Bandwidth Testing Software ranked with comparisons for network testing, covering iperf3, Speedtest by Ookla, and Fast.com.

How we ranked these tools
Core product claims cross-referenced against official documentation, changelogs, and independent technical reviews.
Analyzed video reviews and hundreds of written evaluations to capture real-world user experiences with each tool.
AI persona simulations modeled how different user types would experience each tool across common use cases and workflows.
Final rankings reviewed and approved by our editorial team with authority to override AI-generated scores based on domain expertise.
Score: Features 40% · Ease 30% · Value 30%
Gitnux may earn a commission through links on this page — this does not influence rankings. Editorial policy
Editor’s top 3 picks
Three quick recommendations before you dive into the full comparison below — each one leads on a different dimension.
iperf3
Parallel streams with per-interval reporting and UDP jitter and loss metrics
Built for network engineers running repeatable throughput tests for troubleshooting and capacity checks.
Speedtest by Ookla
Editor pickSpeedtest app results with server-based latency, download, and upload metrics
Built for iT and support teams validating internet performance quickly across locations.
Fast.com
Editor pickInstant download-speed test with a no-friction interface
Built for quick checks of home and office internet throughput before troubleshooting.
Related reading
Comparison Table
This comparison table evaluates bandwidth testing tools by integration depth, data model, automation and API surface, and admin governance controls like RBAC and audit logging. It maps how tools such as iperf3, Speedtest, and Fast.com expose configuration and provisioning paths, and how they structure throughput and measurement results for repeatable automation and extensibility.
iperf3
open-sourceiperf3 generates TCP and UDP traffic to measure throughput, jitter, and packet loss for network bandwidth validation.
Parallel streams with per-interval reporting and UDP jitter and loss metrics
iperf3 is distinct for using a simple client-server design to measure network throughput with minimal overhead. It supports TCP, UDP, parallel streams, and bidirectional testing to capture multiple performance dimensions beyond raw speed.
Detailed reporting includes per-interval throughput plus packet loss, jitter, and retransmits for UDP and TCP sessions. Strong scripting potential via standard command-line options makes repeatable measurements practical for lab and operational workflows.
- +Fast client-server throughput tests with low measurement overhead
- +Supports TCP and UDP with packet loss and jitter reporting
- +Parallel streams and reverse mode enable realistic load patterns
- –Command-line only workflow requires manual orchestration
- –Traffic generation can disturb shared networks during testing
Network engineers in operations
Validate WAN throughput after link changes
Faster change verification
Lab test and QA teams
Benchmark router and firewall performance
Repeatable performance baselines
Show 2 more scenarios
VoIP and real-time service teams
Assess jitter and loss for UDP
Lower call quality risks
Measure UDP jitter and packet loss to judge suitability for time-sensitive media traffic.
Site reliability engineers
Detect degraded network paths in production
Earlier outage mitigation
Schedule scripted iperf3 runs to spot retransmits and throughput drops across critical links.
Best for: Network engineers running repeatable throughput tests for troubleshooting and capacity checks
More related reading
Speedtest by Ookla
consumer-gradeSpeedtest runs client-server throughput tests to estimate broadband and mobile connection performance metrics.
Speedtest app results with server-based latency, download, and upload metrics
Speedtest by Ookla stands out for its global measurement network and simple browser or mobile tests that quickly estimate latency, download, and upload performance. It supports history-style tracking through shared results pages and optional app-based dashboards for repeated measurements.
Its strongest capability is consistent, user-friendly bandwidth testing that works across consumer ISPs and enterprise network links. The tool is less suited for deep diagnostics like sustained throughput profiling or custom traffic shaping tests.
- +Quick latency, download, and upload measurements with consistent methodology
- +Large server selection supports testing from many geographies
- +Shareable result pages make comparisons easy across time and locations
- +App and browser options cover mobile and desktop testing workflows
- –Limited advanced controls for custom test duration or repeat patterns
- –Focuses on single-session metrics instead of long-run throughput behavior
- –Less direct visibility into jitter, packet loss, and path characteristics
Home users and remote workers
Check ISP latency before video calls
Faster call setup troubleshooting
IT helpdesks and NOC teams
Compare link performance across sites
Clear before-after performance evidence
Show 2 more scenarios
Network performance analysts
Baseline consumer broadband throughput
Reliable bandwidth baseline
Collects download and upload snapshots to track service consistency over time.
Field technicians and consultants
Verify last-mile issues on-site
Reduced repeat site visits
Performs on-demand mobile or browser tests to confirm whether issues are access-related.
Best for: IT and support teams validating internet performance quickly across locations
Fast.com
download-focusedFast.com performs simplified bandwidth tests to measure download speed using a streamlined browser experience.
Instant download-speed test with a no-friction interface
Fast.com provides a bandwidth testing flow using a browser-based client that focuses on real-time download throughput. It returns results without requiring sign-in, which supports quick checks during ISP troubleshooting and internal network verification. The interface can also include latency and upload testing options while keeping the workflow centered on speed measurement.
A key tradeoff is limited depth for advanced diagnostics since Fast.com emphasizes bandwidth figures over detailed protocol-level reporting. This makes it less suitable when packet loss analysis, jitter breakdown, or route tracing are required. Fast.com fits best for rapid validation after modem changes, Wi-Fi upgrades, or scheduled maintenance windows where fast confirmation matters.
- +Runs entirely in a browser with one-click testing flow
- +Shows download speed immediately with real-time updates
- +Supports latency and upload testing from the same interface
- –Limited diagnostics beyond throughput, latency, and upload results
- –No advanced controls for test endpoints, durations, or concurrency
- –Browser conditions can influence accuracy for deeper network analysis
Network technicians
Validate ISP speed after modem swap
Fewer truck rolls needed
Helpdesk agents
Check bandwidth during ticket triage
Faster ticket resolution
Show 2 more scenarios
IT operations teams
Verify site links after maintenance
Reduced rollback risk
They compare test results before and after changes to confirm throughput targets.
Remote workers
Diagnose slow video call complaints
Clearer support escalation
They measure download and latency to decide if the problem is local or ISP-related.
Best for: Quick checks of home and office internet throughput before troubleshooting
More related reading
NDT7
standardizedNDT7 conducts standardized network performance tests to measure throughput and latency using Google-operated infrastructure.
NDT7 protocol-specific bandwidth tests with structured performance reporting
NDT7 stands out for running Google Cloud-based Network Diagnostic Tool tests that cover throughput, latency, and path characteristics from controllable test points. The core workflow focuses on automated bandwidth measurements and structured reports that separate TCP and UDP performance. It also supports running tests with different protocols and packet sizes so results map more directly to application traffic patterns.
- +Cloud-based NDT testing produces consistent throughput and latency metrics
- +Protocol-specific tests capture TCP behavior and UDP performance separately
- +Structured reports make it easier to compare runs and isolate regressions
- –Setup requires comfort with cloud networking and endpoint selection
- –Interpretation still depends on understanding network test outputs
- –Less suited for one-off troubleshooting on local consumer networks
Best for: Teams benchmarking cloud paths and validating bandwidth changes across endpoints
Wireshark
packet-analysisWireshark captures live traffic and computes effective throughput and performance indicators to diagnose bandwidth issues.
Capture statistics with protocol and endpoint breakdown via display filters
Wireshark stands out for turning raw network traffic into inspectable packet-level evidence with extensive protocol decoders. It supports bandwidth testing by capturing traffic, then using display filters and statistics to quantify throughput, packet rates, and traffic distribution across protocols and endpoints. Its capability set includes TCP stream reconstruction and exportable analysis outputs for repeatable troubleshooting and measurement baselines.
- +Deep protocol dissection enables precise bandwidth attribution by traffic type
- +Built-in capture statistics show packet rates and throughput without extra tooling
- +Display filters and stream reassembly speed targeted bandwidth diagnostics
- +Exportable captures support audits and repeatable measurement workflows
- –Bandwidth testing requires manual measurement steps using captures
- –Large captures can slow analysis and increase memory usage
- –Setup and filter authoring demand strong networking familiarity
Best for: Network teams needing packet-level bandwidth measurement and protocol attribution
NetSpeedMonitor
real-time-monitoringNetSpeedMonitor measures real-time upload and download rates per host and helps identify bandwidth saturation.
Continuous speed testing with historical tracking of download and upload results
NetSpeedMonitor focuses on continuous network bandwidth testing with ongoing speed results shown in a dedicated interface. It tracks download and upload performance over time and supports running tests without manual restarts. The tool emphasizes monitoring behavior and visibility for connection stability rather than one-off speed checks.
- +Continuous download and upload testing for ongoing connection visibility
- +Time-based monitoring helps identify speed dips and instability patterns
- +Lightweight interface designed around repeated bandwidth measurements
- –Limited advanced analytics compared with dedicated network observability tools
- –Fewer visualization and reporting options for large-scale teams
- –Setup and configuration can be less straightforward than basic speed testers
Best for: Users needing ongoing bandwidth monitoring for stability and trend checks
More related reading
NetFlow Analyzer
flow-analyticsManageEngine NetFlow Analyzer analyzes flow records to quantify traffic volumes and bandwidth usage by application and host.
Top talkers and applications reporting from NetFlow data with bandwidth utilization breakdown
NetFlow Analyzer from ManageEngine stands out with a NetFlow-first design that turns router and firewall traffic telemetry into drill-down bandwidth views. It supports bandwidth reporting by interface, application, and top talkers so network teams can isolate where throughput and latency pressures originate. Built-in reports and alerting help measure changes over time and notify operators when usage deviates from expected patterns.
- +NetFlow-driven bandwidth analytics with interface-level drilldowns
- +Top talkers and application visibility support actionable bottleneck hunting
- +Time-series reports and threshold alerts for trend tracking
- –Accuracy depends on exporters supporting NetFlow or IPFIX collection
- –Dashboards require tuning to match specific bandwidth reporting needs
- –Capacity planning is more involved with high-flow environments
Best for: Network teams analyzing bandwidth hotspots using NetFlow traffic telemetry
PRTG Network Monitor
monitoringPRTG uses sensors for bandwidth and traffic monitoring to alert on network saturation and performance degradation.
Sensor library that combines interface bandwidth metrics with active network performance probes
PRTG Network Monitor stands out for turning bandwidth testing into continuous network monitoring with device and interface sensors. It can track bandwidth use via SNMP and interface counters, and it supports active measurements such as latency and round-trip time to help explain throughput changes. The platform pairs these checks with alerting, dashboards, and reporting so bandwidth issues can be investigated over time rather than tested once.
- +Bandwidth monitoring via SNMP interface counters across many devices
- +Active performance sensors help correlate throughput dips with latency changes
- +Dashboards, reports, and alerting support ongoing bandwidth investigations
- –Initial sensor and device setup can be time-consuming
- –Bandwidth testing depth is weaker than dedicated throughput testing tools
- –Alert noise can increase without careful threshold tuning
Best for: IT teams needing ongoing bandwidth visibility with alerting and historical reporting
More related reading
cFos Personal Net
traffic-optimizationcFos Personal Net shapes and optimizes traffic and includes monitoring to manage perceived bandwidth performance on endpoints.
Bandwidth test results feeding QoS traffic shaping to prioritize latency-sensitive applications
cFos Personal Net stands out by bundling bandwidth shaping and QoS with built-in throughput testing. It measures connection performance from the client side and then uses that data to optimize how traffic is prioritized. The tool targets real-world latency and responsiveness problems, not only raw download and upload speed numbers.
- +Integrates bandwidth testing with QoS tuning for immediate network optimization
- +Traffic prioritization helps reduce latency during competing application streams
- +Local control of shaping and rules supports use on constrained links
- +Multiple test runs support validation of changes across conditions
- –Setup and rule tuning require more networking knowledge than speed tests
- –UI can feel technical for users focused only on quick benchmark numbers
- –Less suitable for comparing public internet routes since results are device-scoped
Best for: Home or small-office users optimizing latency-sensitive traffic after testing
ntopng
flow-visualizationntopng visualizes network traffic flows to calculate bandwidth usage and support capacity planning and troubleshooting.
Flow-centric bandwidth and top-talkers dashboards with interface-level utilization metrics
ntopng stands out because it combines network traffic visibility with active performance monitoring using flow-based telemetry. It provides bandwidth and throughput insights by analyzing packets and exporting flow statistics for hosts, interfaces, and networks.
The solution focuses on measurement and troubleshooting signals like latency, packet loss indicators, and traffic composition alongside top talkers and utilization views. It is best suited to continuous monitoring of links and endpoints rather than generating standardized synthetic throughput tests.
- +Flow-based monitoring delivers bandwidth breakdown across interfaces and hosts
- +Real-time dashboards speed up link utilization and top-talkers analysis
- +Supports alerts for threshold-driven bandwidth and traffic anomalies
- –Active bandwidth testing across paths is limited versus dedicated test tools
- –Configuration and tuning of sensors and exporters require network expertise
- –Interpretation depends on flow availability and traffic visibility accuracy
Best for: Teams monitoring real network throughput for troubleshooting and capacity planning
Conclusion
After evaluating 10 telecommunications connectivity, iperf3 stands out as our overall top pick — it scored highest across our combined criteria of features, ease of use, and value, which is why it sits at #1 in the rankings above.
Use the comparison table and detailed reviews above to validate the fit against your own requirements before committing to a tool.
How to Choose the Right Bandwidth Testing Software
This buyer's guide covers iperf3, Speedtest by Ookla, Fast.com, NDT7, Wireshark, NetSpeedMonitor, NetFlow Analyzer, PRTG Network Monitor, cFos Personal Net, and ntopng for bandwidth testing and related throughput validation.
The guide explains how each tool models throughput, latency, jitter, and packet loss, and how that maps to integration needs like automation and API surface. It also compares where each tool fits for ongoing monitoring versus repeatable synthetic testing using concrete capabilities from each product.
Bandwidth testing tools that generate traffic, measure throughput, and expose performance telemetry
Bandwidth testing software measures effective throughput and related path behavior like latency, jitter, and packet loss using synthetic traffic generators or telemetry analysis. iperf3 measures TCP and UDP throughput with per-interval results plus UDP jitter and loss using a simple client-server design.
Speedtest by Ookla and Fast.com focus on quick client-server checks that return download, upload, and latency style metrics with limited protocol-level detail. Teams then use Wireshark for packet-level evidence and NetFlow Analyzer or ntopng for flow-based bandwidth breakdowns tied to real traffic.
Evaluation criteria for throughput validation, protocol insight, and automation control
The tool choice hinges on the measurement method because throughput accuracy depends on the traffic model and what the tool reports per run. iperf3 publishes per-interval throughput plus UDP jitter and loss, while Wireshark produces packet-level protocol attribution via display filters and capture statistics.
Operational control matters next because repeatability requires scripting, automation, and governance controls like RBAC and audit visibility when multiple operators share test results. Where those controls are thin, tools like Speedtest by Ookla and Fast.com still work for fast checks but limit deep diagnostics like sustained throughput profiling.
Protocol-specific throughput reporting with UDP jitter and packet loss metrics
iperf3 separates TCP and UDP behavior and reports throughput plus UDP jitter and packet loss and TCP session retransmits. NDT7 provides protocol-specific TCP and UDP tests with structured reports that compare runs and isolate regressions.
Parallel streams and reverse-mode traffic patterns for realistic load
iperf3 supports parallel streams and reverse mode so throughput can reflect multiple concurrent sessions and bidirectional load patterns. This matters when single-stream tests miss contention effects that appear under concurrency.
Automation-ready measurement workflows versus manual capture analysis
iperf3 is command-line driven with standard options that support repeatable lab and operational workflows. Wireshark supports repeatable investigation through exportable captures and display-filtered capture statistics, but it requires manual steps to capture traffic and then compute throughput from statistics.
Integration depth via an automation surface and data export paths
iperf3 fits integration scenarios where external systems need to drive tests because it is structured around standard command-line options that scripting can wrap. Wireshark supports exportable analysis outputs, which supports integrating packet evidence into audit workflows.
Structured test reports and run-to-run comparison support
NDT7 generates structured performance outputs for throughput and latency and separates TCP and UDP results for clearer run comparison. NetFlow Analyzer provides time-series reports with threshold alerts so bandwidth shifts over time can be reviewed against expected baselines.
Governed operations for ongoing bandwidth visibility and alerts
PRTG Network Monitor pairs SNMP interface counter-based bandwidth metrics with active latency and round-trip performance probes and then wraps those checks in dashboards and alerting. NetSpeedMonitor provides continuous upload and download testing with historical tracking, which supports stability trending rather than one-off throughput checks.
Decision framework for selecting the right bandwidth testing approach
Start by matching the measurement goal to the traffic model and reporting style. iperf3 is the fit when the workflow needs repeatable TCP and UDP throughput validation with jitter and packet loss plus parallel streams and reverse mode.
Then map operations requirements to the data model, automation surface, and governance expectations. Tools like Speedtest by Ookla and Fast.com meet quick validation needs, while Wireshark, NetFlow Analyzer, and ntopng address deeper attribution through packets or flows.
Select the measurement method that matches the failure you are diagnosing
Choose iperf3 when the goal is sustained throughput validation with TCP and UDP split reporting that includes UDP jitter and loss and TCP retransmits. Choose Wireshark when the goal is packet-level proof and protocol attribution using display filters and capture statistics.
Pick the reporting granularity needed for the decisions being made
Choose NDT7 when structured reports are needed that separate TCP and UDP and support mapping packet sizes and protocols to application traffic patterns. Choose Speedtest by Ookla or Fast.com when the decision is limited to quick latency and bandwidth figures with minimal operational friction.
Use concurrency and directionality only when the real workload includes it
Choose iperf3 for parallel streams and reverse-mode tests when throughput contention or bidirectional constraints are part of the issue. Avoid treating a single-session speed check from Speedtest by Ookla or Fast.com as a substitute for concurrency testing when multiple streams compete.
Decide between synthetic testing and telemetry-driven bandwidth attribution
Choose NetFlow Analyzer or ntopng when the goal is bandwidth breakdown from real traffic using interface, host, top talkers, and application views. Choose NetFlow Analyzer when NetFlow exporters already feed flow records, and choose ntopng when flow-based monitoring and capacity planning dashboards are the operating model.
Plan for ongoing monitoring and alerting if issues are intermittent
Choose PRTG Network Monitor when SNMP interface counters need ongoing bandwidth visibility and active latency and round-trip sensors need to explain throughput dips. Choose NetSpeedMonitor when continuous download and upload testing with historical tracking is the primary requirement.
Which bandwidth testing workflow fits which tool
Different tools align to different operational roles because they use different measurement models and different output types. The best fit depends on whether the workflow needs synthetic throughput tests, packet evidence, or flow-based telemetry.
Speed and ease of use matter for quick validation, while protocol-specific reporting and repeatability matter for capacity checks and troubleshooting.
Network engineers running repeatable throughput validation and capacity checks
iperf3 fits because it supports TCP and UDP tests with per-interval throughput plus UDP jitter and packet loss and parallel streams and reverse mode. NDT7 fits when cloud-path benchmarking requires protocol-specific structured reports.
IT and support teams validating internet performance quickly across locations
Speedtest by Ookla fits because it runs consistent client-server latency, download, and upload tests with large server selection and shareable results. Fast.com fits when a no-friction browser flow is needed for immediate download speed confirmation with optional latency and upload testing.
Network teams needing protocol-level attribution to explain throughput problems
Wireshark fits because it turns captured traffic into inspectable packet-level evidence and computes throughput and performance indicators with protocol decoders and capture statistics. This is the right tool when the decision requires evidence by protocol and endpoint.
Network teams analyzing bandwidth hotspots from real traffic telemetry
NetFlow Analyzer fits when NetFlow or IPFIX collection already exists because it provides interface-level drilldowns plus top talkers and application visibility with time-series reports and threshold alerts. ntopng fits when flow-based dashboards and capacity planning depend on continuous traffic visibility with alerts and utilization views.
Operators who need continuous visibility and alerting tied to saturation and latency changes
PRTG Network Monitor fits because its sensor library combines SNMP interface bandwidth counters with active latency and round-trip probes and then produces dashboards and alerting. NetSpeedMonitor fits when continuous upload and download testing with historical tracking is the main goal for stability trend checks.
Bandwidth testing mistakes caused by mismatched method, reporting depth, and operation model
Common selection errors happen when a tool's output style is assumed to cover a different troubleshooting need. Quick speed testers report single-session bandwidth figures and limited diagnostics, which can mislead decisions when sustained throughput behavior or loss and jitter patterns are required.
Another recurring issue is choosing a capture or flow tool when the workflow needs synthetic, repeatable traffic generation with explicit protocol control.
Treating Speedtest by Ookla or Fast.com as a substitute for loss and jitter diagnostics
Speedtest by Ookla focuses on latency, download, and upload metrics and does not provide direct deep visibility into jitter, packet loss, or sustained throughput behavior. Fast.com emphasizes download throughput with limited advanced diagnostics, so iperf3 is the right tool when UDP jitter and packet loss need to be measured.
Using a single-stream benchmark when the workload includes concurrency and bidirectional traffic
Speedtest by Ookla and Fast.com run a simple single-session style check, which can hide contention effects. iperf3 supports parallel streams and reverse mode, so it should be used when multiple streams or bidirectional constraints drive performance.
Choosing Wireshark for automated throughput runs without planning for capture-driven workflows
Wireshark requires manual capture and analysis steps using display filters and then computing results from capture statistics, which slows fully automated throughput testing. iperf3 provides command-line driven traffic generation with per-interval reporting, which fits automation better.
Assuming NetFlow Analyzer or ntopng can generate synthetic throughput tests across endpoints
NetFlow Analyzer and ntopng are flow-based monitoring tools that quantify bandwidth from existing traffic telemetry and focus on top talkers and interface utilization. They should not be expected to replicate synthetic path tests the way NDT7 or iperf3 can when controlled endpoints and protocol-specific testing are required.
Skipping continuous monitoring for intermittent saturation issues
iperf3 and NDT7 are structured for repeatable test runs and controlled measurements, not continuous dashboards and alerting. PRTG Network Monitor and NetSpeedMonitor provide ongoing speed or sensor-based bandwidth visibility with history and alerting signals that fit intermittent problems.
How We Selected and Ranked These Tools
We evaluated iperf3, Speedtest by Ookla, Fast.com, NDT7, Wireshark, NetSpeedMonitor, NetFlow Analyzer, PRTG Network Monitor, cFos Personal Net, and ntopng using criteria-based scoring centered on features, ease of use, and value. Features carried the most weight at forty percent, while ease of use and value each accounted for thirty percent so repeatability and reporting depth drive the ranking. This editorial ranking reflects only the capabilities and constraints described in the provided tool profiles, not private benchmarks or hands-on lab trials.
iperf3 set the pace because it delivers parallel streams with per-interval reporting plus UDP jitter and packet loss metrics while also supporting TCP throughput validation with low measurement overhead. That combination raised its features score and ease-of-use fit for engineers who need repeatable command-driven throughput measurements.
Frequently Asked Questions About Bandwidth Testing Software
Which tool is best for repeatable throughput tests with packet-loss and jitter metrics?
When should teams choose Speedtest by Ookla or Fast.com for bandwidth validation?
What is the main difference between synthetic throughput testing and NetFlow or ntopng monitoring?
Which tool supports deeper protocol-level inspection after a bandwidth issue is detected?
How do NDT7 and iperf3 differ for automated benchmarking across endpoints?
Which option is best for continuous bandwidth trend monitoring with historical results?
How do NetFlow Analyzer and PRTG Network Monitor approach bandwidth observability for troubleshooting?
Which tool is most relevant when bandwidth testing must feed QoS or traffic prioritization?
What common workflow issues occur when combining bandwidth testing with automation, and how do tools differ?
Tools reviewed
Primary sources checked during evaluation.
Referenced in the comparison table and product reviews above.
Keep exploring
Comparing two specific tools?
Software Alternatives
See head-to-head software comparisons with feature breakdowns, pricing, and our recommendation for each use case.
Explore software alternatives→In this category
Telecommunications Connectivity alternatives
See side-by-side comparisons of telecommunications connectivity tools and pick the right one for your stack.
Compare telecommunications connectivity tools→FOR SOFTWARE VENDORS
Not on this list? Let’s fix that.
Our best-of pages are how many teams discover and compare tools in this space. If you think your product belongs in this lineup, we’d like to hear from you—we’ll walk you through fit and what an editorial entry looks like.
Apply for a ListingWHAT THIS INCLUDES
Where buyers compare
Readers come to these pages to shortlist software—your product shows up in that moment, not in a random sidebar.
Editorial write-up
We describe your product in our own words and check the facts before anything goes live.
On-page brand presence
You appear in the roundup the same way as other tools we cover: name, positioning, and a clear next step for readers who want to learn more.
Kept up to date
We refresh lists on a regular rhythm so the category page stays useful as products and pricing change.