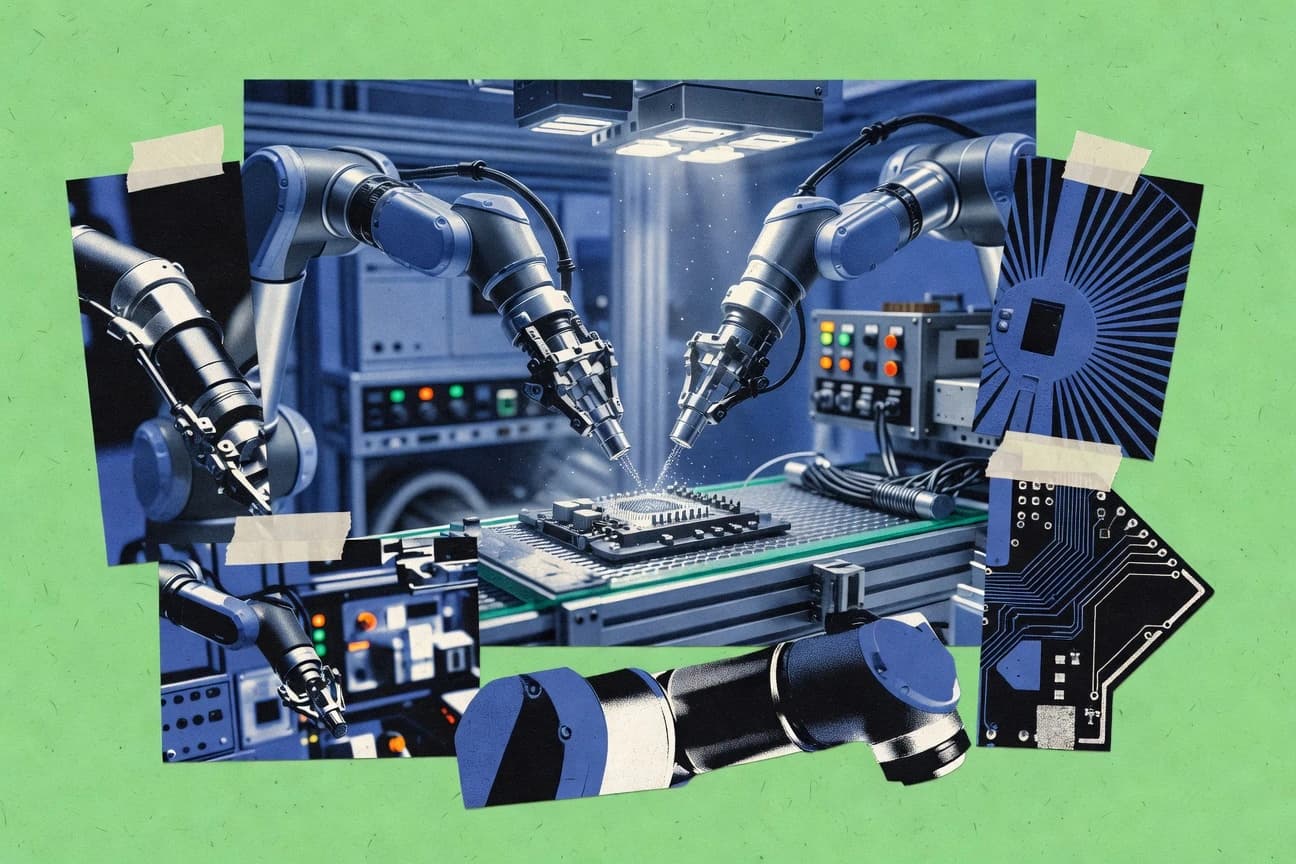

Industrial automation robots are reshaping production and service operations across manufacturing hubs, with the biggest take-up concentrated in Asia and particularly China, while automotive and electrical/electronics lead deployments. In factory environments, AI-powered quality control and machine-vision capabilities are improving output consistency, alongside steadily rising productivity for adopting firms and improving returns on investment over a typical 2–3 year payback. The technology is also changing workforce and skill needs, contributing to net job growth while shifting roles, and broadening beyond factories through faster adoption of connected (5G) and healthcare-oriented AI diagnostics and increasingly capable cobots.
Key Takeaways
- Robots reduced manufacturing defects by 30% via AI quality control.
- ROI on industrial robots averages 2-3 years payback period.
- Automation created 1.6 million net new jobs in manufacturing since 2010.
- Automotive industry in China uses 40% of all industrial robots installed there in 2022.
- Electrical/electronics sector accounts for 33% of global robot installations in 2022.
- Metal & machinery industry represents 15% of worldwide robot uptake in 2022.
- Global industrial robot installations reached 553,052 units in 2022, marking a 5% increase from 2021.
- The service robots market is projected to grow from USD 22.40 billion in 2023 to USD 64.35 billion by 2028 at a CAGR of 23.5%.
- Industrial robotics market revenue worldwide is forecasted to reach $28.6 billion by 2026.
- Asia holds 70% share of global industrial robot installations as of 2022.
- China accounted for 52% of worldwide industrial robot installations in 2022 with 290,000 units.
- Japan installed 46,000 industrial robots in 2022, down 1% from prior year.
- AI integration in robots for healthcare diagnostics rose 28% in 2023.
- Machine vision systems in robots grew to 45% adoption rate in 2023.
- 5G-enabled robots deployments increased 50% in factories by 2023.
Related reading
01 · Category
Economic And Workforce Impact22 stats
01
Robots reduced manufacturing defects by 30% via AI quality control.
02
ROI on industrial robots averages 2-3 years payback period.
03
Automation created 1.6 million net new jobs in manufacturing since 2010.
04
Robots boost labor productivity by 0.37% annually in adopting firms.
05
Cobot adoption in SMEs increased output by 25% without extra hires.
06
Global robotics industry employs over 2.7 million people directly in 2023.
07
Robot density correlates with 16% higher manufacturing wages.
08
Automation saved $1.2 trillion in manufacturing costs globally 2017-2022.
09
85% of companies report positive ROI from robot investments within 24 months.
10
Robots reskilled 40% of workforce into higher-value tasks like programming.
11
US manufacturing output grew 2.5% annually with robot integration.
12
Robot use reduced workplace injuries by 70% in high-risk sectors.
13
Automation contributed $3.7 trillion to global GDP by 2025 projection.
14
Firms with high robot use saw 14% labor cost savings.
15
Robot training programs upskilled 1 million workers in EU since 2020.
16
Productivity gains from robots averaged $5/hour per worker.
17
62% of executives plan robot expansion to cut costs by 20%.
18
Robot-enabled supply chains reduced downtime by 50%.
19
Women in robotics workforce grew 25% to 28% representation 2023.
20
Robot maintenance jobs demand rose 35% since 2020.
21
Automation offset 20% of projected job losses in routine tasks.
22
Robot investments yielded 15-20% annual returns in automotive.
02 · Category
Industry Applications27 stats
01
Automotive industry in China uses 40% of all industrial robots installed there in 2022.
02
Electrical/electronics sector accounts for 33% of global robot installations in 2022.
03
Metal & machinery industry represents 15% of worldwide robot uptake in 2022.
04
Automotive sector globally installed 123,000 robots in 2022, 22% of total.
05
Food & beverage industry robot installations grew 10% to 26,000 units in 2022.
06
Plastics & chemicals sector saw 12% increase to 22,000 robot installations 2022.
07
70% of industrial robots are used in welding applications worldwide.
08
Material handling robots account for 38% of all industrial robot installations globally.
09
Assembly robots make up 10% of global industrial robot deployments.
10
Healthcare robots, particularly surgical, installed 2,200 units in professional service category 2022.
11
Logistics & warehousing robots saw 48,000 installations in 2022, up 30%.
12
Agriculture robots installations reached 22,000 units in 2022, growth 25%.
13
Cleaning robots for professional use deployed 86,000 units in 2022.
14
Medical service robots increased 22% to 158,000 total stock in 2022.
15
Retail robots installations up 15% to 4,500 units in 2022.
16
Construction robots market sees heavy use in demolition, 20% of applications.
17
Pharmaceutical industry uses 8% of robots for packaging and handling.
18
Electronics manufacturing employs 25% of cobots for precision assembly.
19
Food processing robots handle 15% of palletizing tasks globally.
20
Automotive painting robots constitute 30% of all painting applications.
21
Logistics robots in e-commerce warehouses grew 40% in deployment 2022.
22
Inspection robots in oil & gas sector increased 18% usage in 2022.
23
Welding robots dominate metal fabrication at 50% market share.
24
Dispensing robots used in 12% of adhesive applications in electronics.
25
Humanoid robots in entertainment and hospitality trials reached 500 units 2023.
26
Agricultural harvesting robots adoption up 35% in Japan and US 2022.
27
Cobots in SMEs account for 25% of new installations in small businesses.
03 · Category
Market Growth30 stats
01
Global industrial robot installations reached 553,052 units in 2022, marking a 5% increase from 2021.
02
The service robots market is projected to grow from USD 22.40 billion in 2023 to USD 64.35 billion by 2028 at a CAGR of 23.5%.
03
Industrial robotics market revenue worldwide is forecasted to reach $28.6 billion by 2026.
04
Annual robot installations in Asia hit 397,000 units in 2022, representing 72% of global total.
05
The collaborative robot (cobot) market is expected to expand at a CAGR of 31.6% from 2023 to 2030.
06
Global humanoid robot market size was valued at USD 1.55 billion in 2022 and projected to grow to USD 38 billion by 2035.
07
Robot density in South Korea reached 1,012 robots per 10,000 employees in manufacturing in 2022.
08
The automation software market for robotics is anticipated to grow from $2.5 billion in 2022 to $10.1 billion by 2030.
09
Worldwide robot sales revenue grew by 14% to $16.5 billion in 2023.
10
Mobile robotics market valued at $22.6 billion in 2023, expected to reach $85.1 billion by 2032 at CAGR 15.9%.
11
Industrial robot market in China grew 6% to 290,000 units installed in 2022.
12
Service robot installations worldwide increased by 17% to 158,000 units in 2022.
13
The global warehouse automation market size was $21.19 billion in 2022, projected to $49.8 billion by 2030.
14
Robot-as-a-Service (RaaS) market expected to grow from $0.78 billion in 2023 to $3.61 billion by 2030 at CAGR 21.2%.
15
Annual operational stock of industrial robots worldwide surpassed 3.9 million units in 2022.
16
The AI-powered robotics market is projected to reach $64.35 billion by 2031, growing at 32.4% CAGR.
17
Cobot installations worldwide rose 22% to 40,328 units in 2022.
18
Global exoskeleton market size estimated at $417.3 million in 2023, to reach $1.34 billion by 2028.
19
Surgical robotics market valued at $7.8 billion in 2023, expected to grow to $17.5 billion by 2028 at CAGR 17.5%.
20
Robot density in Singapore achieved 730 units per 10,000 manufacturing employees in 2022.
21
The logistics robots market is set to grow from $10.3 billion in 2023 to $23.5 billion by 2028.
22
Global industrial robot market CAGR projected at 13.3% from 2023 to 2030.
23
Professional service robots market revenue reached $12.2 billion in 2022.
24
Agricultural robotics market valued at $13.5 billion in 2023, forecasted to $74.2 billion by 2032.
25
Robot installations in the Americas increased 5% to 61,000 units in 2022.
26
Europe robot installations grew 4% to 95,000 units in 2022.
27
The inspection robots market is expected to grow from $1.2 billion in 2023 to $2.8 billion by 2030.
28
Global swarm robotics market projected to reach $3.2 billion by 2030 at 38% CAGR.
29
Microfactory robotics market anticipated to grow at 25% CAGR through 2028.
30
Underwater robotics market size was $3.8 billion in 2022, to hit $11.4 billion by 2030.
More related reading
04 · Category
Regional Insights26 stats
01
Asia holds 70% share of global industrial robot installations as of 2022.
02
China accounted for 52% of worldwide industrial robot installations in 2022 with 290,000 units.
03
Japan installed 46,000 industrial robots in 2022, down 1% from prior year.
04
United States robot installations reached 39,000 units in 2022, up 10%.
05
Germany led Europe with 29,000 robot installations in 2022, growth of 8%.
06
South Korea's robot installations totaled 37,000 units in 2022, up 6%.
07
Robot density in Germany stands at 415 per 10,000 manufacturing employees in 2022.
08
China's robot market share grew to 52% of global installations by 2022.
09
Europe represents 18% of global robot installations with 95,000 units in 2022.
10
Americas account for 11% of world robot installations at 61,000 units in 2022.
11
Japan holds the second-highest robot density globally at 397 per 10,000 employees.
12
Robot installations in India surged 28% to 6,300 units in 2022.
13
Taiwan installed 9,000 robots in 2022, up 20%.
14
Robot density in the US reached 285 per 10,000 manufacturing workers in 2022.
15
ASEAN countries saw 28% growth in robot installations to 33,000 units in 2022.
16
Italy installed 11,000 robots in 2022, increase of 9%.
17
Robot density in China is 392 per 10,000 employees in manufacturing sector 2022.
18
UK robot installations grew 10% to 2,800 units in 2022.
19
France saw 12% rise in installations to 5,700 units in 2022.
20
Robot density in France at 157 per 10,000 manufacturing employees 2022.
21
Spain increased robot installations by 16% to 3,900 units in 2022.
22
Mexico's robot installations up 17% to 5,400 units in 2022.
23
Robot density in Mexico reached 30 per 10,000 employees in 2022.
24
Canada installed 2,300 robots in 2022, growth of 12%.
25
Vietnam robot installations jumped 60% to 800 units in 2022.
26
Robot density in Vietnam estimated at 12 per 10,000 manufacturing workers 2022.
05 · Category
Technological Trends23 stats
01
AI integration in robots for healthcare diagnostics rose 28% in 2023.
02
Machine vision systems in robots grew to 45% adoption rate in 2023.
03
5G-enabled robots deployments increased 50% in factories by 2023.
04
Cobots with force-torque sensors now standard in 80% of new models.
05
AI algorithms improved robot path planning efficiency by 40% in 2022 studies.
06
Digital twins used in 35% of robot simulation for manufacturing 2023.
07
Swarm robotics algorithms tested in 15% more pilots in logistics 2023.
08
Soft robotics materials adoption up 25% for grippers in handling.
09
Edge AI chips in robots reduced latency by 60% in real-time tasks.
10
Natural language processing in service robots reached 20% integration.
11
Battery life in mobile robots extended 30% with new lithium-sulfur tech.
12
Haptic feedback in teleoperated robots improved precision by 25%.
13
Quantum sensors for robot navigation in GPS-denied environments prototyped 2023.
14
Generative AI for robot learning accelerated training by 50% in sims.
15
Modular robot designs allow 40% faster reconfiguration in factories.
16
SLAM technology accuracy in robots improved to 99% in dynamic envs.
17
Neuromorphic computing chips cut robot power use by 90% in vision.
18
Multi-modal sensors fusion in cobots boosted safety ratings 35%.
19
Blockchain for robot fleet data security implemented in 10% enterprises.
20
Bio-inspired locomotion in legged robots achieved 2x terrain adaptability.
21
Cloud robotics latency dropped to under 10ms with 6G trials.
22
Self-healing robot skins prototyped for 50% longer operational life.
23
Federated learning in robot swarms enhanced privacy-preserving collab.
report visual · Key figures
Automation Robots Industry Statistics statistics snapshot
Selected headline statistics from verified sources for a stable visual baseline.
30%
Robots reduced manufacturing defects by 30% via AI quality control.
2
ROI on industrial robots averages 2-3 years payback period.
1.6
Automation created 1.6 million net new jobs in manufacturing since 2010.
0.37%
Robots boost labor productivity by 0.37% annually in adopting firms.
25%
Cobot adoption in SMEs increased output by 25% without extra hires.
2.7
Global robotics industry employs over 2.7 million people directly in 2023.
Reference
Cite This Report
This report is designed to be cited. We maintain stable URLs and versioned verification dates. Copy the format appropriate for your publication below.
APA
Marcus Engström. (2026, February 13). Automation Robots Industry Statistics. Gitnux. https://gitnux.org/automation-robots-industry-statistics
MLA
Marcus Engström. "Automation Robots Industry Statistics." Gitnux, 13 Feb 2026, https://gitnux.org/automation-robots-industry-statistics.
Chicago
Marcus Engström. 2026. "Automation Robots Industry Statistics." Gitnux. https://gitnux.org/automation-robots-industry-statistics.
Sources & references
54 datasets cited across this report