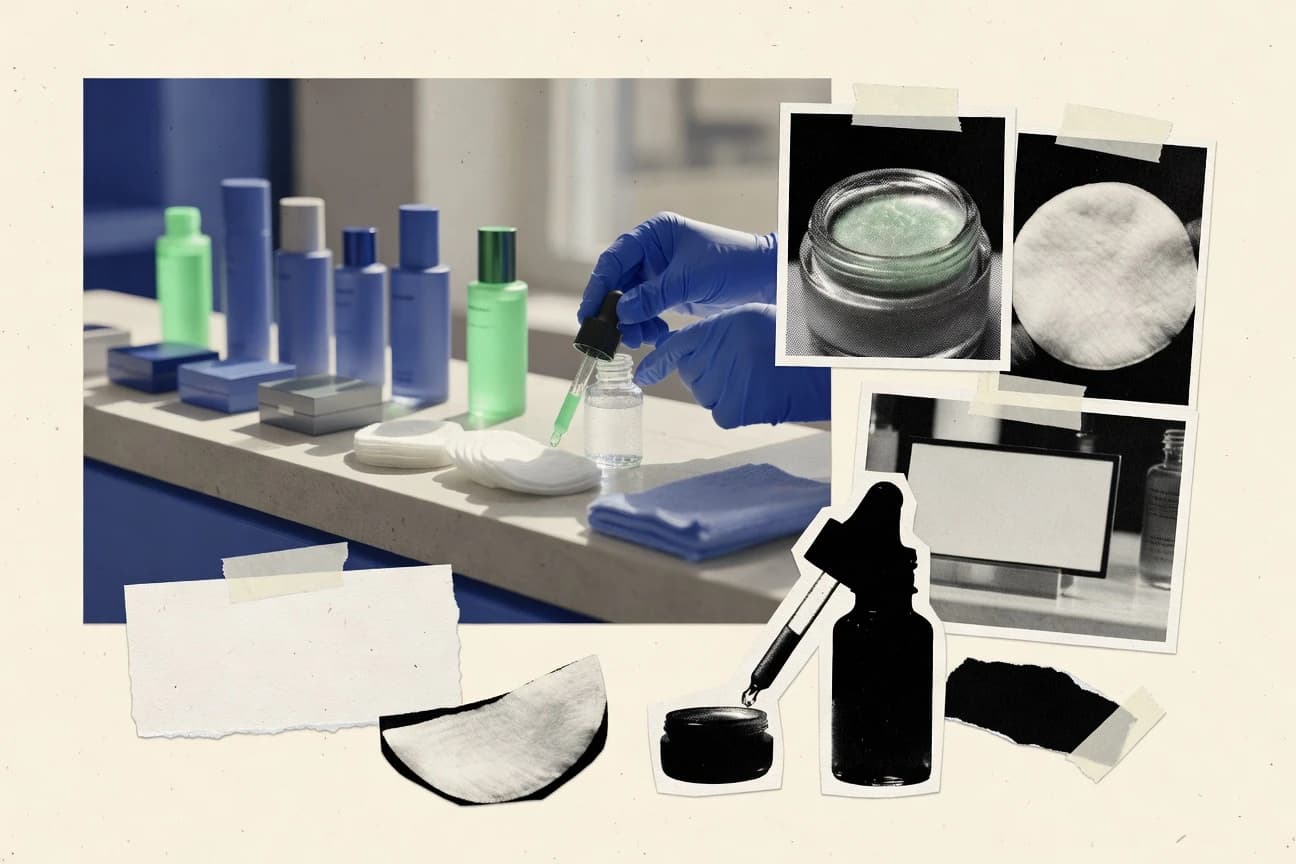

This page explores how Asia’s beauty industry is shifting by category, consumer preference, and channel. In 2023, skincare leads across Asia-Pacific with 62% of beauty sales, and Chinese shoppers increasingly favor natural, ingredient-based products. Routine habits also diverge: South Korea’s Gen Z use facial masks weekly, while Japan sees growing demand for clinically proven anti-aging. We connect these trends to country market sizes and growth outlooks across the region.
Key Takeaways
- In 2023, 68% of Asian women aged 18-35 prioritize skincare over makeup in their beauty routines.
- 72% of Chinese consumers prefer natural ingredient-based beauty products, up from 55% in 2020.
- In South Korea, 85% of Gen Z consumers use facial masks weekly as part of their skincare regimen.
- E-commerce accounts for 45% of beauty sales in China in 2023.
- Tmall and JD.com combined 60% of online beauty sales in Asia.
- South Korea online beauty market USD 7.5 billion, 50% total sales.
- L'Oréal holds 15% market share in Asia-Pacific beauty market in 2023.
- Shiseido Group revenue from Asia (ex-Japan) USD 4.2 billion in 2023.
- Amorepacific (Laneige, Innisfree) K-beauty sales USD 3.5 billion globally, 70% Asia.
- The Asia-Pacific beauty and personal care market was valued at USD 142.8 billion in 2022 and is projected to reach USD 217.5 billion by 2030, growing at a CAGR of 5.5% from 2023 to 2030.
- China's beauty market generated USD 88 billion in revenue in 2023, accounting for over 40% of the total Asia-Pacific beauty market share.
- The Japanese cosmetics market size stood at JPY 1.8 trillion (approximately USD 12.5 billion) in fiscal year 2023, with a 2.5% year-on-year growth.
- Skincare products account for 62% of total beauty sales in Asia-Pacific in 2023.
- Color cosmetics segment in China grew 15% to USD 12 billion in 2023.
- Facial masks in South Korea represent 20% of skincare market, USD 2.8 billion.
Skincare is surging across Asia as natural and online shopping reshape beauty preferences in 2023.
Related reading
01 · Category
Consumer Trends22 stats
01
In 2023, 68% of Asian women aged 18-35 prioritize skincare over makeup in their beauty routines.
02
72% of Chinese consumers prefer natural ingredient-based beauty products, up from 55% in 2020.
03
In South Korea, 85% of Gen Z consumers use facial masks weekly as part of their skincare regimen.
04
61% of Japanese women over 40 seek anti-aging products with proven clinical efficacy.
05
Indian consumers show 45% increase in demand for Ayurvedic beauty products since 2021.
06
78% of Southeast Asian millennials are influenced by social media influencers for beauty purchases.
07
Vietnam beauty consumers aged 25-34 account for 42% of total market spend.
08
55% of Thai women prefer vegan beauty products, highest in ASEAN region.
09
In China, 92% of beauty buyers research products online before purchase.
10
67% of Malaysian consumers prioritize halal-certified cosmetics.
11
Philippines Gen Z (40% of population) spends 30% more on beauty than previous generations.
12
74% of Singaporean consumers seek personalized beauty recommendations via apps.
13
South Korean men represent 25% of total beauty market consumers in 2023.
14
81% of Indonesian women use whitening products daily.
15
Taiwan consumers aged 18-24 increased K-pop inspired makeup usage by 35% in 2023.
16
69% of Asian consumers post-2020 prefer sustainable packaging in beauty products.
17
In India, 52% of urban women over 30 focus on hair care for beauty.
18
Hong Kong luxury beauty consumers (high-income) grew 18% in spending power.
19
76% of Vietnamese Gen Z discover beauty products via TikTok.
20
Japan sees 48% of consumers shifting to clean beauty due to health concerns.
21
83% of Chinese middle-class women invest in premium skincare monthly.
22
Thailand's beauty tourists (medical/beauty) number 2.5 million annually, 60% female.
Interpretation
Consumer Trends Interpretation
Across Asia beauty consumer trends, shoppers increasingly favor skincare tailored to specific needs, with 68% of women aged 18 to 35 prioritizing skincare over makeup and 72% of Chinese consumers turning to natural ingredient based products.
02 · Category
E Commerce And Distribution20 stats
01
E-commerce accounts for 45% of beauty sales in China in 2023.
02
Tmall and JD.com combined 60% of online beauty sales in Asia.
03
South Korea online beauty market USD 7.5 billion, 50% total sales.
04
India's Nykaa platform beauty GMV INR 50 billion in FY2023.
05
Shopee Southeast Asia beauty sales USD 5 billion annually.
06
Lazada beauty category growth 25% YoY to USD 2.8 billion.
07
55% of Japanese beauty purchases via Rakuten and Amazon Japan.
08
Vietnam Tiki and Shopee beauty sales USD 1.2 billion.
09
Thailand beauty live-streaming sales on TikTok Shop THB 10 billion.
10
Alibaba's Taobao beauty live commerce USD 20 billion GMV 2023.
11
38% of Singapore beauty market online, led by Sephora.sg.
12
Indonesia Tokopedia beauty sellers 1.5 million, sales USD 3 billion.
13
Philippines Lazada beauty flash sales contribute 30% revenue.
14
Malaysia beauty apps downloads 15 million in 2023.
15
Taiwan Momo online beauty USD 2.1 billion.
16
Hong Kong ZALORA beauty sales HKD 1.5 billion.
17
Duty-free beauty sales at Asian airports USD 8 billion pre-COVID recovery to 90%.
18
Cross-border e-commerce beauty imports to Asia USD 25 billion.
19
K-beauty platforms like Olive Young app 10 million users.
20
India Flipkart beauty sales INR 30 billion.
Interpretation
E Commerce And Distribution Interpretation
Asia’s beauty commerce is heavily concentrated in online channels, with e commerce making up 45% of China’s beauty sales in 2023 and Tmall plus JD accounting for 60% of online beauty sales across Asia.
03 · Category
Major Players19 stats
01
L'Oréal holds 15% market share in Asia-Pacific beauty market in 2023.
02
Shiseido Group revenue from Asia (ex-Japan) USD 4.2 billion in 2023.
03
Amorepacific (Laneige, Innisfree) K-beauty sales USD 3.5 billion globally, 70% Asia.
04
Unilever Asia beauty brands (Pond's, Lakme) USD 6 billion revenue.
05
Procter & Gamble skincare (Olay, SK-II) 12% Asia market share.
06
Estée Lauder Asia sales USD 5.8 billion, 45% of global revenue.
07
Beiersdorf (Nivea) Southeast Asia revenue USD 1.8 billion.
08
LG H&B (The Face Shop) market share 8% in K-beauty.
09
Colgate-Palmolive oral care beauty crossover USD 2.1 billion Asia.
10
Johnson & Johnson skincare Asia USD 3.4 billion.
11
Kao Corporation Japan beauty revenue JPY 800 billion.
12
Henkel (Schwarzkopf) hair care Asia 10% share.
13
Coty Inc. Asia fragrances USD 1.2 billion.
14
Hindustan Unilever India beauty sales INR 200 billion.
15
Rohto Pharmaceutical eye care Asia USD 1.5 billion.
16
Fancl no-additive skincare Japan leader, USD 1 billion sales.
17
Oriflame direct sales Asia USD 900 million.
18
Mary Kay Asia direct selling USD 2.3 billion.
19
Perfect Diary China digital brand USD 1.7 billion GMV.
Interpretation
Major Players Interpretation
Major players are aggressively shaping Asia beauty with both scale and dominance, from L’Oréal’s 15% Asia Pacific market share in 2023 and P&G’s 12% skincare share to Estée Lauder generating USD 5.8 billion from Asia which is 45% of its global revenue.
More related reading
04 · Category
Market Size And Growth30 stats
01
The Asia-Pacific beauty and personal care market was valued at USD 142.8 billion in 2022 and is projected to reach USD 217.5 billion by 2030, growing at a CAGR of 5.5% from 2023 to 2030.
02
China's beauty market generated USD 88 billion in revenue in 2023, accounting for over 40% of the total Asia-Pacific beauty market share.
03
The Japanese cosmetics market size stood at JPY 1.8 trillion (approximately USD 12.5 billion) in fiscal year 2023, with a 2.5% year-on-year growth.
04
South Korea's beauty industry reached KRW 18.5 trillion (USD 14.2 billion) in 2023, driven by K-beauty exports.
05
India's beauty and personal care market is expected to grow from USD 28 billion in 2023 to USD 48 billion by 2028 at a CAGR of 11.3%.
06
Southeast Asia's beauty market was valued at USD 35 billion in 2023, with Indonesia contributing USD 9 billion.
07
The Asia-Pacific skincare market size was USD 81.5 billion in 2023 and is forecasted to grow to USD 131.7 billion by 2032 at CAGR 5.5%.
08
Vietnam's cosmetics market grew by 15% YoY to USD 2.8 billion in 2023.
09
Thailand beauty market revenue hit THB 250 billion (USD 7.2 billion) in 2023, up 8% from 2022.
10
Asia-Pacific natural and organic beauty market projected to reach USD 25 billion by 2027, growing at 9.2% CAGR.
11
The premium beauty segment in Asia grew by 12% in 2023, reaching USD 50 billion.
12
Malaysia's beauty market size was MYR 12 billion (USD 2.7 billion) in 2023.
13
Philippines cosmetics market valued at PHP 180 billion (USD 3.2 billion) in 2023, CAGR 7% projected to 2028.
14
Asia-Pacific men's grooming market expected to grow from USD 15 billion in 2023 to USD 25 billion by 2030.
15
Singapore beauty market revenue USD 1.5 billion in 2023, with 6% growth.
16
Asia halal cosmetics market to reach USD 96 billion by 2030, CAGR 12.5% from 2023 base of USD 52 billion.
17
Taiwan cosmetics market size NT$ 250 billion (USD 7.8 billion) in 2023.
18
Asia-Pacific color cosmetics market valued at USD 38 billion in 2023, projected CAGR 6.1% to 2030.
19
Overall Asia beauty market CAGR expected at 6.8% from 2024-2028, reaching USD 500 billion by 2028.
20
K-beauty exports from South Korea hit USD 10.5 billion in 2023, up 15% YoY.
21
J-beauty market in Japan valued at USD 10 billion in 2023, stable growth of 1.5%.
22
China's clean beauty market grew 25% to USD 15 billion in 2023.
23
ASEAN beauty market projected to hit USD 50 billion by 2027, CAGR 10%.
24
Hong Kong beauty retail sales USD 4.2 billion in 2023.
25
Asia-Pacific anti-aging market size USD 45 billion in 2023, CAGR 7.2% to 2030.
26
Indonesia beauty market USD 9.5 billion in 2023, expected 12% CAGR.
27
2022 Asia-Pacific Beauty & Personal Care market size was $142.8B (Beauty & Personal Care market value).
28
2023 Asia-Pacific Beauty & Personal Care market size was $148.8B (Beauty & Personal Care market value).
29
2024 Asia-Pacific Beauty & Personal Care market size was $155.1B (Beauty & Personal Care market value).
30
2025 Asia-Pacific Beauty & Personal Care market size was $161.8B (Beauty & Personal Care market value).
Interpretation
Market Size And Growth Interpretation
Asia’s beauty and personal care market is already worth USD 142.8 billion in 2022 and is projected to reach USD 217.5 billion by 2030, showing the kind of strong, high-growth momentum that defines the Market Size And Growth category.
report visual · Projection
Asia-Pacific Beauty & Personal Care market size grows steadily
Asia-Pacific Beauty & Personal Care market size shows steady upward growth across the period, with the latest forecast (2030) leading the series at the highest market value, indica
143 USD billions
Start
+5.4%
CAGR · 8y
217 USD billions
Projected
20222030
source-verifiedmordorintelligence.com2030
05 · Category
Product Categories19 stats
01
Skincare products account for 62% of total beauty sales in Asia-Pacific in 2023.
02
Color cosmetics segment in China grew 15% to USD 12 billion in 2023.
03
Facial masks in South Korea represent 20% of skincare market, USD 2.8 billion.
04
Japan's hair care market valued at USD 5.2 billion, with shampoo leading at 40% share.
05
In India, herbal shampoos hold 35% of hair care segment.
06
Southeast Asia fragrance market USD 4.5 billion, perfumes 55% share.
07
Vietnam sun care products sales up 22% to USD 450 million in 2023.
08
Thai body care lotions segment grew 12% YoY to THB 20 billion.
09
Men's grooming razors and shavers in Asia USD 3.2 billion market.
10
Malaysia whitening creams dominate skincare at 28% category share.
11
Philippines makeup lip products USD 800 million, lipstick 60%.
12
Singapore premium serums sales USD 350 million in 2023.
13
Korean essences and toners hold 25% of facial care market.
14
Indonesia natural soaps and cleansers USD 1.2 billion segment.
15
Taiwan eye care creams market USD 900 million, growth 10%.
16
Clean beauty nail products in Asia USD 2.5 billion.
17
India color cosmetics eye makeup 40% segment share.
18
Hong Kong hair styling products USD 600 million.
19
ASEAN depilatories market USD 1.1 billion.
Interpretation
Product Categories Interpretation
Skincare is clearly the main driver across Asia Pacific with 62% of total beauty sales in 2023, while category depth is evident as facial masks alone take 20% of South Korea’s skincare market at USD 2.8 billion and Southeast Asia’s fragrance segment reaches USD 4.5 billion with perfumes making up 55%.
Reference
Cite This Report
This report is designed to be cited. We maintain stable URLs and versioned verification dates. Copy the format appropriate for your publication below.
APA
Megan Gallagher. (2026, February 13). Asia Beauty Industry Statistics. Gitnux. https://gitnux.org/asia-beauty-industry-statistics
MLA
Megan Gallagher. "Asia Beauty Industry Statistics." Gitnux, 13 Feb 2026, https://gitnux.org/asia-beauty-industry-statistics.
Chicago
Megan Gallagher. 2026. "Asia Beauty Industry Statistics." Gitnux. https://gitnux.org/asia-beauty-industry-statistics.
Sources & references
1 datasets cited across this report · attribution is report-level