

In the ever-changing world of finance, investors and analysts alike continuously seek a means to accurately assess a company’s worth. Valuation metrics have emerged as the go-to tool to accomplish this, serving as both a measuring stick and comparison tool. But with a vast array of methods and numbers swirling in the financial atmosphere, understanding the intricacies of these metrics can be a daunting task.
In this blog post, we will explore the fundamental valuation metrics, the different approaches to evaluating a company’s value, and the intricacies of each metric. It is through this knowledge that, as investors or financial enthusiasts, we can make more informed decisions and navigate the complex landscape of investment analysis with confidence. Get ready to unravel the world of valuation metrics, and discover the key factors that contribute to a company’s true worth.
Valuation Metrics You Should Know
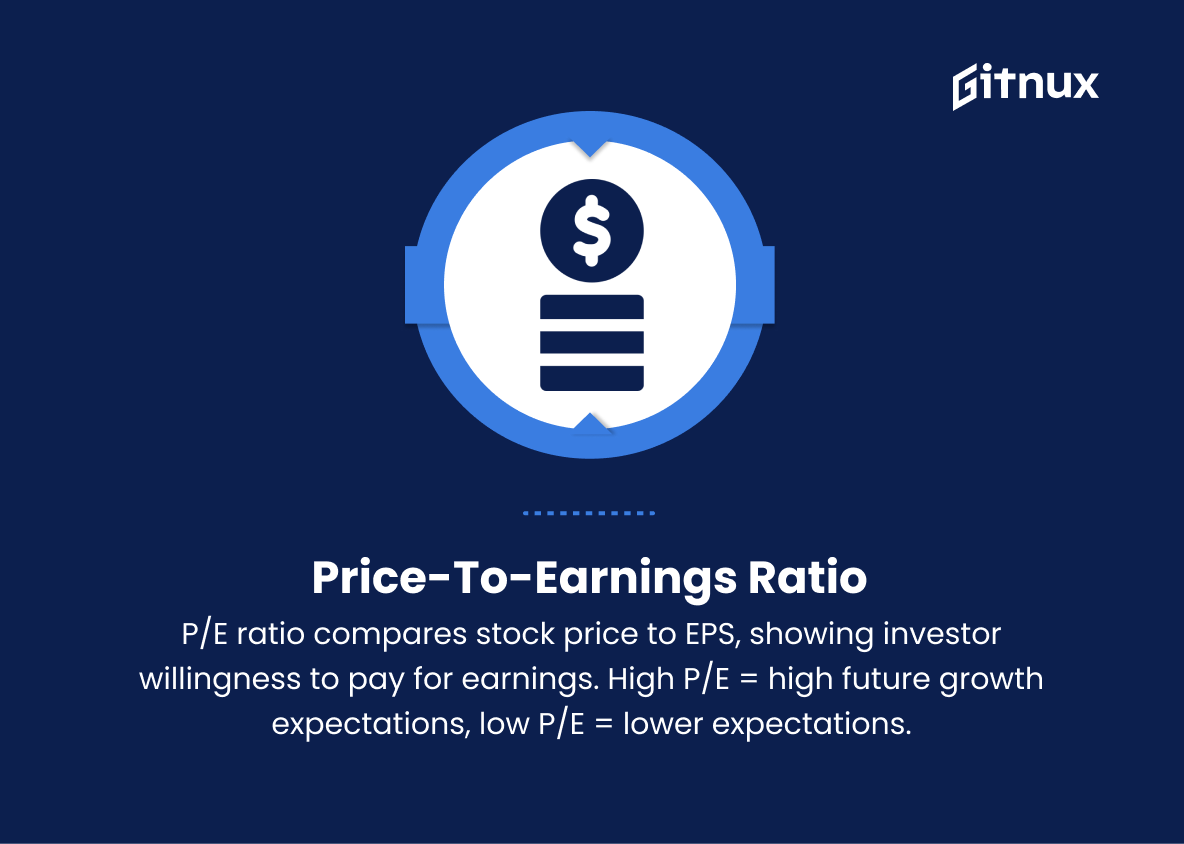
1. Price-to-Earnings Ratio (P/E)
The P/E ratio measures the price of a company’s stock relative to its earnings per share. It indicates how much investors are willing to pay for a company’s earnings. A high P/E ratio may suggest that the market has high expectations for future earnings growth, while a low P/E ratio may indicate that the market has lower expectations for the company.
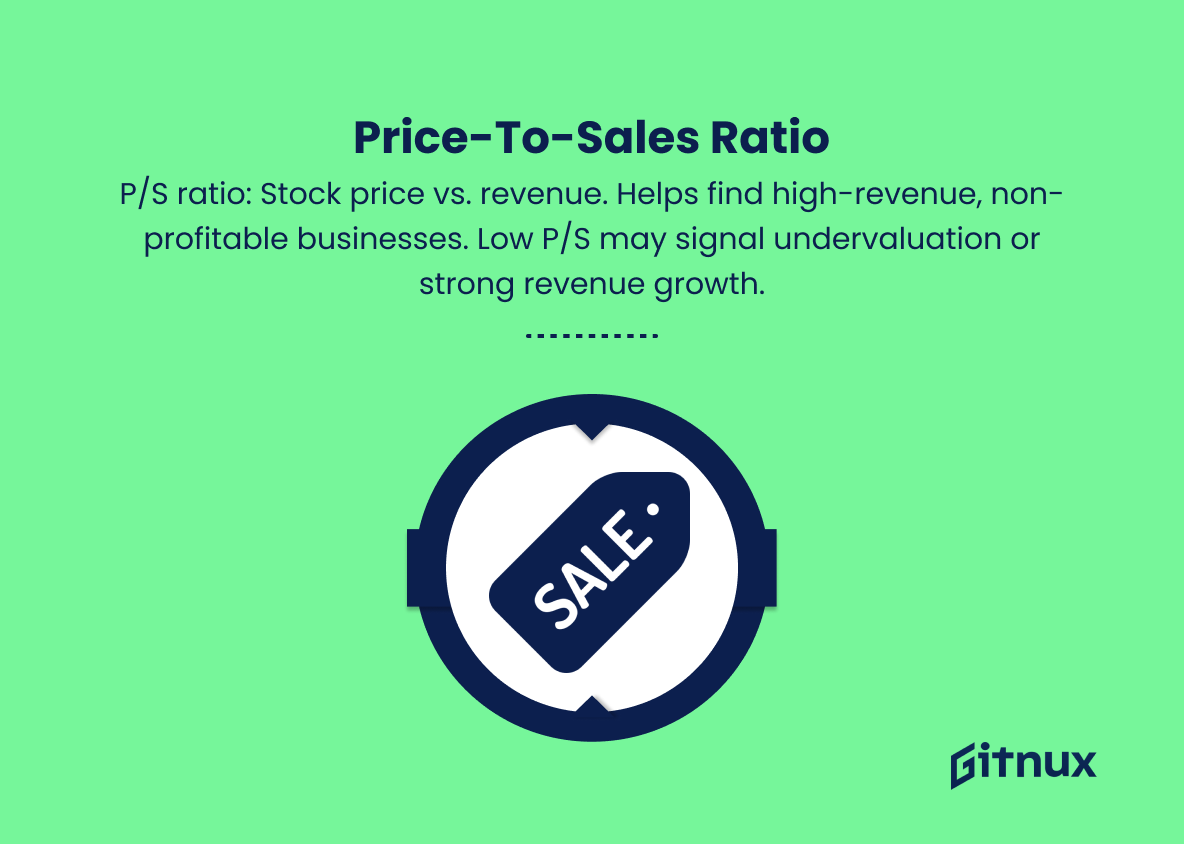
2. Price-to-Sales Ratio (P/S)
The P/S ratio compares a company’s stock price to its revenue, which can be helpful in identifying businesses that generate significant revenue but have not yet reached profitability. A low P/S ratio can potentially indicate a stock is undervalued or that the company has strong revenue growth.
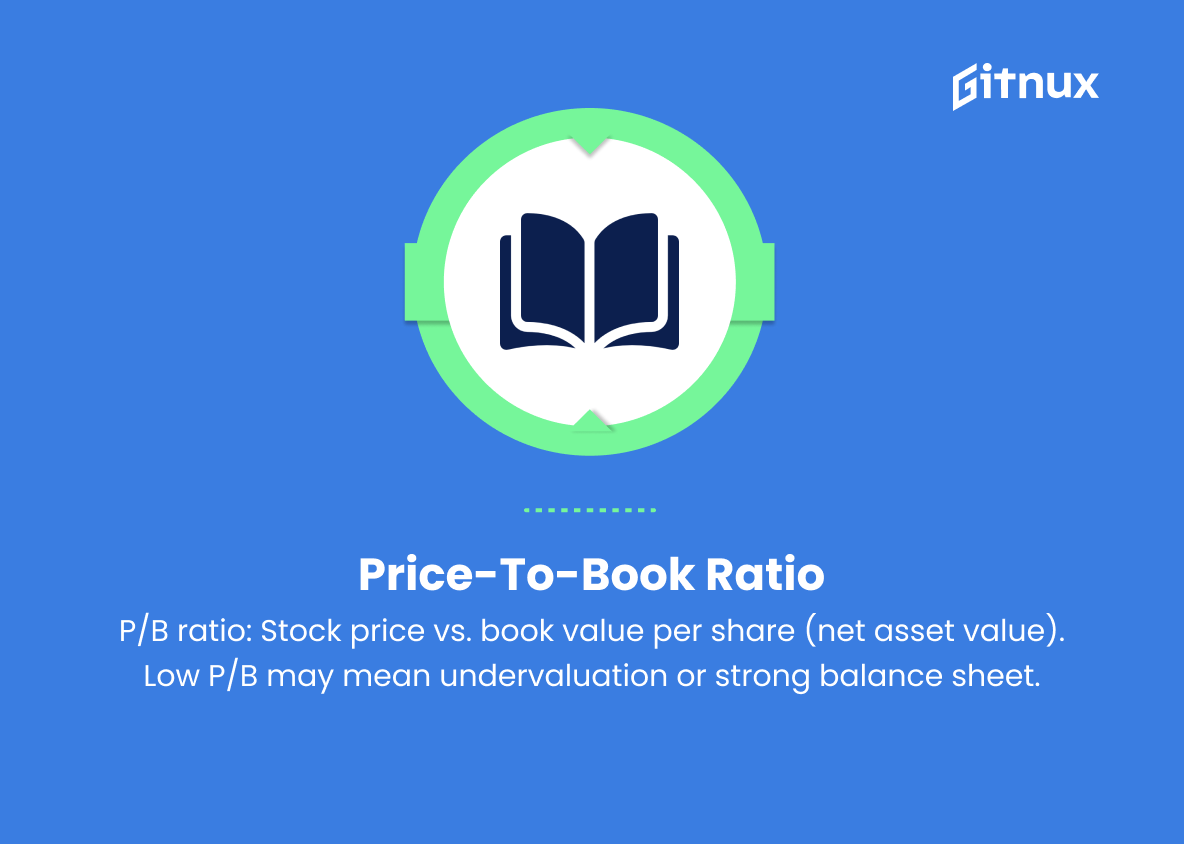
3. Price-to-Book Ratio (P/B)
The P/B ratio compares a company’s stock price to its book value per share, which represents the net asset value of the company (assets minus liabilities). A lower P/B ratio can indicate that a stock may be undervalued or that the company has a strong balance sheet.
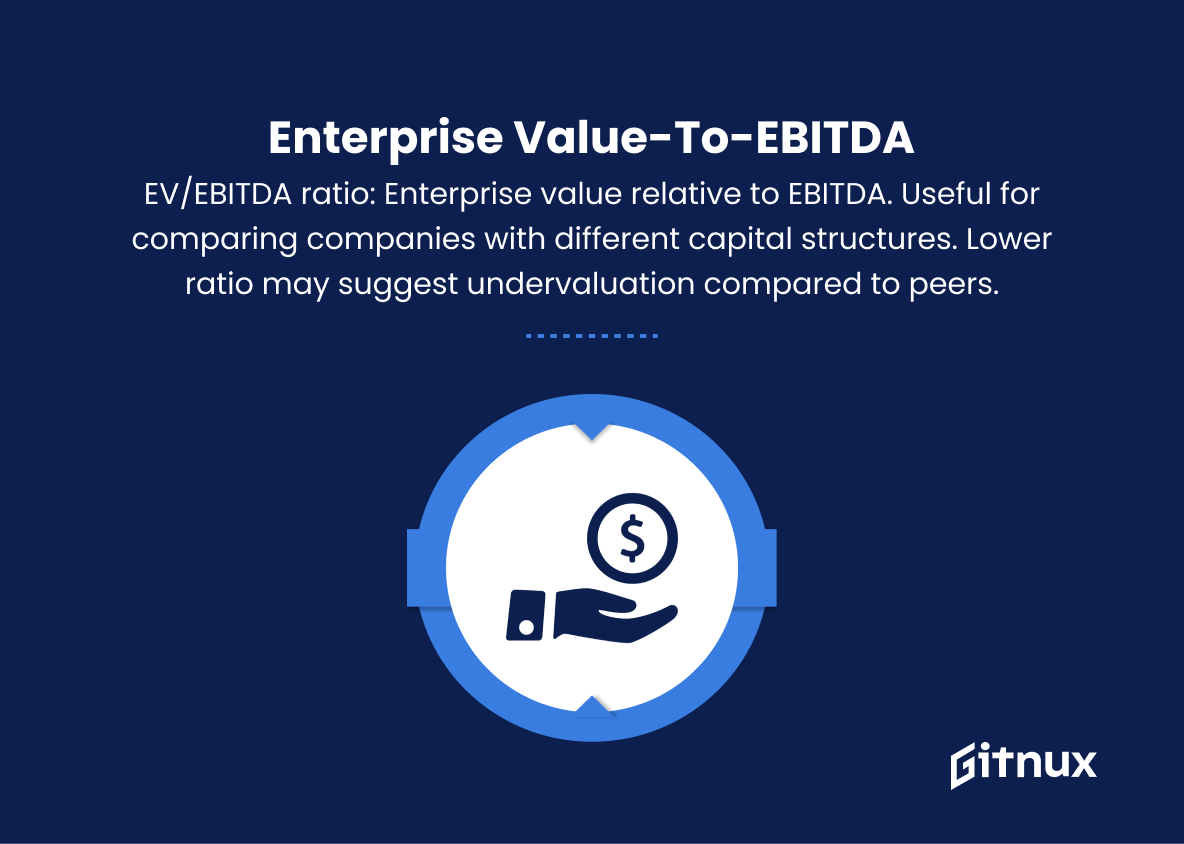
4. Enterprise Value-to-EBITDA (EV/EBITDA)
This ratio measures a company’s enterprise value (market capitalization plus debt minus cash) relative to its earnings before interest, taxes, depreciation, and amortization (EBITDA). The EV/EBITDA ratio is useful for comparing companies with different capital structures, as it considers both equity and debt financing. A lower EV/EBITDA ratio can indicate a potentially undervalued company relative to its peers.
5. Dividend Yield
The dividend yield represents the annual dividend payment that a company distributes to its shareholders, expressed as a percentage of the stock price. A high dividend yield can potentially indicate a stock offers attractive income potential for investors seeking regular dividend payments.
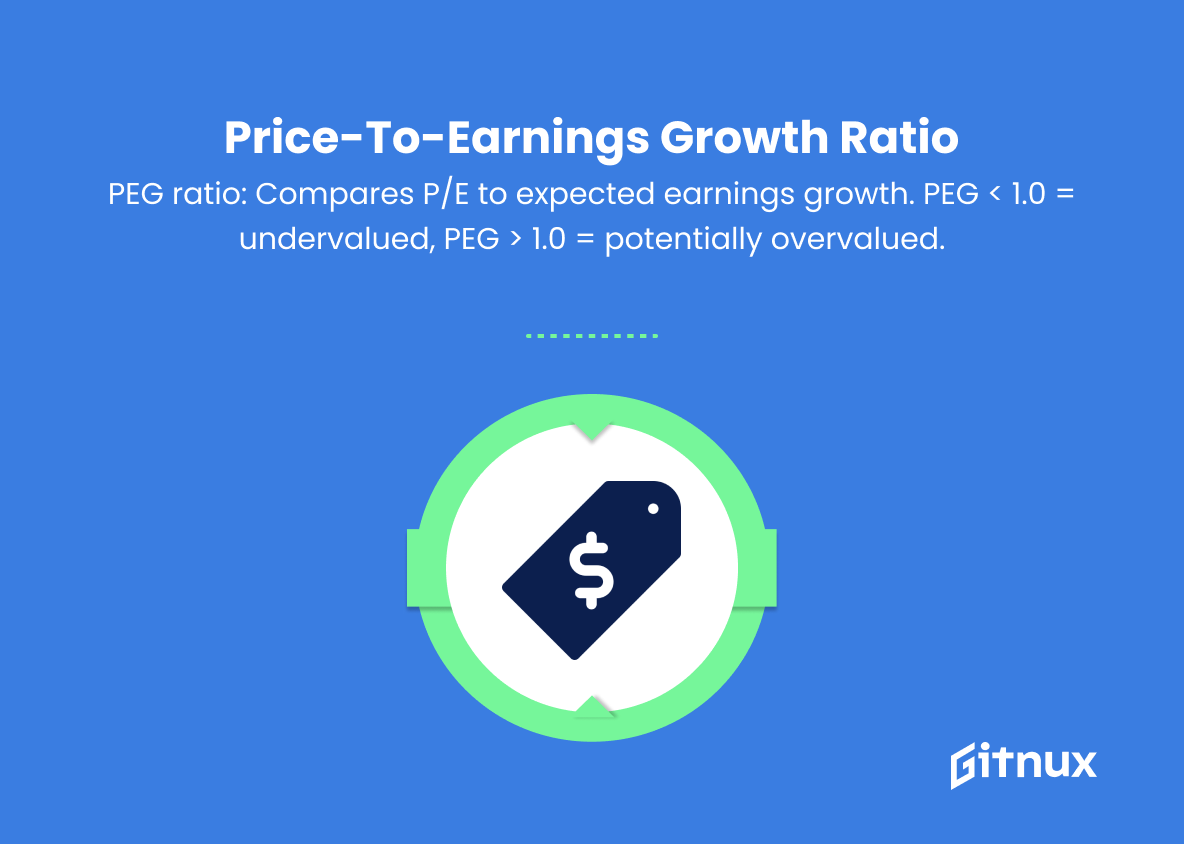
6. Price-to-Earnings Growth (PEG) Ratio
The PEG ratio compares a company’s P/E ratio to its expected earnings growth rate. A PEG ratio below 1.0 can suggest that a stock is undervalued relative to its growth potential, whereas a ratio above 1.0 can indicate that the stock may be overvalued.
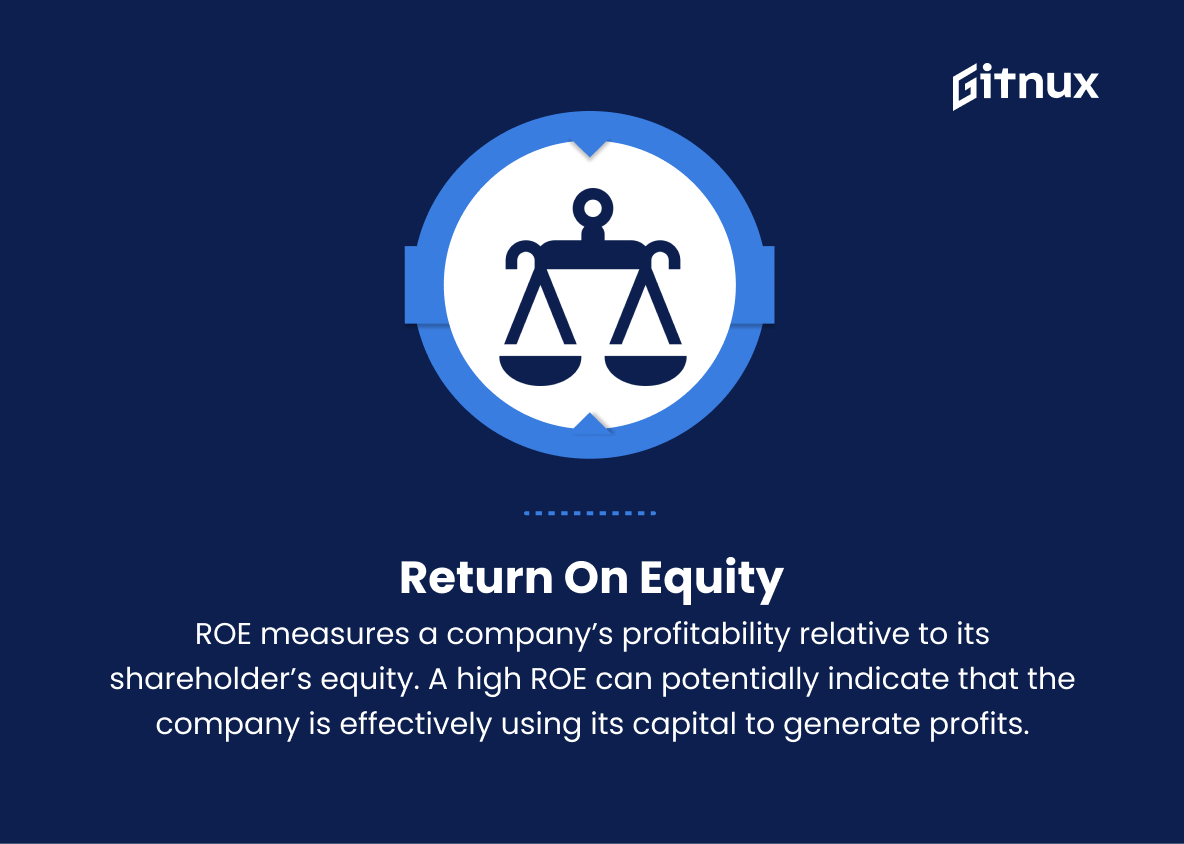
7. Return on Equity (ROE)
ROE measures a company’s profitability relative to its shareholder’s equity. A high ROE can potentially indicate that the company is effectively using its capital to generate profits.
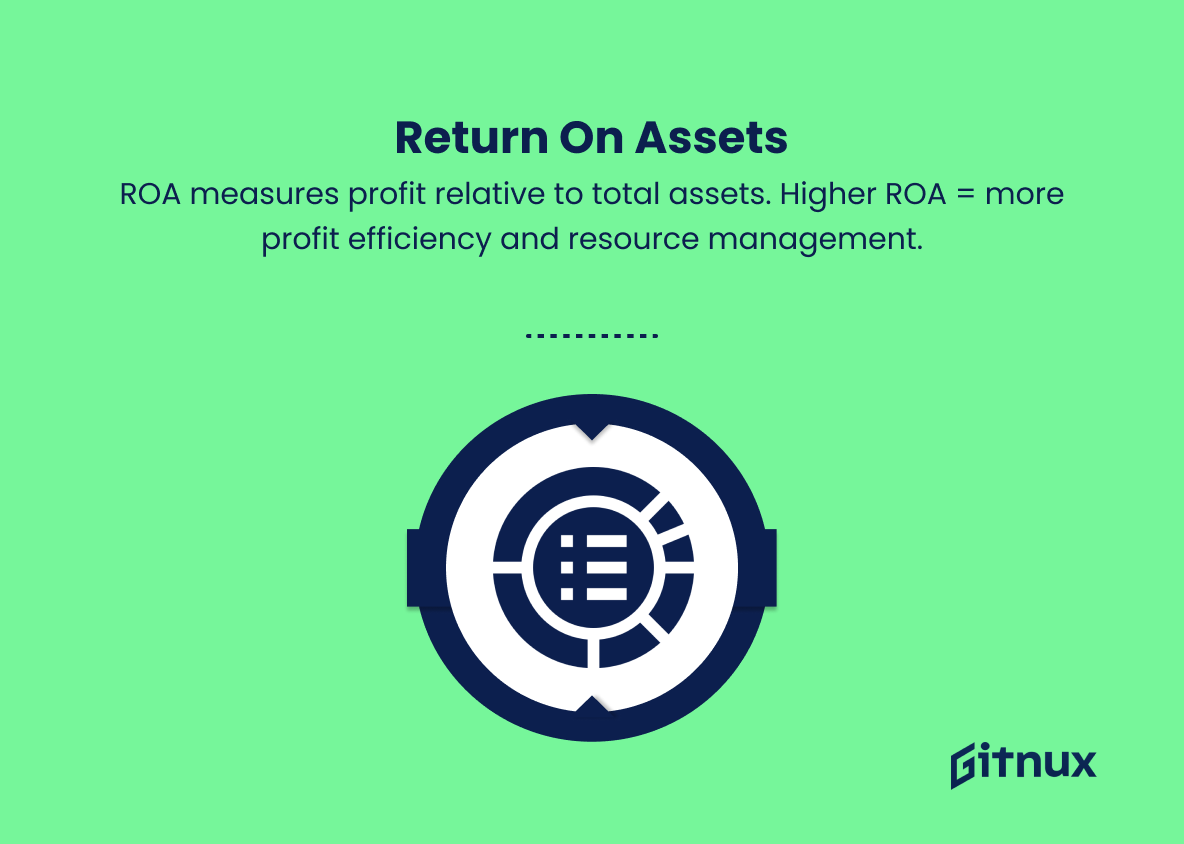
8. Return on Assets (ROA)
ROA measures a company’s profitability relative to its total assets. A higher ROA ratio indicates that the company is generating greater profits from its assets and is potentially more efficient in managing its resources.
9. Free Cash Flow Yield (FCFY)
Free cash flow yield calculates the percentage of free cash flow a company generates relative to its market capitalization. A high FCFY can potentially indicate that a company is generating a large amount of cash relative to its stock price, which can be used for reinvestment or distribution to shareholders.
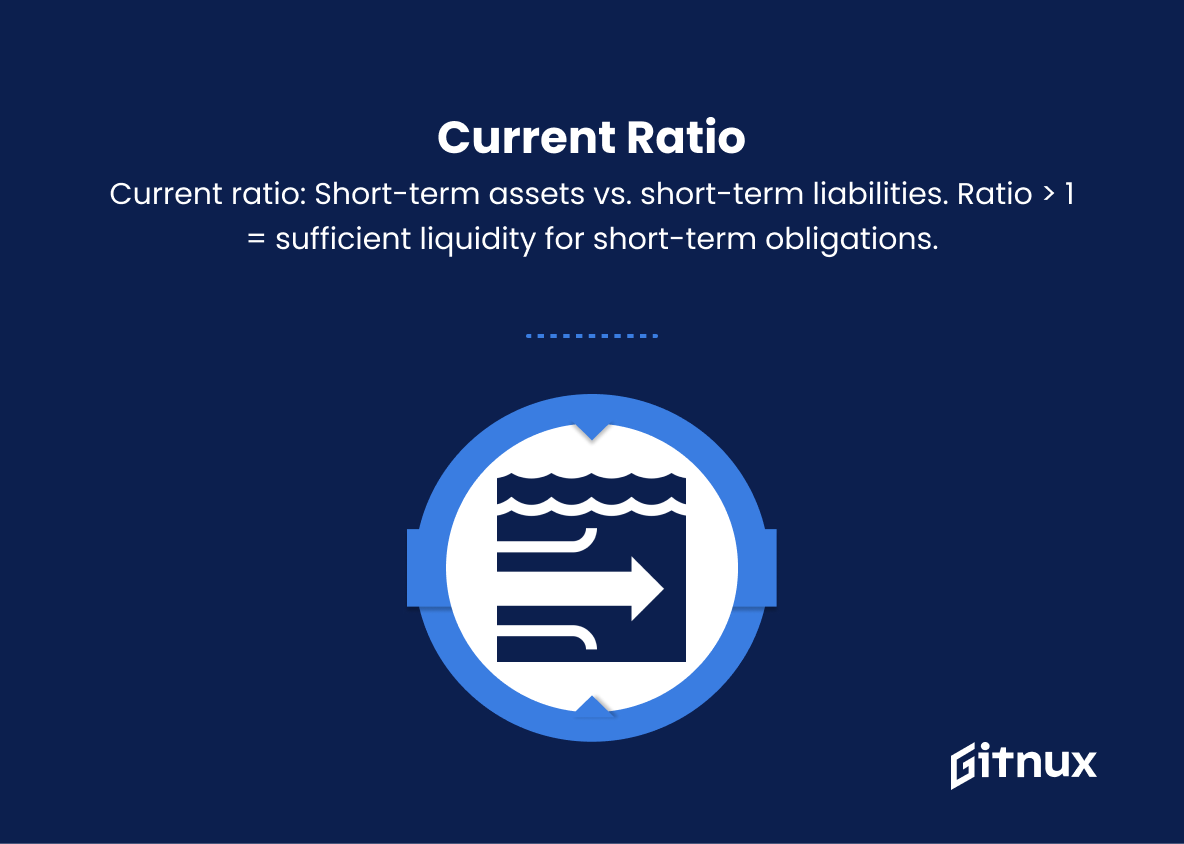
10. Current Ratio
The current ratio measures a company’s ability to pay short-term liabilities using its short-term assets. A current ratio greater than 1 can indicate that a company has sufficient liquidity to pay its short-term obligations.
These are just some of the many valuation metrics used by investors and analysts to assess the relative value of a company in the market. Each metric can provide insight into different aspects of a company’s financial health or operating performance, and using multiple metrics together can help create a more complete understanding of a company’s valuation.
Valuation Metrics Explained
Valuation metrics play a crucial role in helping investors and analysts assess the relative value and financial health of a company in the market. Metrics such as the Price-to-Earnings (P/E) ratio, Price-to-Sales (P/S) ratio, and Price-to-Book (P/B) ratio provide insights into various aspects of a company’s stock price, revenue, and net asset value.
Enterprise Value-to-EBITDA (EV/EBITDA) is particularly useful for comparing companies with different capital structures. Dividend Yield, Price-to-Earnings Growth (PEG) ratio, Return on Equity (ROE), and Return on Assets (ROA) all provide valuable information about a company’s profitability, growth potential, and efficiency. Additionally, Free Cash Flow Yield (FCFY) and Current Ratio both offer insights into a company’s ability to generate cash and meet short-term liabilities.
By using multiple metrics together, investors can gain a more comprehensive understanding of a company’s valuation and make informed decisions.
Conclusion
In conclusion, valuation metrics are indispensable tools for investors and analysts to make accurate and informed investment decisions. By understanding the various metrics used in evaluating a company’s worth, investors can compare and contrast different investment options while navigating the complex world of finance. However, it is essential to remember that no single valuation metric is perfect, and it is always advisable to utilize a combination of these metrics to gain a comprehensive understanding of a company’s true value.
Additionally, an investor’s experience, intuition, and understanding of the market can be invaluable in supplementing the insights gained through valuation metrics. By striking the right balance between quantitative and qualitative analysis, investors can maximize their likelihood of making profitable decisions in the financial markets.
