Hotels are an important part of the US economy, providing jobs and services to millions of people. Therefore, we’ll take a look at some of the most interesting facts and figures about the US hotel industry.
We’ll explore topics such as the number of hotels in the US, the average daily rate for hotels, and the most popular destinations for hotel stays. We’ll also examine the impact of technology on the hotel industry and how it is changing the way people book their stays. So, let’s get started and explore the fascinating world of US hotel statistics.
US Hotels: The Most Important Statistics
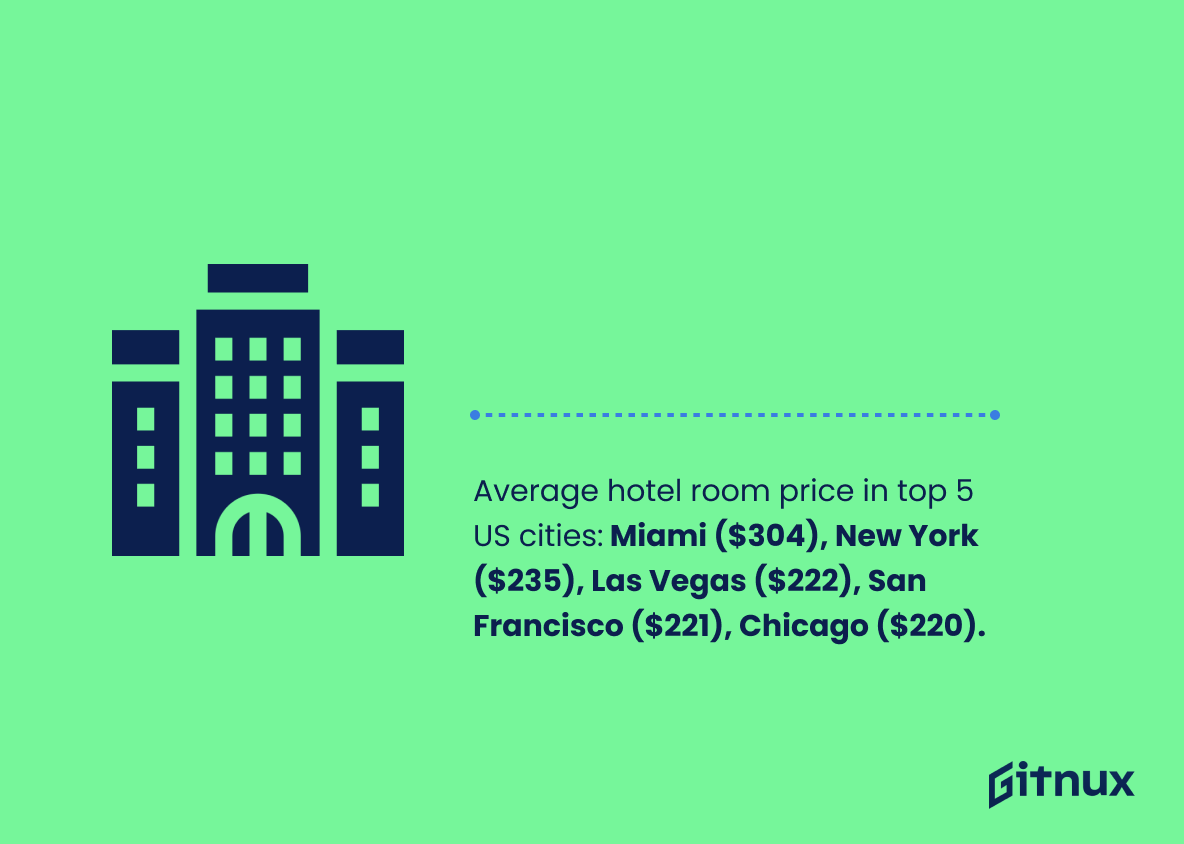
The average hotel room price in the top 5 cities in the US are Miami ($304), New York ($235), Las Vegas ($222), San Francisco ($221) and Chicago ($220).
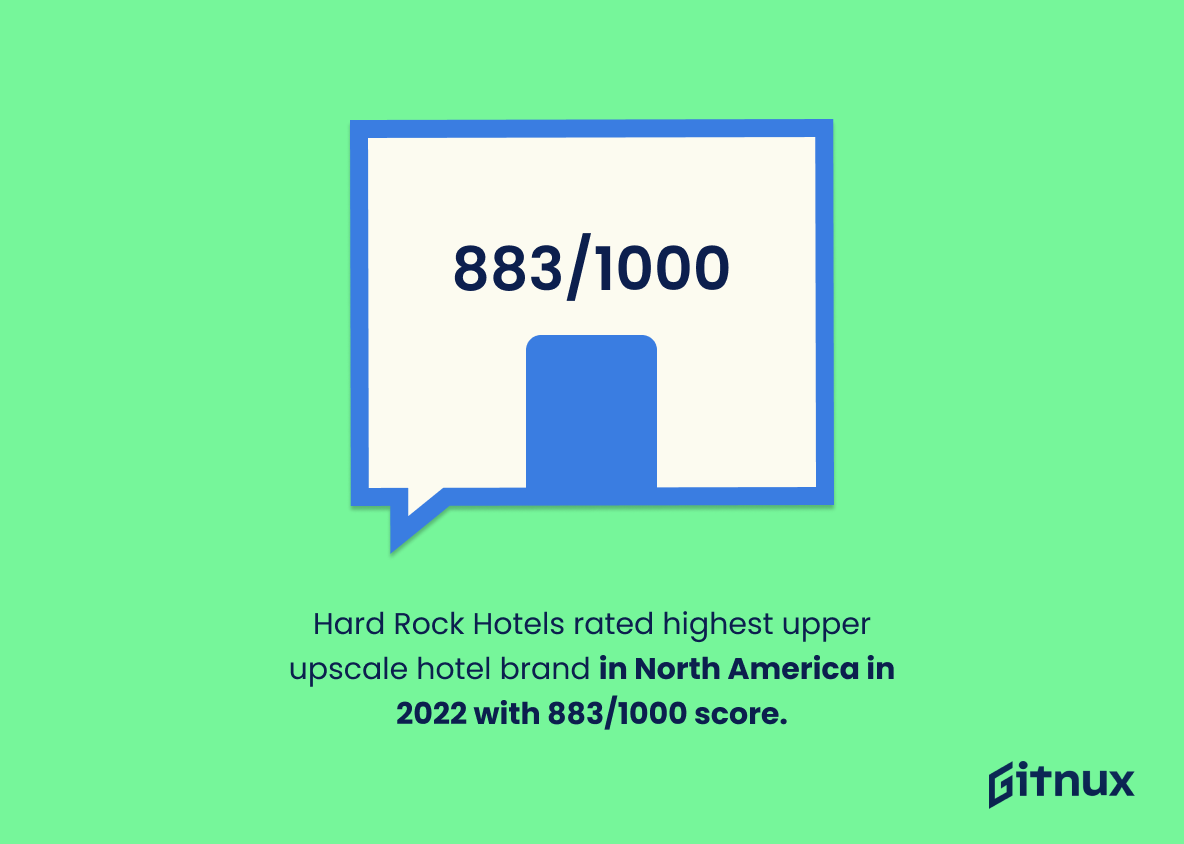
Hard Rock Hotels was rated the highest upper upscale hotel brand in North America in 2022 with a score of 883 out of 1,000.
US Hotel Statistics Overview
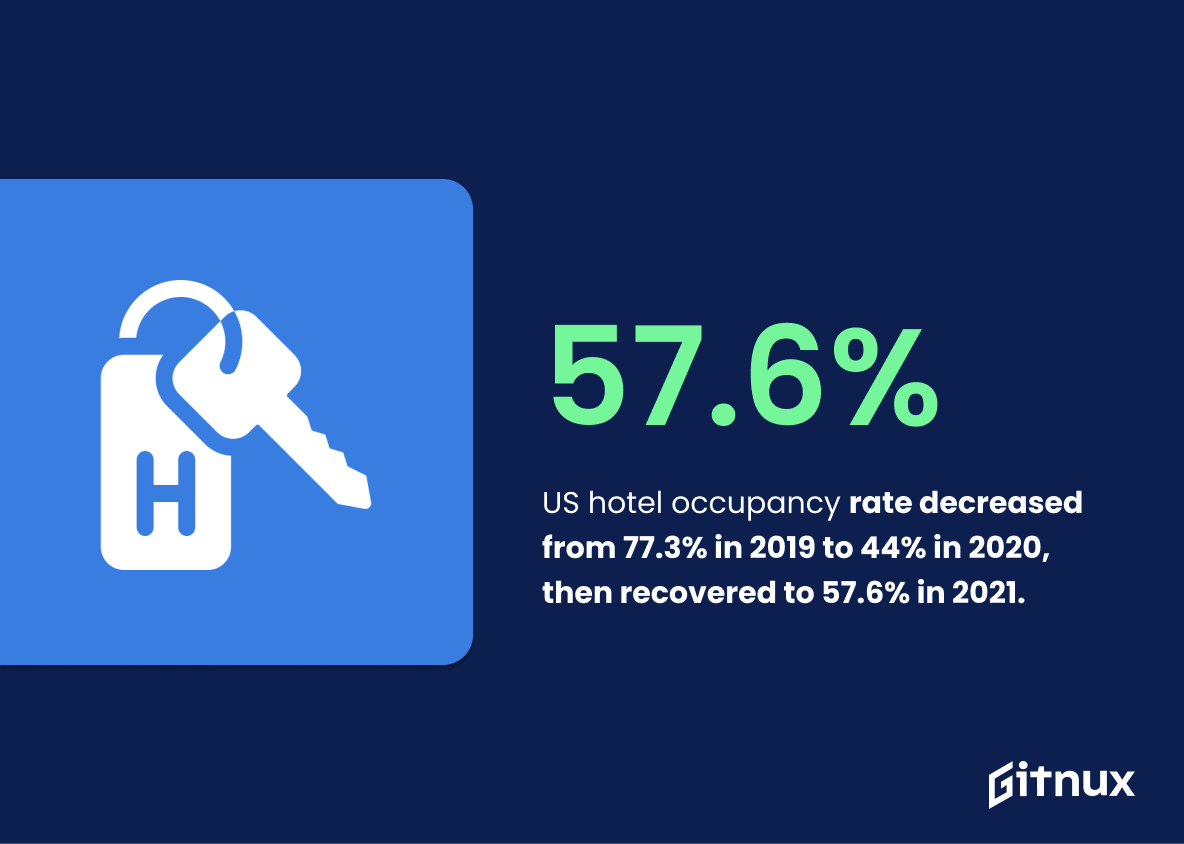
The occupancy rate of the US hotel industry decreased from 77.3% in 2019 to 44% in 2020 due to the coronavirus pandemic, but increased to 57.6% in 2021.
The revenue per available room (RevPAR) of the United States hotel industry increased to 72 U.S. dollars in 2021, up from 45.48 U.S. dollars in the previous year. This increase is attributed to the impact of the coronavirus pandemic, which has had a large effect on the hotel industry.
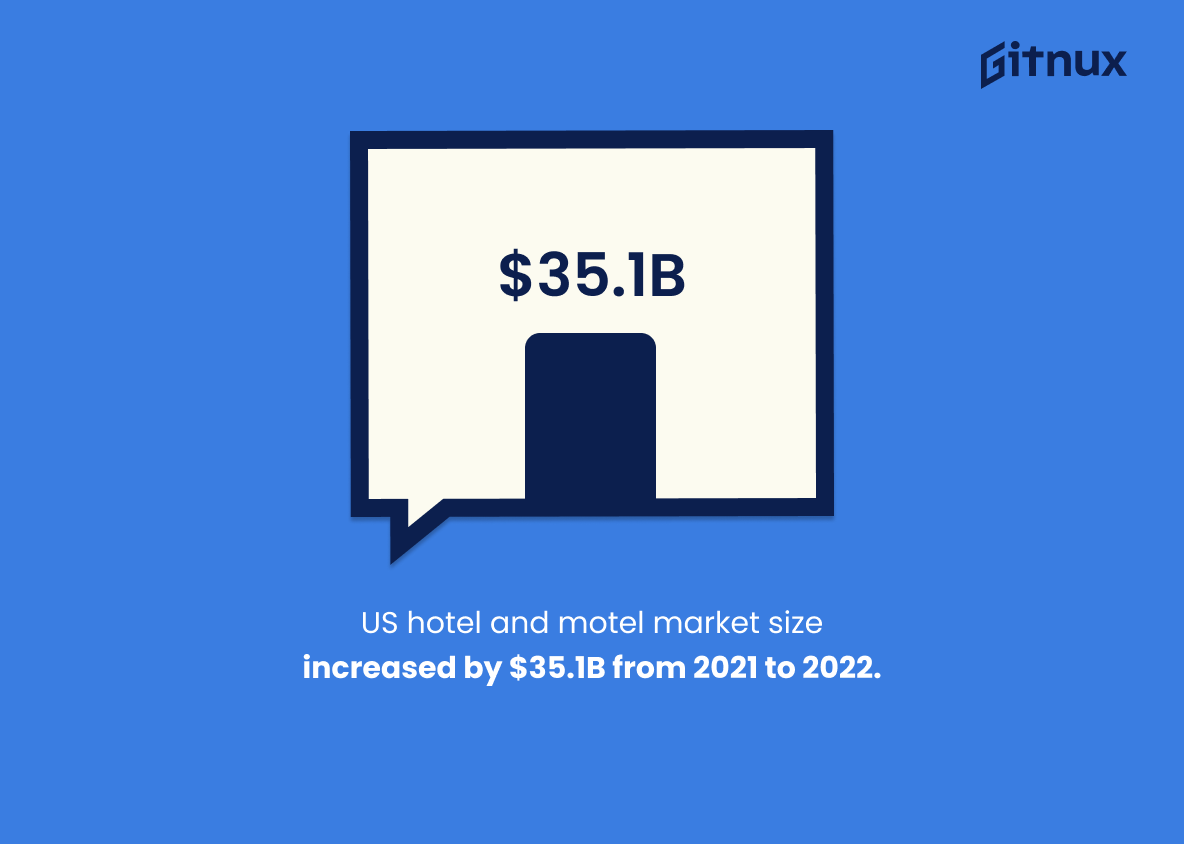
The hotel and motel sector in the United States saw a 35.1 billion U.S. dollar increase in market size from 2021 to 2022.
It displays that the hotel industry is continuing to grow, providing more job opportunities and economic benefits to the US.
The average hotel room price in the top 5 cities in the US are Miami ($304), New York ($235), Las Vegas ($222), San Francisco ($221) and Chicago ($220).
Marriott was the most positively viewed hotel brand in the US in the second quarter of 2022, with Holiday Inn and Holiday Inn Express following close behind. This shows the current preferences of US consumers when it comes to hotel brands, which can be used to inform marketing and business decisions.
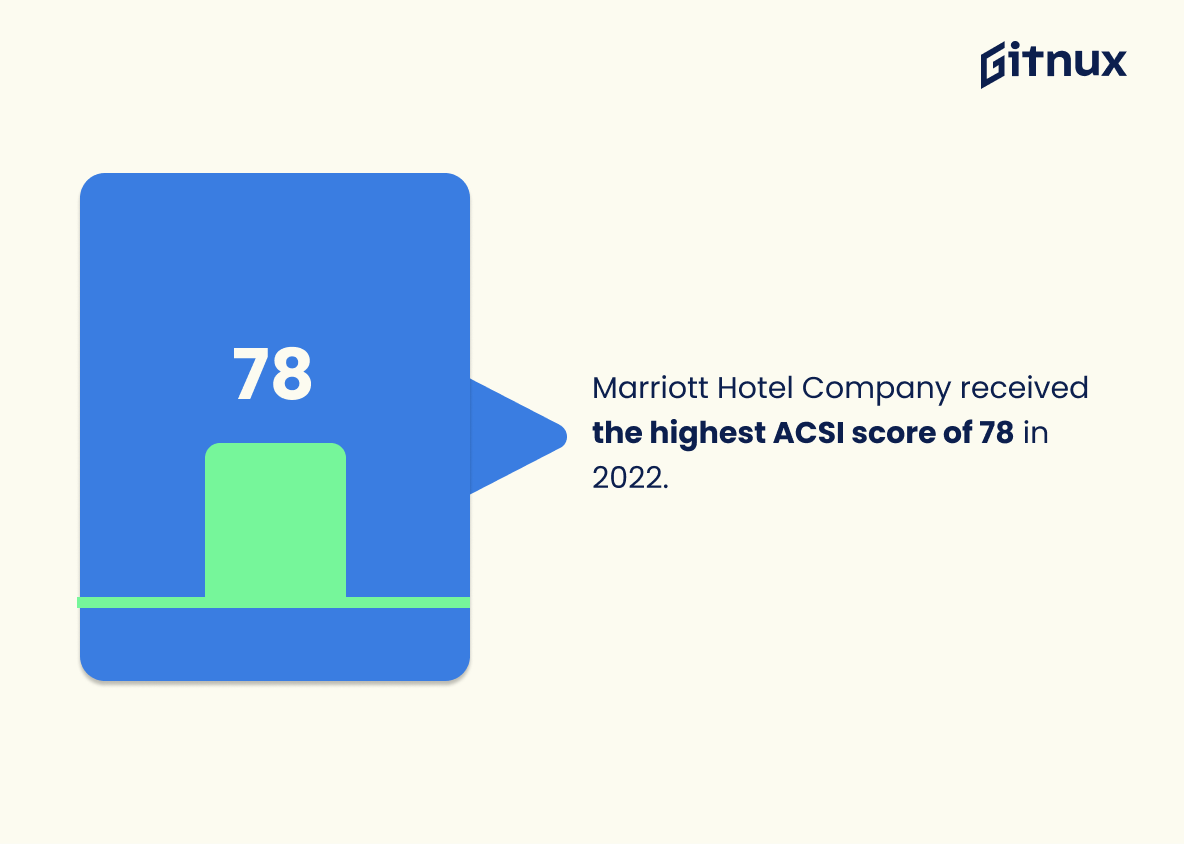
The Marriot Hotel Company received the highest satisfaction score of 78 out of 100 in the 2022 American Customer Satisfaction Index (ACSI).
The ADR of the US hotel industry increased to 125 USD in 2021, despite the drop in 2020 due to the COVID-19 pandemic.
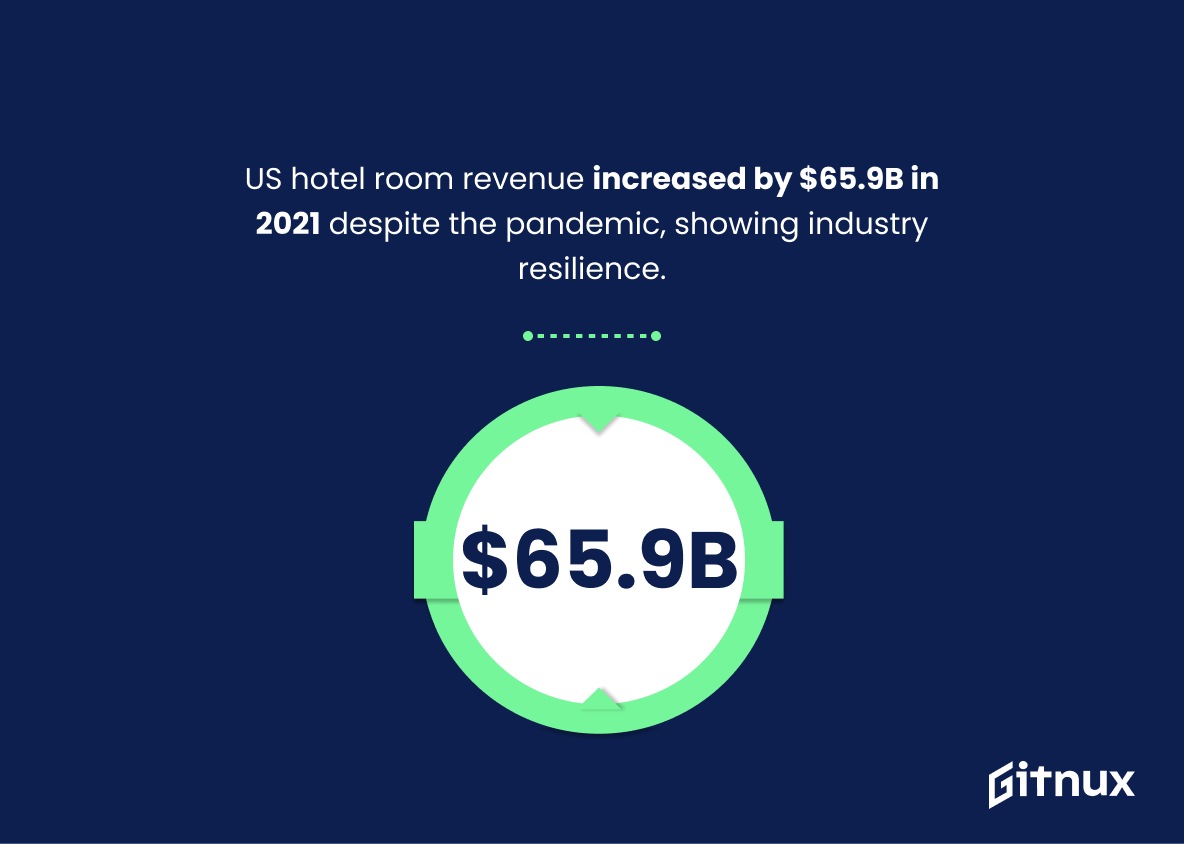
Hotel room revenue in the US increased by 65.9 billion U.S. dollars in 2021, despite the impact of the pandemic, showing resilience in the industry.
This shows that the hotel industry is recovering from the effects of the pandemic and is a positive sign for the future of the US hotel industry.
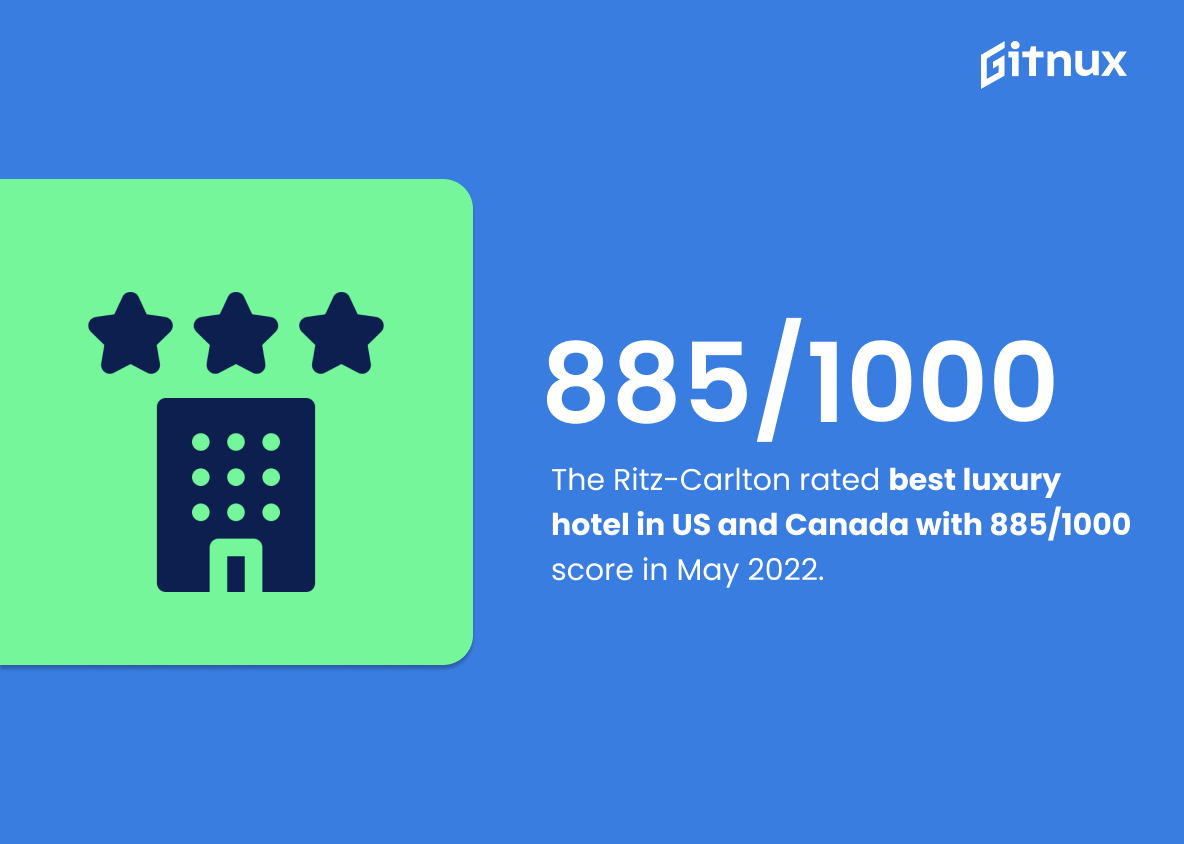
The Ritz Carlton was rated the best luxury hotel in the US and Canada with an overall score of 885 out of 1,000 as of May 2022.
Thus, customers are increasingly focused on the overall customer experience, rather than just amenities.
Hard Rock Hotels was rated the highest upper upscale hotel brand in North America in 2022 with a score of 883 out of 1,000.
Supplementary Statistics
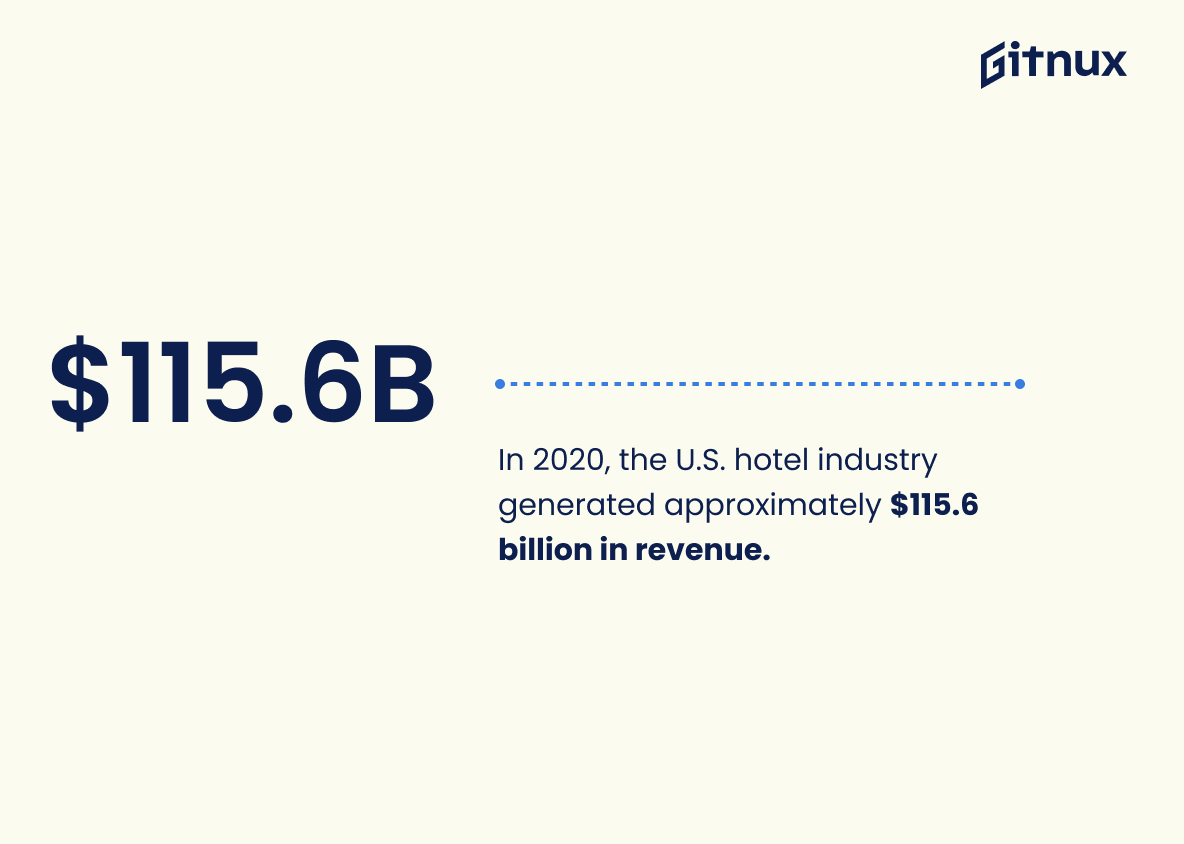
In 2020, the U.S. hotel industry generated approximately $115.6 billion in revenue.
Despite the challenges posed by the COVID-19 pandemic. It highlights the resilience of the industry and its ability to remain profitable despite the difficult circumstances. This statistic is an important piece of information for anyone interested in the U.S. hotel industry and its performance in 2020, and is thus a valuable addition to any blog post about U.S. hotel statistics.
In 2019, there were 54,200 hotel properties in the United States.
This provides a snapshot of the number of properties available to travelers, giving readers an idea of the range of options available to them when planning a trip. Additionally, it can be used to compare the US hotel industry to other countries, providing insight into the relative size and strength of the industry.
As of January 2021, Marriott International was the largest hotel chain in the United States with 5,974 hotels.
It is a powerful indicator of the company’s ability to provide quality services and accommodations to its customers. It also speaks to the strength of the US hotel industry as a whole, which is a key factor in the country’s economic growth. This statistic is an important piece of information for anyone interested in learning more about the US hotel industry and its current state.
In 2020, the average room rate for a U.S. hotel was $103.25
It reveals that, despite the economic downturn caused by the pandemic, the average room rate for U.S. hotels remained relatively stable. This is an important insight for anyone interested in the U.S. hotel industry, as it provides a valuable benchmark for understanding the industry’s performance in 2020.
As of 2019, there were about 4.4 million hotel rooms in the United States.
Additionally, it can be used to analyze trends in the hotel industry, such as the growth or decline of hotel rooms over time. This information can be used to inform decisions about where to invest in the hotel industry, or to identify potential areas of growth.
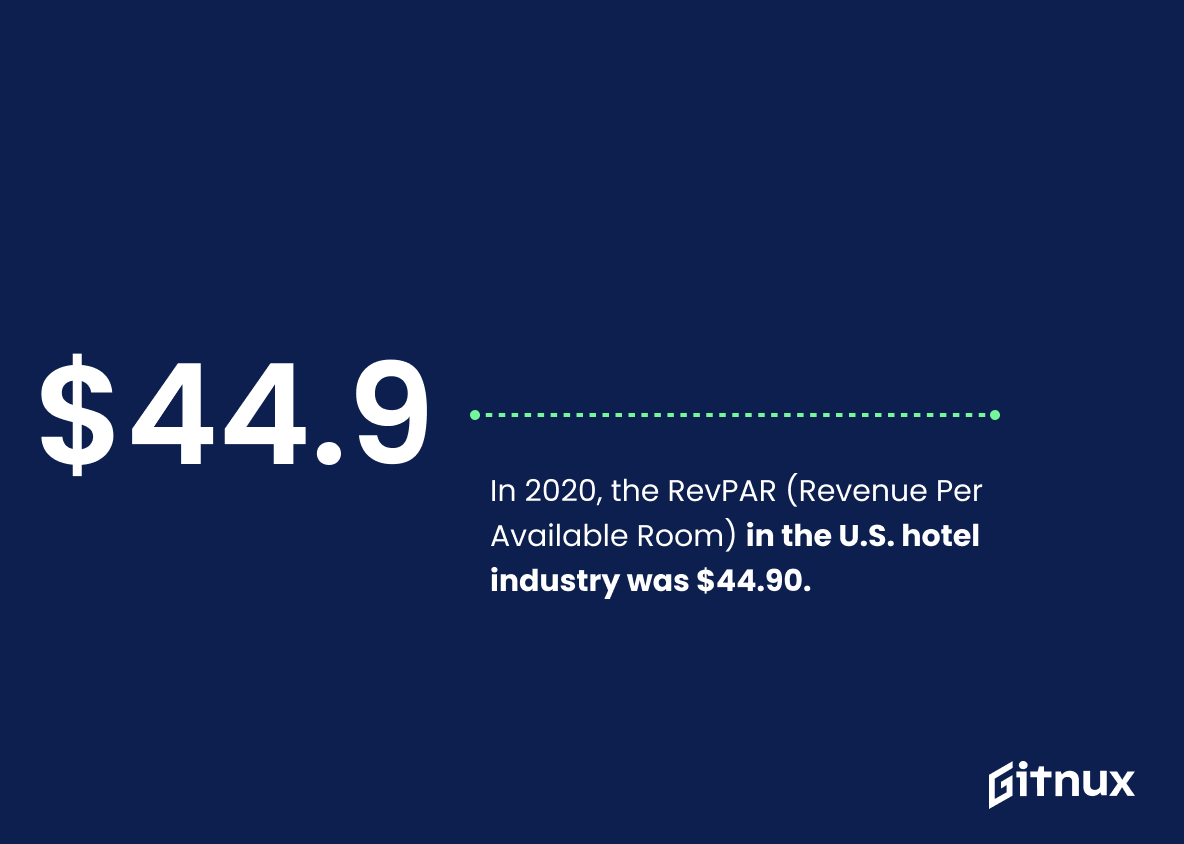
In 2020, the RevPAR (Revenue Per Available Room) in the U.S. hotel industry was $44.90.
The RevPAR statistic is a key indicator of the health of the U.S. hotel industry, providing insight into the amount of revenue generated per available room. At $44.90, this figure is a clear indication that the industry is performing well, despite the challenges posed by the pandemic. This statistic is essential for understanding the current state of the U.S. hotel industry and provides valuable insight into the future of the industry.
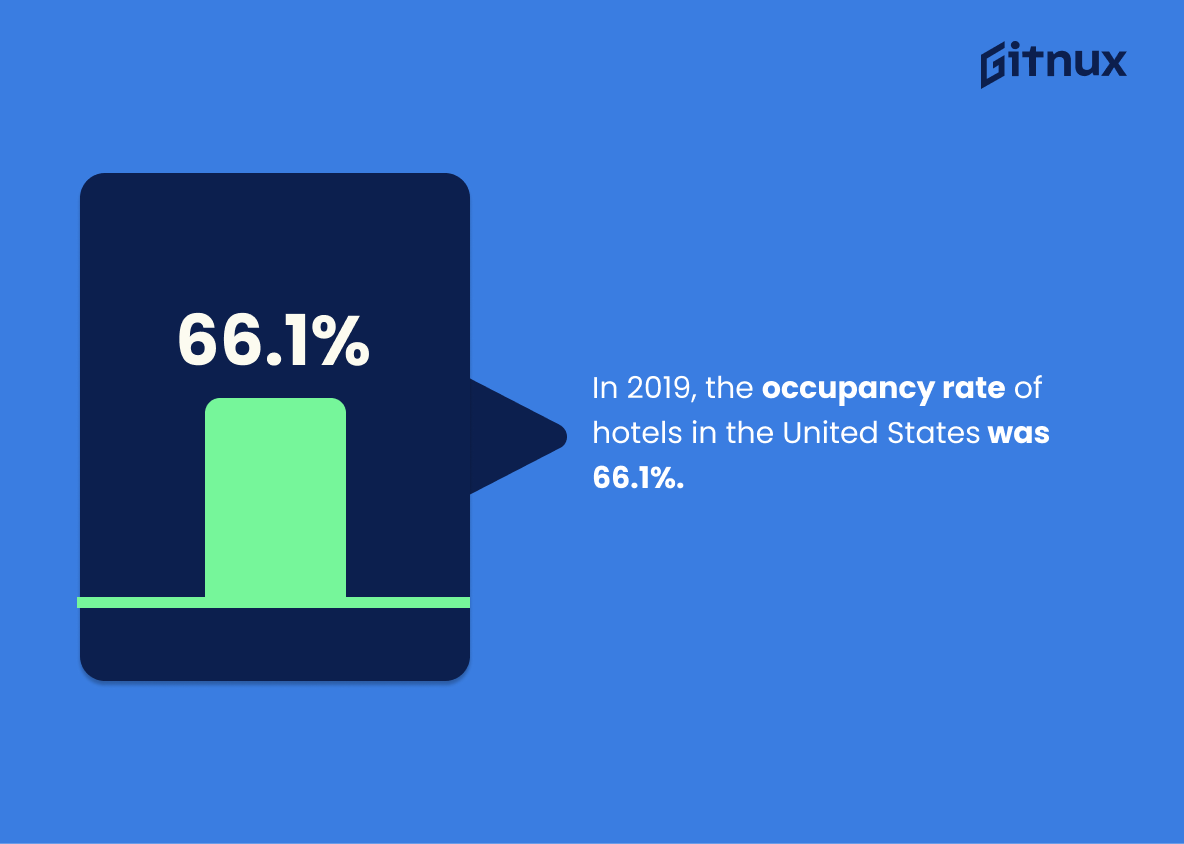
In 2019, the occupancy rate of hotels in the United States was 66.1%.
This provides insight into the number of people staying in hotels, which can be used to gauge the overall demand for hotel services. Additionally, the occupancy rate can be used to compare the performance of different hotels and regions, helping to identify areas of strength and weakness. As such, this statistic is an invaluable resource for anyone looking to gain a better understanding of the US hotel industry.
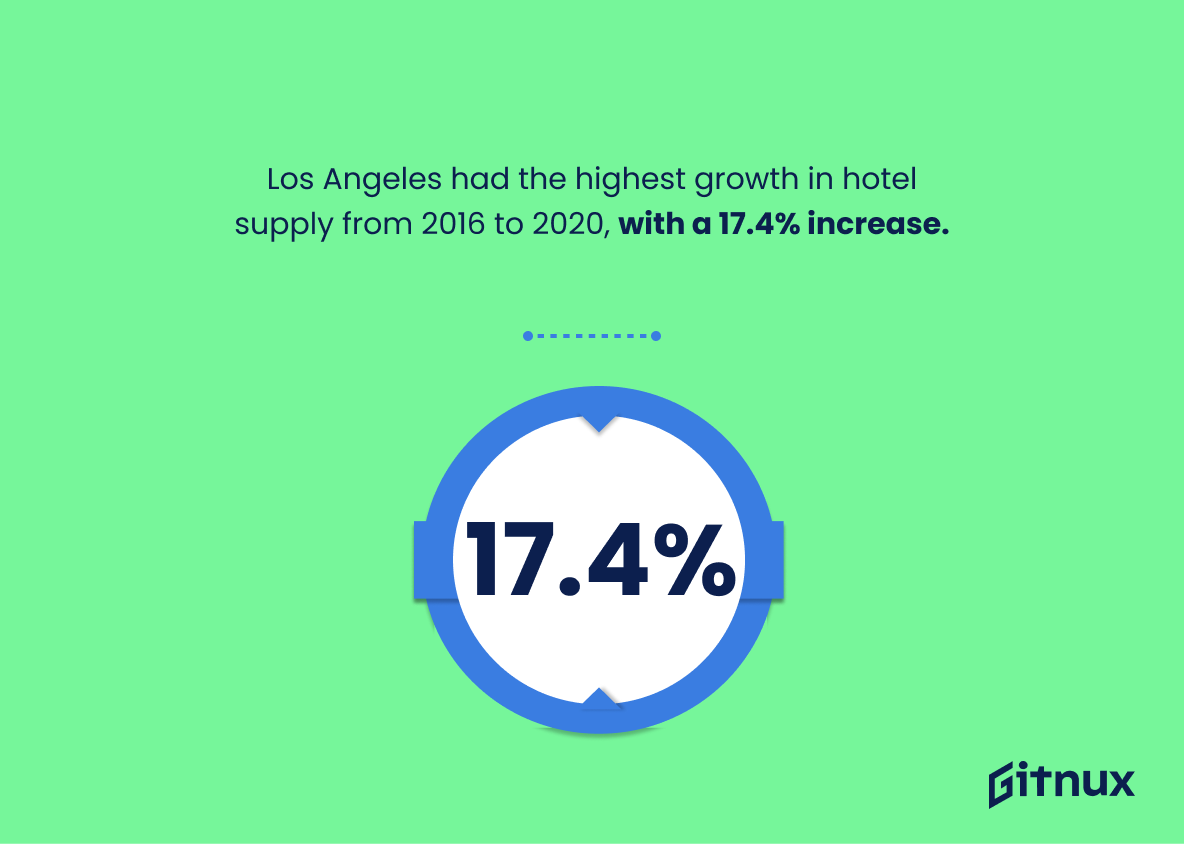
Los Angeles had the highest growth in hotel supply from 2016 to 2020, with a 17.4% increase.
The city is becoming an increasingly popular destination for travelers. This growth in hotel supply is indicative of the city’s growing popularity, and provides an interesting insight into the US hotel industry as a whole.
In 2020, the average daily rate (ADR) for luxury hotels in the U.S. was $299.22.
This provides insight into the average cost of a night’s stay in a luxury hotel, which can be used to compare the prices of different hotels and to gauge the overall health of the industry. Additionally, this statistic can be used to inform readers of the blog post about the current trends in the luxury hotel industry in the U.S. and how they may affect their own travel plans.
In 2019, 65% of hotel rooms in the United States were booked online.
The majority of hotel bookings are now being made online, highlighting the importance of digital marketing and online presence for hotels. This statistic is an important piece of information for anyone looking to gain insight into the US hotel industry and the trends that are shaping it.
In 2020, the extended-stay hotel segment had an occupancy rate of 75% in the United States.
With an occupancy rate of 75%, it is clear that this segment of the hotel industry has been able to weather the storm of the pandemic and remain a viable option for travelers. This statistic is an important piece of information for anyone looking to gain insight into the US hotel industry in 2020.
As of 2020, the U.S. hotel and travel industry employed nearly 1.1 million people.
It highlights the sheer number of people employed in the industry, and the importance of the industry in providing jobs and economic stability to millions of people. It is a testament to the strength of the industry and its importance to the nation.
In 2019, U.S. hotels invested more than $7.3 billion in renovations and improvements.
The $7.3 billion investment in renovations and improvements demonstrates the dedication of U.S. hotels to ensuring their guests have access to the latest amenities and services. This investment also speaks to the confidence of U.S. hotels in the future of the industry, as they are willing to invest in their properties to ensure they remain competitive.
As of 2019, the La Quinta hotel chain had the highest customer satisfaction rating, scoring 87 out of 100 points.
This is an impressive feat, and it speaks to the commitment of La Quinta to providing its customers with a top-notch experience. This information is invaluable for readers of the blog post about US hotel statistics, as it provides them with a reliable source of information about the quality of the La Quinta hotel chain.
In 2019, 39% of U.S. leisure travelers preferred to stay in hotels.
It indicates that a large portion of travelers are choosing to stay in hotels, which could be indicative of a strong hotel industry in the US. Additionally, this statistic could be used to inform marketing strategies for hotels, as it provides an indication of the preferences of leisure travelers.
In 2020, the average length of stay at a U.S. hotel was 1.6 nights.
The average length of stay at a U.S. hotel has decreased from previous years, likely due to the impact of the COVID-19 pandemic. This information can be used to inform decisions about hotel operations, marketing strategies, and pricing. It can also provide insight into the preferences of travelers and the overall health of the hospitality industry.
New York City had the highest number of hotel rooms under construction in the U.S. in 2021, with 12,053 rooms.
The city is a popular destination for travelers and that the demand for hotel rooms is high. This statistic is important for anyone interested in the US hotel industry, as it provides insight into the current trends and growth in the sector.
In 2019, 35% of U.S. hotel guests were millennial travelers.
A large portion of the hotel industry’s customer base is made up of this demographic, which is important for hotel owners and marketers to be aware of when creating strategies to attract and retain customers.
As of June 2021, the U.S. hotel industry was witnessing a recovery with 69.5% occupancy, which is closer to pre-pandemic levels.
Despite the economic downturn, the industry has been able to bounce back and is now close to pre-pandemic levels. This is an encouraging sign for the industry and provides a valuable insight into the current state of the U.S. hotel industry.
Conclusion
In conclusion, US hotel statistics are an important indicator of the health of the hospitality industry. They provide a snapshot of the current state of the industry, and can be used to inform decisions about future investments and strategies.
By understanding the data, hoteliers can make informed decisions about how to best serve their customers and maximize their profits. With the right data and analysis, hoteliers can ensure their business remains competitive and profitable in the long run.
References
1 – Hotel occupancy rate US 2021 | Statista
2 – RevPAR of the U.S. hotel industry 2021 | Statista
3 – Hotel and motel sector market size US 2021 | Statista
4 – Hotels: most expensive cities U.S. 2022 | Statista
5 – Most positively viewed hotel brands in the U.S. Q2 2022 | Statista
6 – American customer satisfaction index for hotel companies in the U.S. 2008-2022 | Statista
7 – Average daily hotel room rate US 2021 | Statista
8 – Hotel room revenue US 2021 | Statista
9 – Best luxury hotel brands in North America 2022 | Statista
10 – Highest-rated upper upscale hotel brands in North America 2022 | Statista
11 – https://www.marketwatch.com
