
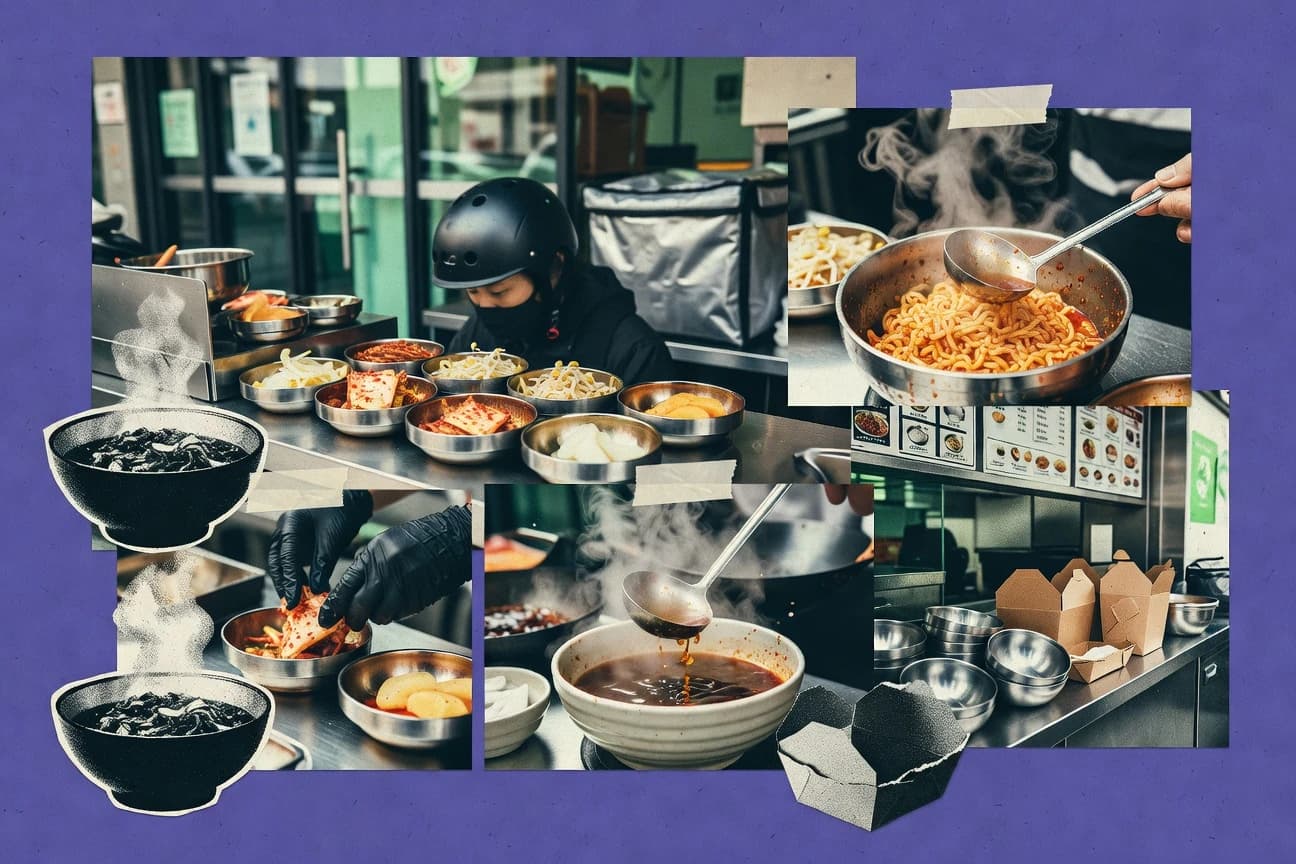

South Korea’s food service industry is forecast to reach 250 trillion KRW by 2030, but the real story shows up much closer to the dinner table, with 68% of people dining out at least weekly in 2023. Behind that habit are shifts like solo dining in Seoul rising to 38% of urban visits and health conscious choices driving 55% of menu decisions, alongside Gen Z leaning heavily on mobile apps.
Key Takeaways
- 68% of South Koreans dined out at least once a week in 2023, up from 59% in 2022.
- Millennials (aged 25-40) represent 45% of foodservice consumers in South Korea, spending 2.8 million KRW annually per person.
- 72% of consumers prefer Korean cuisine when dining out, followed by Western at 18%.
- The foodservice market is expected to reach 250 trillion KRW by 2030 at 5.1% CAGR.
- Delivery platform market to grow 12% annually to 60 trillion KRW by 2028.
- Plant-based menu items projected to increase 30% by 2025.
- Full-service restaurants hold 45% market share by outlets, with 278,000 locations in 2023.
- QSR chains like Lotteria operate over 1,500 outlets, capturing 15% of fast food segment.
- Cafes number 85,000 nationwide, with Starbucks leading at 1,700 stores.
- In 2023, the total revenue of South Korea's foodservice industry reached approximately 180.5 trillion KRW, marking a 5.2% year-over-year growth driven by post-pandemic recovery and increased dining out.
- The foodservice market in South Korea is projected to grow at a CAGR of 4.8% from 2024 to 2028, reaching 214.3 trillion KRW by 2028.
- Full-service restaurants accounted for 42% of the total foodservice revenue in South Korea in 2022, generating 75.8 trillion KRW.
- Average annual revenue per foodservice outlet in South Korea was 291 million KRW in 2023.
- Labor costs account for 32% of total operating expenses in restaurants.
- Average employee turnover rate in foodservice is 28% annually.
South Korea’s foodservice boom is driven by weekly dining, mobile ordering, health choices, and rising delivery.
Related reading
01 · Category
Consumer Insights23 stats
01
68% of South Koreans dined out at least once a week in 2023, up from 59% in 2022.
02
Millennials (aged 25-40) represent 45% of foodservice consumers in South Korea, spending 2.8 million KRW annually per person.
03
72% of consumers prefer Korean cuisine when dining out, followed by Western at 18%.
04
Health-conscious eating drove 55% of menu choices in 2023, with low-calorie options up 12%.
05
Solo dining accounts for 38% of foodservice visits in urban areas like Seoul.
06
81% of Gen Z consumers use mobile apps for restaurant discovery and ordering.
07
Vegetarian/vegan meal demand grew 22% YoY in 2023 among urban consumers.
08
Average dining party size decreased to 2.4 persons in 2023 from 2.7 pre-pandemic.
09
64% of consumers prioritize ambiance and interior design in restaurant selection.
10
Weekend dining peaks at 7 PM, with 42% of weekly visits occurring then.
11
55% of South Koreans aged 20-29 eat out daily or near-daily.
12
Preference for fusion cuisine rose to 29% from 21% in 2021.
13
76% consider price value important, with average check 15,000 KRW.
14
Female consumers drive 52% of cafe visits, focusing on desserts.
15
67% use loyalty programs, boosting repeat visits by 25%.
16
Spicy food preference at 82%, influencing 65% of menu orders.
17
Family dining share 22%, down due to smaller households.
18
49% prioritize hygiene post-COVID in selection criteria.
19
73% of urban consumers aged 18-34 dine out 3+ times/week.
20
61% seek experiential dining like themed restaurants.
21
Average spend per visit up 8% to 18,200 KRW.
22
59% prefer contactless service still in 2023.
23
Korean BBQ demand 85% among locals.
Interpretation
Consumer Insights Interpretation
South Koreans are dining out more often but in smaller groups, eating alone but together online, craving spicy Korean classics and low-calorie fusions, all while their phones and loyalty apps are picking up the check.
02 · Category
Future Outlook22 stats
01
The foodservice market is expected to reach 250 trillion KRW by 2030 at 5.1% CAGR.
02
Delivery platform market to grow 12% annually to 60 trillion KRW by 2028.
03
Plant-based menu items projected to increase 30% by 2025.
04
Sustainability initiatives to cover 60% of chains by 2027.
05
AI menu optimization adoption to reach 40% of large outlets by 2026.
06
Tourism-driven growth expected at 8% post-2025 Olympics prep.
07
Premium coffee cafes to double to 20,000 by 2028.
08
Robot servers in 15% of outlets by 2026.
09
Zero-waste restaurants to reach 1,000 by 2027.
10
E-sports themed dining up 25% growth projected.
11
Home meal replacement competition to erode 10% market share.
12
Luxury segment CAGR 6.5% to 2030.
13
Regional expansion outside Seoul at 7% CAGR.
14
Alcohol-free venues to grow 18% annually.
15
Metaverse dining experiences pilot in 50 outlets by 2025.
16
Hyper-personalization via apps in 25% chains by 2025.
17
CAGR 5.3% for full-service to 2029.
18
Elderly dining segment +15% growth.
19
Cloud kitchen market 20 trillion KRW by 2027.
20
Halal foodservice to triple for tourism.
21
VR training for staff in 10% outlets.
22
Carbon-neutral chains target 30% by 2030.
Interpretation
Future Outlook Interpretation
While the traditional market grows steadily, South Korea’s dining scene is sprinting toward a future where your coffee is premium, your burger is plant-based, your order is hyper-personalized, your server might be a robot, and your guilt is assuaged by sustainability—all delivered by a fierce battle for your kitchen table.
03 · Category
Industry Segments27 stats
01
Full-service restaurants hold 45% market share by outlets, with 278,000 locations in 2023.
02
QSR chains like Lotteria operate over 1,500 outlets, capturing 15% of fast food segment.
03
Cafes number 85,000 nationwide, with Starbucks leading at 1,700 stores.
04
Chicken restaurants total 92,000, dominating QSR with 25% revenue share.
05
Delivery-only ghost kitchens grew to 12,000 in 2023, 2% of total outlets.
06
Bar and pub segment has 22,500 outlets, focused in Seoul with 40% concentration.
07
Buffet restaurants account for 3,200 outlets, generating 4.1 trillion KRW.
08
Bakery and dessert shops number 45,000, up 8% YoY.
09
Hotel foodservice outlets: 2,500, contributing 5.8 trillion KRW.
10
Traditional Korean restaurants (hanjeongsik) total 15,000, 2.4% market share.
11
Fast food segment has 150,000 outlets, 24% of total.
12
BBQ restaurants number 38,000, generating 22 trillion KRW.
13
Japanese cuisine outlets: 18,500, popular among youth.
14
Vegan-only restaurants grew to 450 in 2023.
15
Convenience store foodservice sales hit 18 trillion KRW.
16
Fine dining outlets: 1,200, with Michelin stars influencing 5% revenue.
17
Noodle houses total 25,000, low-price segment leader.
18
Franchise penetration at 32% in QSR.
19
Workplace canteens: 9,500, serving 1.2 million daily.
20
Chinese segment outlets 12,000, 42% revenue growth.
21
Pizza chains 2,800 outlets, Pizza School leader.
22
Soup/s stew houses 28,000 nationwide.
23
Franchise BBQ brands top 500 stores each.
24
School meal services cover 3.5 million students daily.
25
Hospital foodservice 1,800 units, steady growth.
26
Seafood restaurants 14,500, coastal concentration.
27
Casual dining 210,000 outlets, 34% share.
Interpretation
Industry Segments Interpretation
Full-service restaurants may have the most locations, but South Koreans' true dining devotion is a deliciously divided affair, fiercely split between the comforting sizzle of BBQ, the nation's chicken and coffee obsessions, and a relentless march toward convenience via delivery and franchises.
More related reading
04 · Category
Market Overview21 stats
01
In 2023, the total revenue of South Korea's foodservice industry reached approximately 180.5 trillion KRW, marking a 5.2% year-over-year growth driven by post-pandemic recovery and increased dining out.
02
The foodservice market in South Korea is projected to grow at a CAGR of 4.8% from 2024 to 2028, reaching 214.3 trillion KRW by 2028.
03
Full-service restaurants accounted for 42% of the total foodservice revenue in South Korea in 2022, generating 75.8 trillion KRW.
04
Quick-service restaurants (QSR) in South Korea saw a 7.1% revenue increase in 2023, totaling 52.4 trillion KRW.
05
The cafe and bar segment contributed 28.6 trillion KRW to South Korea's foodservice industry in 2023, up 6.3% from 2022.
06
Street food vendors generated 8.2 trillion KRW in 2022, representing 4.5% of the overall foodservice market share.
07
Total foodservice outlets in South Korea numbered 620,000 in 2023, a 1.8% increase from the previous year.
08
Per capita spending on foodservice in South Korea was 3.45 million KRW in 2023.
09
The industry's contribution to South Korea's GDP stood at 2.1% in 2022.
10
Foodservice inflation in South Korea averaged 4.7% in 2023, higher than the overall CPI.
11
Revenue per available seat projected to rise 3.2% annually to 2028.
12
Independent outlets comprise 78% of total, chains 22% in 2023.
13
Seoul accounts for 35% of national foodservice revenue at 63 trillion KRW.
14
The market saw 120,000 new outlets open between 2020-2023.
15
Export-oriented foodservice concepts grew 9% in revenue.
16
Non-alcoholic beverage sales in foodservice up 11% to 12.5 trillion KRW.
17
Total market value hit 185 trillion KRW in Q4 2023.
18
Growth slowed to 4.1% in H2 2023 due to economic pressures.
19
QSR revenue per outlet averaged 350 million KRW.
20
Cafe segment CAGR 5.5% 2023-2028.
21
Employment growth 2.3% to 2.85 million.
Interpretation
Market Overview Interpretation
The South Korean foodservice industry is racing toward a 214 trillion won future where, despite the relentless march of convenience with QSRs and cafes, the full-service restaurant stubbornly remains the king of the table, proving that even in a fast-paced world, the hunger for a proper sit-down meal is recession-proof and inflation-resistant.
05 · Category
Operational Metrics30 stats
01
Average annual revenue per foodservice outlet in South Korea was 291 million KRW in 2023.
02
Labor costs account for 32% of total operating expenses in restaurants.
03
Average employee turnover rate in foodservice is 28% annually.
04
Food cost percentage averages 35% of revenue across segments.
05
The industry employs 2.8 million people, 10.5% of total workforce in 2023.
06
Delivery sales represent 25% of total foodservice revenue, totaling 45 trillion KRW.
07
Average table turnover rate in full-service restaurants is 2.8 times per day.
08
Energy costs rose 15% YoY to 8% of expenses in 2023.
09
POS system adoption rate is 92% among outlets with over 10 seats.
10
Profit margins average 6.2% for independent restaurants, 9.1% for chains.
11
Online reservation usage grew to 35% of bookings in urban areas.
12
Waste generation per outlet averages 150kg/week, with recycling at 45%.
13
Average outlet size 120 sqm for full-service.
14
Minimum wage impact: 12% cost increase in 2023.
15
1.2 million part-time workers, 43% of employment.
16
Rent costs 18% of expenses in prime locations.
17
Peak hour sales 45% of daily revenue.
18
Supply chain costs up 9% due to imports.
19
Digital payment ratio 88% of transactions.
20
Staff training hours average 40/year per employee.
21
Utility costs 7.5% of revenue, LED adoption 65%.
22
Ghost kitchen revenue per unit 450 million KRW annually.
23
Avg operating hours 11.5/day for QSR.
24
Marketing spend 4% of revenue avg.
25
Female workforce 48%, up from 42% in 2020.
26
Inventory turnover 12 times/year.
27
Customer satisfaction score avg 4.2/5.
28
Peak season (summer) sales +22%.
29
Insurance costs 2.1% of expenses.
30
Menu item count avg 45 per outlet.
Interpretation
Operational Metrics Interpretation
A Korean restaurant owner must be a logistical ninja, balancing razor-thin margins against soaring delivery commissions, high turnover, and relentless costs, all while orchestrating a daily symphony of 2.8 table turns, 45 dishes, and 150kg of waste, just to capture 45% of their revenue in a few frantic peak hours.
Reference
Cite This Report
This report is designed to be cited. We maintain stable URLs and versioned verification dates. Copy the format appropriate for your publication below.
APA
Nathan Caldwell. (2026, February 13). South Korea Food Service Industry Statistics. Gitnux. https://gitnux.org/south-korea-food-service-industry-statistics
MLA
Nathan Caldwell. "South Korea Food Service Industry Statistics." Gitnux, 13 Feb 2026, https://gitnux.org/south-korea-food-service-industry-statistics.
Chicago
Nathan Caldwell. 2026. "South Korea Food Service Industry Statistics." Gitnux. https://gitnux.org/south-korea-food-service-industry-statistics.
Sources & references
32 datasets cited across this report · attribution is report-level