
Global social media ad spending is projected to reach $537.2 billion, with returns splitting sharply across platforms and industries. Meta reported Facebook and Instagram CPM averages of $7.19 and $9.50 in 2023, while CTRs stayed under 1% for most networks. The benchmarks in this guide track where attention turns into measurable results, including 78% of marketers reporting ROI improvement in 2023.
Key Takeaways
- Facebook ad CTR averaged 0.89% in 2023
- Global social commerce sales hit $992 billion in 2023, with China at 50% share
- AI-driven social commerce tools boosted conversion 30% for brands 2023
- Average engagement rate on Instagram posts was 0.50% in 2023
- Global influencer marketing spend $21.1B in 2023, with 49.4% ROI average
- In 2023, global social media advertising spend reached $207 billion, marking a 10.6% increase from 2022
- Global social media users numbered 4.95 billion in early 2024, up 252 million (+5.4%) from Jan 2023
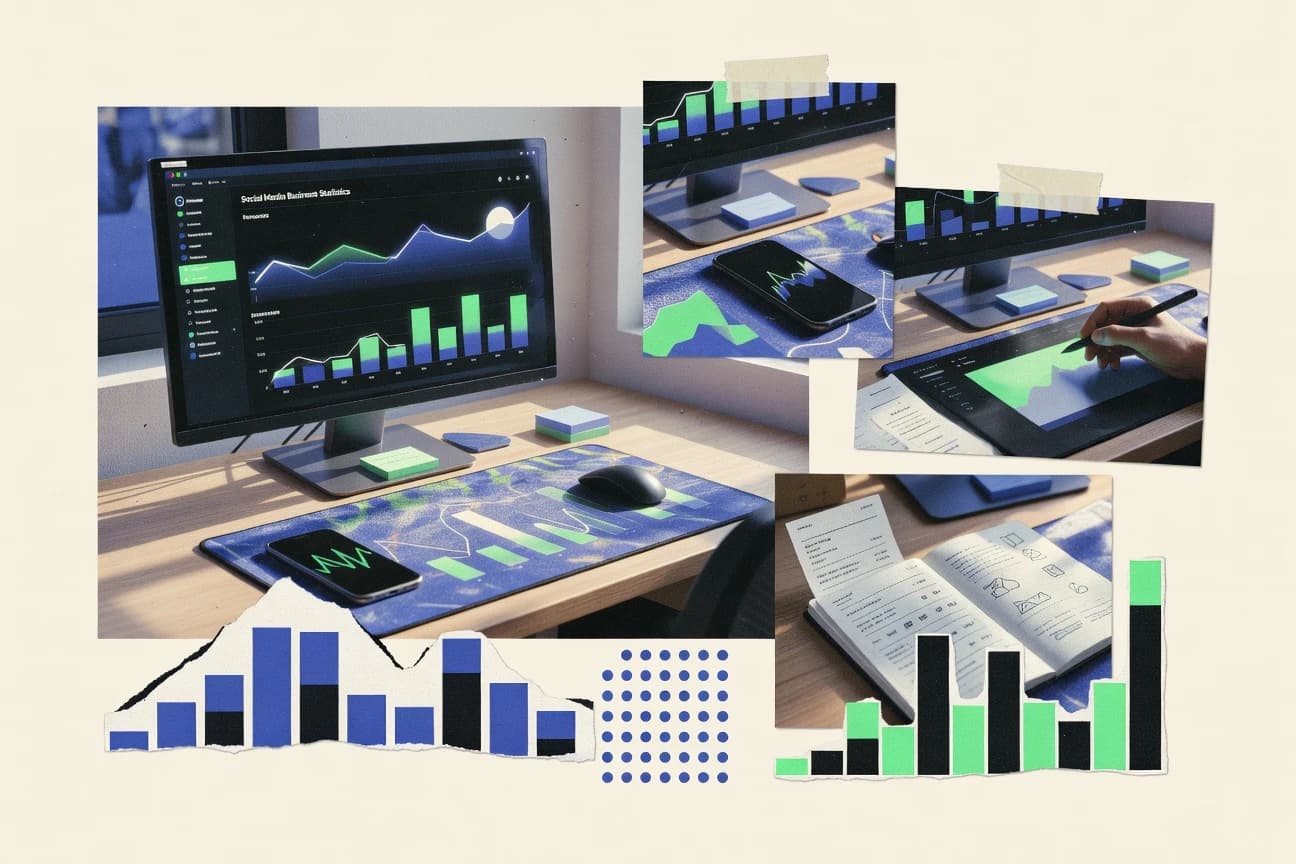
Social media business metrics show engagement and conversions rise when content is tailored to audience behavior.
Related reading
01 · Category
Advertising Performance15 stats
01
Facebook ad CTR averaged 0.89% in 2023
02
Instagram ad CTR was 0.78% average across industries in 2023
03
LinkedIn ad CTR for B2B reached 0.44% in 2023
04
TikTok ad CPC averaged $1.00-$1.50 in the US in 2023
05
YouTube trueview ad view rate was 25.5% in 2023
06
Snapchat ad ROAS averaged 2.5x for e-commerce in 2023
07
Pinterest promoted pin CTR hit 0.45% in 2023
08
Twitter (X) ad engagement rate 0.086% average in 2023
09
Meta platforms CPM averaged $7.19for Facebook and $9.50 for Instagram in 2023
10
78% of marketers say social ads ROI improved in 2023
11
Average social ad conversion rate 1.85% across platforms in 2023
12
LinkedIn sponsored content CPC $6.59average in 2023
13
TikTok Spark Ads boost organic reach by 64% on average in 2023
14
Facebook video ads completion rate 75% in 2023 benchmarks
15
Instagram carousel ads CTR 1.2% higher than single image in 2023
Interpretation
Advertising Performance Interpretation
The data suggests that while capturing attention on social media is akin to shouting into a digital hurricane, the marketers who skillfully navigate its chaotic currents are finding that a well-placed whisper, in the right ear and the right format, can actually turn a profit.
02 · Category
E-commerce and Sales15 stats
01
Global social commerce sales hit $992 billion in 2023, with China at 50% share
02
Instagram shopping drove $50 billion in sales for brands in 2023
03
TikTok Shop generated $20 billion GMV in 2023 globally
04
Facebook Marketplace transactions reached 1.2 billion items sold in 2023
05
Pinterest buyable pins facilitated $3 billion in sales 2023
06
45% of US shoppers bought via social media in past month 2023 survey
07
Snapchat e-commerce AR try-ons led to 20% purchase uplift 2023
08
YouTube Shopping affiliate sales up 40% in 2023
09
LinkedIn B2B social selling shortened sales cycles by 21% in 2023
10
Twitter (X) promoted products sales grew 15% via shop modules 2023
11
Global social commerce penetration expected 17% of e-com by 2025 from 6.5% 2023
12
70% of Instagram users turn to platform for product discovery 2023
13
TikTok live shopping sales hit $4.25 billion on Black Friday 2023
14
Facebook Shops used by 250 million monthly shoppers 2023
15
33% of social users have bought directly on platform 2023 global avg
Interpretation
E-commerce and Sales Interpretation
While China eats half the trillion-dollar social commerce pie, the rest of the world is furiously catching up, proving that whether it's Instagram's curated feeds, TikTok's live mania, or even LinkedIn's buttoned-up B2B chats, every scroll is now a potential shopping cart.
03 · Category
Emerging Trends15 stats
01
AI-driven social commerce tools boosted conversion 30% for brands 2023
02
Short-form video content share grew to 60% of social media time spent 2023
03
Metaverse social commerce projected $800 billion by 2024 from $50B 2023
04
52% of brands adopted AI for social content in 2023 survey
05
Web3 social platforms like Farcaster grew users 300% in 2023
06
Social audio (Clubhouse, Spaces) engagement down 70% post-2021 peak but podcasts up 20% 2023
07
65% of Gen Z prefer social search over Google in 2023
08
Decentralized social networks valued at $10B market cap 2023
09
SocialFi (social finance) apps like Friend.tech peaked 1M users Sept 2023
10
AR/VR social experiences used by 200M monthly users 2023 (Meta Horizon)
11
40% growth in social media sustainability campaigns 2023
12
Voice commerce via social assistants projected $40B by 2025 from $2B 2023
13
55% of marketers using UGC in ads 2023, up from 30% 2022
14
Social media NFT sales dropped 90% but utility NFTs up 50% 2023
15
Hybrid events via social live streams reached 500M views 2023
Interpretation
Emerging Trends Interpretation
It appears that our digital future will be less about scrolling in silence and more about conversing with AI shopkeepers in virtual worlds where Gen Z searches, brands chase sustainability, and the only thing plummeting faster than an NFT’s value is attention for social audio.
04 · Category
Engagement Metrics17 stats
01
Average engagement rate on Instagram posts was 0.50% in 2023
02
TikTok videos achieve 5.16% average engagement rate in 2023, highest among platforms
03
Facebook posts had 0.11% engagement rate on average for brands in 2023
04
LinkedIn posts see 0.45% engagement rate, best for B2B content in 2023
05
81% of consumers say social media influences their purchase decisions in 2023 survey
06
Average time spent on TikTok per user is 95 minutes daily in 2023
07
Instagram Stories reach 500 million DAUs, with 70% of stories featuring links in 2023
08
YouTube Shorts garnered 70 billion daily views in 2023
09
Twitter (X) average tweet engagement rate fell to 0.037% in 2023
10
Pinterest pins generate 2.3% click-through rate (CTR) on average for brands
11
44% of Instagram users shop weekly via the app in 2023
12
Snapchat AR filters used in 300 million Snaps daily in 2023
13
Facebook Reels engagement up 25% YoY, averaging 1.4% rate in 2023
14
LinkedIn video views grew 45% in 2023
15
Global average social media post frequency for brands is 5.2 posts/week in 2023
16
69% of consumers engage with brands via social media messaging
17
TikTok live streams averaged 2.5% conversion to purchases in 2023 e-com tests
Interpretation
Engagement Metrics Interpretation
In the frantic social media arena where TikTok is the charming, attention-grabbing star, Instagram the persistent shopkeeper, and Facebook the quiet cousin at the party, brands are learning that while engagement rates are a fickle currency, the real treasure lies in strategically choosing which platform will turn a casual scroll into a genuine conversation and, ultimately, a sale.
More related reading
05 · Category
Influencer Marketing15 stats
01
Global influencer marketing spend $21.1B in 2023, with 49.4% ROI average
02
75% of brands used TikTok influencers in 2023 campaigns
03
Instagram nano-influencers (<10k followers) yield 2.53% engagement rate in 2023
04
61% of consumers trust influencer recommendations over brand ads in 2023 survey
05
YouTube influencers drove $16ROI per $1 spent in 2023, highest platform
06
Average influencer post fee $100-$500 for micro-influencers on Instagram 2023
07
93% of marketers plan to increase influencer budgets in 2024 per 2023 survey
08
TikTok creator fund paid out $1 billion to influencers by 2023
09
LinkedIn influencers grew 20% in B2B engagement 2023
10
50% of Gen Z discovered products via influencers on social media 2023
11
Pinterest influencer collaborations up 30% in 2023
12
Snapchat Spotlight creators earned $10 million monthly average in 2023
13
Facebook Groups influencers drove 15% higher conversions 2023
14
Average brand-influencer campaign cost $10,000-$50,000 in 2023
15
4.17% average engagement for sponsored Instagram posts 2023
Interpretation
Influencer Marketing Interpretation
Even as brands realize that a nano-influencer's genuine post can be more valuable than a corporate ad budget, the industry is now a multi-billion dollar ecosystem where trust is the currency and every platform is vying to prove its return on investment.
06 · Category
Market Size and Revenue17 stats
01
In 2023, global social media advertising spend reached $207 billion, marking a 10.6% increase from 2022
02
Facebook's ad revenue in 2023 totaled $132 billion, accounting for over 63% of Meta's total revenue
03
TikTok's global ad revenue surged to $18 billion in 2023, up 100% year-over-year
04
Instagram generated $51.4 billion in ad revenue for Meta in 2023
05
Social media marketing industry valued at $153.3 billion in 2023, projected to grow to $255.8 billion by 2028 at CAGR of 10.8%
06
Snapchat's ad revenue hit $4.6 billion in 2023, with 70% from AR lenses and filters
07
LinkedIn's ad revenue grew 10% to $15 billion in 2023, driven by B2B marketing
08
YouTube's ad revenue reached $31.5 billion in 2023, with Shorts contributing 15%
09
Pinterest ad revenue increased 18% to $3.06 billion in 2023
10
Twitter (X) ad revenue declined 40% to $2.5 billion in 2023 post-rebranding
11
Global social commerce market size was $992 billion in 2023, expected to reach $2.9 trillion by 2026
12
Meta's total revenue from social platforms was $132 billion in 2023, 97% from ads
13
ByteDance's TikTok revenue hit $120 billion in 2023, with ads at 60%
14
Social media ad spend in the US alone was $62.3 billion in 2023
15
Influencer marketing industry valued at $21.1 billion in 2023, up 20% YoY
16
Reddit ad revenue jumped 42% to $804 million in 2023
17
Discord's monetization via Nitro subscriptions and ads reached $500 million in 2023
Interpretation
Market Size and Revenue Interpretation
Facebook and its siblings continue to hoard the lion's share of the digital ad gold, proving the family business is thriving, while TikTok charges ahead like an insatiable neon rocket, leaving a sputtering Twitter (X) in its dust and confirming that if your platform isn’t selling dreams, selfies, or goofy filters, you’re simply not in the conversation.
07 · Category
User Acquisition and Growth13 stats
01
Global social media users numbered 4.95 billion in early 2024, up 252 million (+5.4%) from Jan 2023
02
Facebook monthly active users (MAUs) stood at 3.05 billion in Q4 2023
03
YouTube had 2.5 billion MAUs in 2023, with 122 million daily Shorts views
04
Instagram reached 2 billion MAUs in 2023
05
TikTok's global downloads hit 3.5 billion lifetime by end-2023
06
WhatsApp had 2 billion MAUs in 2023
07
Snapchat daily active users (DAUs) averaged 414 million in Q4 2023, up 10% YoY
08
LinkedIn MAUs exceeded 1 billion in 2023
09
Twitter (X) MAUs dropped to 368 million in Q1 2024 from 540 million pre-acquisition
10
Pinterest MAUs grew to 498 million in Q4 2023, up 11% YoY
11
Reddit MAUs reached 267.5 million in Q4 2023, up 37% YoY
12
Time spent on social media globally averaged 2 hours 23 minutes daily in 2024
13
60.1% of the world's population used social media in early 2024
Interpretation
User Acquisition and Growth Interpretation
With over 60% of humanity now digitally gathered on platforms where attention is the only currency, the global town square is open for business—and business is booming—but your competitors are just one clever scroll away.
Reference
Cite This Report
This report is designed to be cited. We maintain stable URLs and versioned verification dates. Copy the format appropriate for your publication below.
APA
Marie Larsen. (2026, February 13). Social Media Business Statistics. Gitnux. https://gitnux.org/social-media-business-statistics
MLA
Marie Larsen. "Social Media Business Statistics." Gitnux, 13 Feb 2026, https://gitnux.org/social-media-business-statistics.
Chicago
Marie Larsen. 2026. "Social Media Business Statistics." Gitnux. https://gitnux.org/social-media-business-statistics.
Sources & references
54 datasets cited across this report · attribution is report-level