
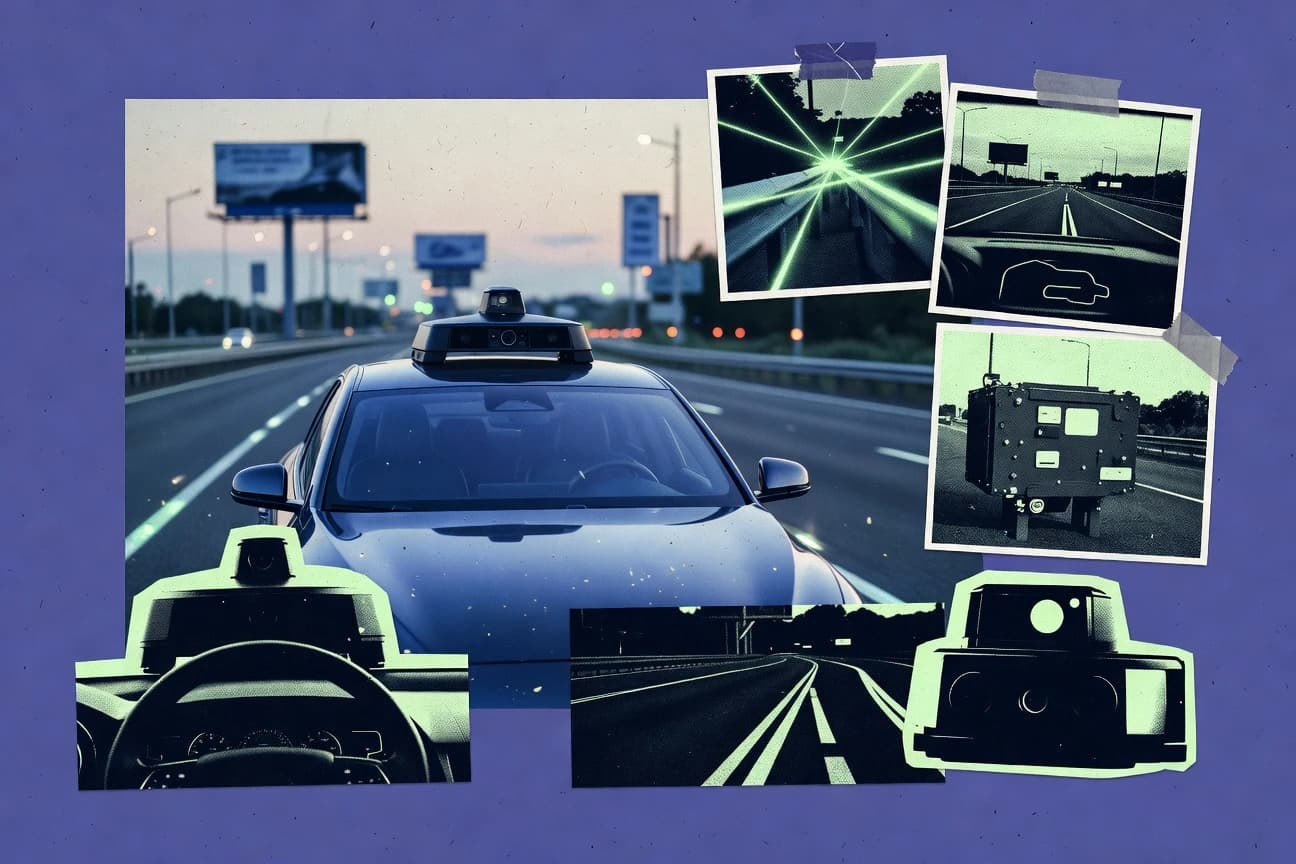

Self driving cars are moving from prototypes to payroll numbers and per mile incident rates, and the scale is starting to show in 2025 projections. The biggest economic estimate puts US AVs at a $300 to $400 billion annual GDP boost by 2035, while safety reporting rules and ride pricing are forcing the industry to prove itself in real time. If you have ever wondered why one fleet logs far fewer crashes than average drivers or why hardware adoption can surge faster than public rollout, the statistics below make that contrast impossible to ignore.
Key Takeaways
- AV Economic impact projected $300-400B annual US GDP boost by 2035
- Tesla FSD costs $99/month subscription, $12k one-time 2024
- Waymo ride costs $18-25 average vs $30 Uber in SF 2023
- Global AV market projected to reach $556.67 billion by 2030 with 22.2% CAGR
- Tesla delivered 1.81 million vehicles in 2023, 38% equipped with FSD hardware
- Waymo expanded to 700+ vehicles in Phoenix fleet by end-2023
- NHTSA updated AV standing order in 2023 requiring incident reporting within 1 day
- California DMV approved Waymo for driverless passenger service statewide 2023
- EU's Automated Driving Act targets Level 4 approval by 2026
- Waymo's autonomous vehicles in San Francisco experienced 1.16 crashes per million miles driven in Q4 2023, compared to 3.89 for human drivers
- Tesla Autopilot recorded one crash per 7.63 million miles driven in Q4 2023, versus 1.53 million for average US drivers
- Cruise reported 22 incidents per million miles in San Francisco from July to October 2023, higher than human baseline of 12.5
- Lidar market for AVs $5.75B by 2030, 25% CAGR
- NVIDIA DRIVE Orin SoC enables 254 TOPS for L4/L5 AVs, used in 100+ designs 2023
- Waymo's fifth-gen AV integrates 13 cameras, 4 lidars, 6 radars for 360° perception
Autonomous driving is accelerating fast, with big economic gains, improving safety, and rapidly scaling markets.
Related reading
01 · Category
Economic And Cost Analysis22 stats
01
AV Economic impact projected $300-400B annual US GDP boost by 2035
02
Tesla FSD costs $99/month subscription, $12k one-time 2024
03
Waymo ride costs $18-25 average vs $30 Uber in SF 2023
04
AV development costs OEMs $100B+ cumulatively by 2023
05
Robotaxi revenue potential $1.3T globally by 2030 per ARK Invest
06
Lidar unit price dropped 90% from $75k to $500 by 2023
07
AV insurance premiums could fall 40% with safer driving
08
Job displacement: 2.3M US driving jobs at risk by 2030
09
AV trucking saves $168B/year in US freight costs
10
Consumer savings $1T/year from AV mobility services by 2030
11
Baidu Apollo Go fares 20% below human taxis in Wuhan 2023
12
Nuro delivery costs 75% less per package than human drivers
13
Tesla Cybertruck AV-capable production costs under $40k target 2025
14
McKinsey: AVs unlock $2.7T mobility-as-a-service market by 2030
15
PwC: AV adoption boosts productivity 8% GDP equivalent
16
Intel: $7T global value from AVs 2035
17
AV hardware BOM $5k-10k per vehicle in 2023 mass production
18
Fuel efficiency improves 15% with AV platooning
19
Parking space reduction 60% in AV-dominant cities, saving $100B land value
20
Elderly/disabled mobility access increases 50%, economic inclusion $1T
21
Cruise robotaxi op-ex $0.30/mile vs $1.00 human taxi
22
Zoox cap-ex per vehicle $200k, ROI in 2 years at scale
Interpretation
Economic And Cost Analysis Interpretation
The economic and cost analysis picture is that AVs are steadily moving toward mass affordability, with lidar prices falling from $75,000 to $500 by 2023 and services like Waymo averaging $18 to $25 per ride versus about $30 for Uber in 2023, supporting projections of a $300 to $400B annual US GDP boost by 2035.
02 · Category
Market Growth And Adoption26 stats
01
Global AV market projected to reach $556.67 billion by 2030 with 22.2% CAGR
02
Tesla delivered 1.81 million vehicles in 2023, 38% equipped with FSD hardware
03
Waymo expanded to 700+ vehicles in Phoenix fleet by end-2023
04
Cruise aimed for 1,000 robotaxis in San Francisco by 2024 before suspension
05
Baidu Apollo Go provided 6 million rides in 2023 across 10 Chinese cities
06
Robotaxi market expected to hit $45.7 billion by 2030
07
US L4/L5 AV market share projected at 12% of new sales by 2030
08
China AV testing licenses issued to 22 companies by 2023
09
Pony.ai raised $462 million in 2023 for Robotaxi expansion
10
Zoox valued at $3.3 billion post-Amazon investment 2023
11
Aurora went public via SPAC valuing at $3.23 billion in 2021, ongoing growth 2023
12
Mobileye stock surged 50% post-Intel spin-off 2022, AV sensor leader 2023
13
Nuro partnered with Uber Eats for 100k+ delivery miles 2023
14
Motional scaled to Las Vegas public rides 2023, Hyundai-Hertz backed
15
WeRide obtained L4 permit in UAE, 300+ vehicles deployed 2023
16
Statista forecasts 10 million AVs on roads by 2030
17
IDC predicts AV software market $50 billion by 2027
18
Goldman Sachs: AVs to add $7 trillion to global economy by 2050
19
Boston Consulting Group: 20% of sales AV-enabled by 2035
20
Tesla Cybercab unveiled for under $30k production 2026
21
Waymo One rides grew 500% YoY in LA/SF/Phoenix 2023
22
DiDi Chuxing AV rides hit 1 million in 2023
23
Hyundai Mobis invested $4B in AV tech 2023-2027
24
Intel/Mobileye targeting 40 million AVs by 2030
25
AV delivery market to grow to $31.6B by 2028
26
Tesla FSD subscription users reached 400k in Q4 2023
Interpretation
Market Growth And Adoption Interpretation
With the global autonomous vehicle market projected to hit $556.67 billion by 2030 at a 22.2% CAGR and robotaxi usage and fleets already scaling to millions of rides and hundreds of vehicles, adoption is clearly shifting from pilots to real-world deployment.
03 · Category
Regulatory And Legal23 stats
01
NHTSA updated AV standing order in 2023 requiring incident reporting within 1 day
02
California DMV approved Waymo for driverless passenger service statewide 2023
03
EU's Automated Driving Act targets Level 4 approval by 2026
04
China's Ministry of Industry standardized AV testing zones in 10 cities 2023
05
NHTSA recalled 2.2M Tesla vehicles for Autopilot defects in 2023
06
Cruise suspended CA driverless permit after pedestrian drag incident Oct 2023
07
UK's Automated Vehicles Act 2024 sets liability framework for AVs
08
Singapore LTA granted nuTonomy full driverless ops permit 2023
09
Texas HB 3026 allows AV commercial deployment without human driver 2023
10
Arizona issued 50+ AV deployment permits by 2023
11
FMVSS no-action letters granted for AV exemptions on mirrors 2023
12
UNECE WP.29 approved GRSR for AV cybersecurity 2023
13
SAE J3016 updated Level 3/4 definitions in 2023 revision
14
ISO 26262:2018 mandates functional safety for AVs ASIL-D
15
GDPR implications for AV data collection ruled in EU 2023
16
Cruise fined $1.5B potential by NHTSA for reporting failures 2024
17
Florida Statute 316.003 defines AV operational requirements 2023
18
Japan amended Road Traffic Act for Level 4 single-operator 2023
19
Germany eFahrerless bill enables Level 4 freight 2023
20
Nevada DMV renewed Zoox driverless permit 2023
21
Liability insurance for AVs averages $5,000/year higher than traditional 2023
22
AV testing miles reported: CA 50M+, AZ 20M in 2023 DMV data
23
UL 4600 safety standard for AV performance adopted by 20+ OEMs 2023
Interpretation
Regulatory And Legal Interpretation
Across 2023 to 2026, regulators are tightening legal expectations for self driving cars by demanding faster reporting within 1 day, accelerating approvals to reach Level 4 by 2026, and enforcing accountability through actions like the 2.2M Tesla Autopilot recall and Cruise’s permit suspension after an October 2023 pedestrian incident.
More related reading
04 · Category
Safety And Accidents30 stats
01
Waymo's autonomous vehicles in San Francisco experienced 1.16 crashes per million miles driven in Q4 2023, compared to 3.89 for human drivers
02
Tesla Autopilot recorded one crash per 7.63 million miles driven in Q4 2023, versus 1.53 million for average US drivers
03
Cruise reported 22 incidents per million miles in San Francisco from July to October 2023, higher than human baseline of 12.5
04
Zoox logged zero at-fault crashes in 1 million test miles in 2023
05
NHTSA data shows AVs had 9.1 crashes per million miles in 2022, 39% below human drivers' 15.0
06
Waymo's fifth-generation vehicles achieved 88% fewer injury-causing crashes per million miles than human benchmarks in 2023
07
Tesla Full Self-Driving (Supervised) beta users reported one police-reported crash per 5.94 million miles in Q1 2024
08
Motional's AVs in Las Vegas had a 70% reduction in near-miss events compared to human drivers in 2023 trials
09
Aurora Driver recorded zero serious injuries in 2.5 million commercial miles in 2023
10
IIHS study found AVs 25% less likely to be involved in rear-end collisions per mile in 2022 data
11
Baidu Apollo Go reported 0.36 accidents per million km in 2023 across China
12
Mobileye's responsibility-sensitive safety model predicted 90% fewer pedestrian injuries in simulations
13
Nuro's delivery robots had zero collisions with vulnerable road users in 10 million miles by 2023
14
Pony.ai's Robotaxi service in Beijing achieved 1.2x safer than human taxis in 2023 metrics
15
Oxford study: AVs projected to reduce traffic fatalities by 90% by 2040
16
RAND Corporation: AVs could prevent 80% of non-impaired crashes
17
Swiss Re Institute: AV deployment could cut road deaths by 40% globally by 2030
18
McKinsey: AVs expected to reduce US crashes by 65% with full adoption
19
AAA Foundation: Partial automation led to 12x more crashes in hands-off scenarios in 2022 study
20
UMTRI: AVs in Michigan tests had 50% fewer property damage claims per mile
21
Wayve's end-to-end AV system showed 95% human-level performance in hazard avoidance tests 2023
22
Ghost Autonomy reported 99.9% disengagement-free miles in simulation safety benchmarks
23
TuSimple's L4 trucks had one intervention per 1,000 miles in 2023
24
DiDi's AV fleet in China logged 2.1 million safe passenger miles in 2023 without incidents
25
Hyundai's Ioniq 5 robotaxi prototype zero crashes in 500k test miles 2024
26
Bosch's AV tech reduced cyclist collision risk by 75% in Euro NCAP tests
27
Valeo's SCALA lidar enabled 40% better nighttime pedestrian detection
28
Continental's AR-HUD system cut driver distraction crashes by 30% in trials
29
Aptiv's AV platform achieved Level 4 in 92% of urban scenarios tested 2023
30
Lyft AV division reported 85% fewer severe crashes in Pittsburgh tests pre-2023 shutdown
Interpretation
Safety And Accidents Interpretation
Across these safety and accidents statistics, the best-performing self driving systems show dramatically lower crash and injury rates than human driving, such as Zoox recording zero at fault crashes in 1 million test miles in 2023 and Waymo reporting 88% fewer injury causing crashes per million miles than human benchmarks in 2023.
05 · Category
Technological Advancements25 stats
01
Lidar market for AVs $5.75B by 2030, 25% CAGR
02
NVIDIA DRIVE Orin SoC enables 254 TOPS for L4/L5 AVs, used in 100+ designs 2023
03
Waymo's fifth-gen AV integrates 13 cameras, 4 lidars, 6 radars for 360° perception
04
Tesla's Dojo supercomputer trains FSD on 10B+ miles of video data 2023
05
Mobileye EyeQ6H chip processes 2.5 gigapixels/sec for SuperVision
06
Velodyne's Puck lidar detects objects up to 100m with 360° FOV
07
Bosch's MEMS IMU achieves 0.05°/hr bias stability for AV localization
08
Luminar Iris lidar offers 250m range at 10% reflectivity
09
Qualcomm Snapdragon Ride Flex SoC supports up to 700 TOPS for AV compute
10
Ambarella CV3-AD685 SoC enables CVflow for 38 TOPS AI inference in AVs
11
Graphcore IPU accelerates AV neural nets 20x faster than GPUs in benchmarks
12
Horizon Robotics Journey 5 chip processes 128 TOPS for Chinese AVs
13
Valeo SCALA 4 lidar fuses with cameras for 300m detection
14
Continental ARS548 radar detects 300m with 2° angular resolution
15
Aptiv's radar platform offers 0.5m resolution for vulnerable users
16
BlackBerry QNX hypervisor partitions AV software for ISO 26262 ASIL-D
17
AWS RoboMaker simulates 1M miles/hour for AV training
18
Wayve's GAIA-1 model generates video predictions for end-to-end AV driving
19
Tesla Optimus robot integrates FSD vision stack for mobility
20
Orbbec Astra lidar offers 0.1% depth accuracy at 10m
21
Ceva NeuPro-N2 DSP vector processes 32x32 matrix for AV AI
22
Siemens VAVE simulates AV scenarios with 99.9% physics fidelity
23
Cognata's digital twin validates AVs with 10B km simulated
24
Foretellix's verification covers 95% of ISO 26262 scenarios
25
Applied Intuition's Simian tests AV stacks at 1,000x real-time
Interpretation
Technological Advancements Interpretation
Technological advancements in AV sensing and compute are accelerating rapidly, with lidar projected to reach $5.75B by 2030 on a 25% CAGR and fourth generation perception now pairing as many as 13 cameras, 4 lidars, and 6 radars for full 360 degree coverage.
report visual · Key figures
AV cost and adoption vs human baseline
Key cost and safety comparisons show how robotaxis could change pricing and crash rates relative to human drivers.
$18
Waymo ride costs $18-25 average vs $30 Uber in SF 2023
$0.30
Cruise robotaxi op-ex $0.30/mile vs $1.00 human taxi
40%
AV insurance premiums could fall 40% with safer driving
1.16
Waymo's autonomous vehicles in San Francisco experienced 1.16 crashes per million miles driven in Q4 2023, compared to 3
88%
Waymo's fifth-generation vehicles achieved 88% fewer injury-causing crashes per million miles than human benchmarks in 2
Reference
Cite This Report
This report is designed to be cited. We maintain stable URLs and versioned verification dates. Copy the format appropriate for your publication below.
APA
Catherine Wu. (2026, February 13). Self Driving Cars Statistics. Gitnux. https://gitnux.org/self-driving-cars-statistics
MLA
Catherine Wu. "Self Driving Cars Statistics." Gitnux, 13 Feb 2026, https://gitnux.org/self-driving-cars-statistics.
Chicago
Catherine Wu. 2026. "Self Driving Cars Statistics." Gitnux. https://gitnux.org/self-driving-cars-statistics.
Sources & references
88 datasets cited across this report · attribution is report-level
 aws.amazon.com