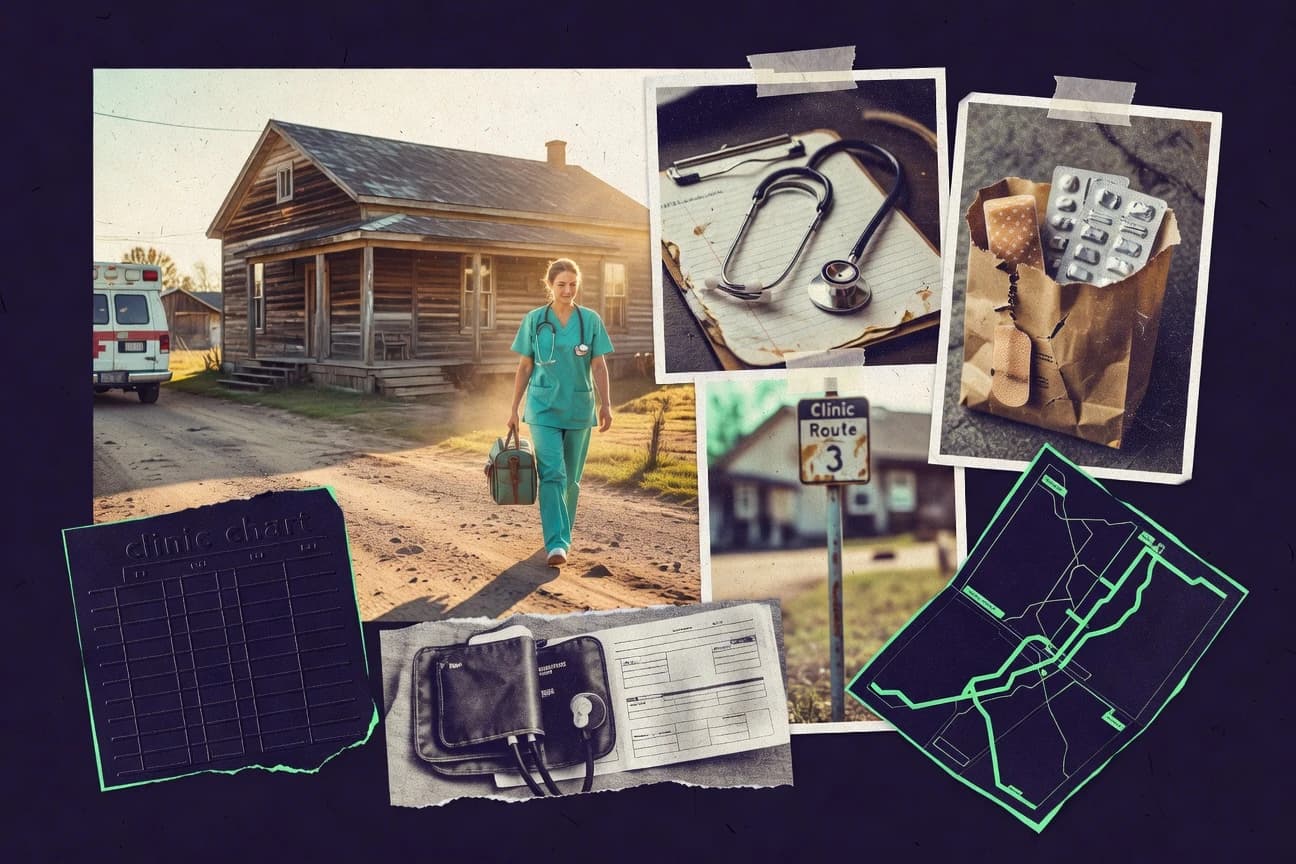

Rural Americans still face a healthcare reality measured in distance, shortages, and delays. In 2021, 19.3% of rural residents lacked health insurance while urban areas sat at 9.7%, and rural patients traveled an average of 17.2 miles to the nearest hospital. Add in provider gaps, facility closures, and longer waits for specialist care, and the picture that emerges is sharper than most people expect.
Key Takeaways
- In 2021, 19.3% of rural Americans lacked health insurance compared to 9.7% in urban areas
- Rural residents travel an average of 17.2 miles to reach the nearest hospital, double the 8.6 miles for urban residents
- Only 10.2% of primary care physicians practice in rural areas despite 20% of the U.S. population living there
- Rural hypertension prevalence is 49% vs. 45% urban adults
- 14.7% of rural adults have diagnosed diabetes vs. 12.2% urban
- Rural arthritis prevalence is 29.8% vs. 26.5% urban
- Rural age-adjusted mortality rate is 20% higher than urban at 607 vs. 505 per 100,000 in 2020
- Rural life expectancy is 2.8 years shorter, 77.3 vs. 80.1 years
- Rural opioid overdose death rate is 25% higher, 28.7 vs. 22.8 per 100,000 in 2021
- 18.5 primary care physicians per 10,000 rural residents vs. 53.3 urban
- Rural areas have 60.4 dentists per 100,000 vs. 92.1 urban
- Only 4.1 psychiatrists per 10,000 rural vs. 12.5 urban
- Rural suicide attempts are 1.5 times higher than urban rates
- 25% of rural adults report serious psychological distress vs. 18% urban
- Rural youth suicide rate is 2 times urban, 14.9 vs. 7.2 per 100,000
Rural Americans face major access gaps, from fewer providers and longer travel to higher uninsured rates.
Related reading
01 · Category
Access to Healthcare30 stats
01
In 2021, 19.3% of rural Americans lacked health insurance compared to 9.7% in urban areas
02
Rural residents travel an average of 17.2 miles to reach the nearest hospital, double the 8.6 miles for urban residents
03
Only 10.2% of primary care physicians practice in rural areas despite 20% of the U.S. population living there
04
24% of rural hospitals were at risk of closure in 2022 due to financial distress
05
Rural Medicare beneficiaries had 21% fewer mental health specialists within 60 miles compared to urban
06
15.4% of rural adults reported delaying care due to cost versus 11.2% urban in 2020
07
Rural areas have 39% fewer mammography facilities per 100,000 women than urban
08
Average wait time for specialist care in rural areas is 24 days longer than urban
09
28% of rural veterans face transportation barriers to VA care
10
Rural counties have 1.5 times fewer urgent care centers per capita
11
In 2019, 60% of rural Americans lived in dental health professional shortage areas
12
Rural ERs see 20% higher no-show rates for appointments
13
35% of rural hospitals lack obstetric services
14
Rural broadband coverage below 25 Mbps is only 65% versus 95% urban, impacting telehealth
15
42% of rural pharmacies closed between 2003-2021
16
Rural patients wait 50% longer for ambulance response times, averaging 15 minutes vs. 10 urban
17
Only 7% of rural areas have adequate public transportation for medical visits
18
Rural cancer screening rates for colorectal are 5% lower than urban
19
18% of rural diabetics lack access to endocrinologists within 30 miles
20
Rural opioid treatment programs cover only 40% of high-need areas
21
In 2020, rural telehealth utilization surged 154% but still lags urban by 20%
22
55% of rural hospitals operate without a full-time radiologist
23
Rural children have 12% fewer pediatricians per capita
24
30% of rural areas are maternity care deserts
25
Rural ER diversion rates are 3 times higher due to capacity issues
26
Only 25% of rural hospitals have cardiac catheterization labs
27
Rural vision care providers are 2.5 times scarcer per 100,000
28
22% of rural adults skip preventive care due to distance
29
Rural HIV testing sites are 60% fewer per capita
30
Rural hearing aid access is limited, with 70% traveling over 50 miles
Interpretation
Access to Healthcare Interpretation
Living amidst breathtaking open spaces, rural America endures a breathtaking lack of medical access, where one’s health outcomes are too often mapped by zip code rather than need.
02 · Category
Chronic Diseases23 stats
01
Rural hypertension prevalence is 49% vs. 45% urban adults
02
14.7% of rural adults have diagnosed diabetes vs. 12.2% urban
03
Rural arthritis prevalence is 29.8% vs. 26.5% urban
04
Rural COPD prevalence is 9.8% vs. 6.9% urban
05
Rural heart disease prevalence is 12.1% vs. 10.8% urban
06
27% of rural adults report poor or fair health vs. 20% urban
07
Rural kidney disease prevalence is 3.9% vs. 3.2% urban
08
Rural asthma prevalence among adults is 9.2% vs. 8.1% urban
09
Rural depression prevalence is 23% vs. 19% urban
10
Rural cancer incidence for lung is 10% higher
11
42% of rural adults are overweight or obese vs. 38% urban
12
Rural osteoporosis affects 15% of women over 50 vs. 12% urban
13
Rural Parkinson's disease prevalence is 1.2% vs. 1.0% urban
14
Rural multiple sclerosis rates are 20% higher in some regions
15
Rural gout prevalence is 5.1% vs. 4.3% urban men
16
Rural chronic pain affects 20.4% vs. 17.1% urban adults
17
Rural fibromyalgia diagnosis rate is 3.5% vs. 2.9% urban women
18
Rural thyroid disease prevalence is 12% vs. 10% urban
19
Rural celiac disease affects 1.5% vs. 1.2% urban population
20
Rural lupus prevalence is 0.8% vs. 0.6% urban women
21
21% of rural adults have high cholesterol vs. 18% urban
22
Rural sleep apnea prevalence is 15.2% vs. 13.8% urban
23
Rural IBS affects 11% vs. 9% urban adults
Interpretation
Chronic Diseases Interpretation
The rural health landscape isn't merely a statistic; it's a chronicle of systemic neglect where every category, from blood pressure to broken spirits, tells a story of harder living with far less care.
03 · Category
Health Outcomes and Mortality28 stats
01
Rural age-adjusted mortality rate is 20% higher than urban at 607 vs. 505 per 100,000 in 2020
02
Rural life expectancy is 2.8 years shorter, 77.3 vs. 80.1 years
03
Rural opioid overdose death rate is 25% higher, 28.7 vs. 22.8 per 100,000 in 2021
04
Rural heart disease death rate is 18% higher at 247 vs. 209 per 100,000
05
Rural cancer mortality is 15% higher for both men and women
06
Rural stroke death rate stands at 50.1 per 100,000 vs. 40.2 urban
07
Rural chronic lower respiratory disease mortality is 37% higher, 66.4 vs. 48.5 per 100,000
08
Rural suicide rate is 19.5 per 100,000 vs. 13.6 urban in 2021
09
Rural infant mortality rate is 6.2 per 1,000 births vs. 5.4 urban
10
Rural COVID-19 death rate was 20% higher during 2020-2021 peaks
11
Rural accidental injury death rate is 72.1 per 100,000 vs. 52.3 urban
12
Rural diabetes mortality is 12% higher at 28.9 vs. 25.8 per 100,000
13
Rural Alzheimer's disease death rate is 22% higher, 53.2 vs. 43.6 per 100,000
14
Rural maternal mortality ratio is 14.2 per 100,000 vs. 11.8 urban
15
Rural firearm death rate is 50% higher at 21.2 vs. 14.1 per 100,000
16
Rural septicemia mortality is 18% higher, 20.4 vs. 17.3 per 100,000
17
Rural hypertension-related deaths are 10% higher
18
Rural premature mortality (before age 75) is 16% higher
19
Rural motor vehicle crash death rate is 24.6 per 100,000 vs. 11.0 urban
20
Rural COPD hospitalization rates lead to 25% higher mortality post-discharge
21
Rural colorectal cancer 5-year survival is 63% vs. 66% urban
22
Rural drug poisoning death rate rose 425% from 1999-2020
23
Rural liver disease mortality is 30% higher at 25.4 vs. 19.5 per 100,000
24
Rural pneumonia mortality is 15% higher
25
Rural obesity prevalence is 31.5% vs. 29.2% urban, contributing to comorbidities
26
Rural smoking rate is 24% vs. 16% urban, linked to 80% higher lung cancer deaths
27
Rural physical inactivity rate is 27.1% vs. 23.4% urban
28
Rural obesity-related mortality accounts for 40% of excess deaths
Interpretation
Health Outcomes and Mortality Interpretation
The bucolic fantasy of rural life is statistically betrayed by a grim reality where the air is fresher but the lifespans are shorter, the communities tighter but the healthcare gaps wider, and the pace slower but the mortality rates alarmingly faster across virtually every major category of disease and despair.
More related reading
04 · Category
Healthcare Workforce and Resources22 stats
01
18.5 primary care physicians per 10,000 rural residents vs. 53.3 urban
02
Rural areas have 60.4 dentists per 100,000 vs. 92.1 urban
03
Only 4.1 psychiatrists per 10,000 rural vs. 12.5 urban
04
Rural nurse practitioners are 18.2 per 10,000 vs. 25.4 urban
05
21% of rural physicians are over age 65 vs. 15% urban
06
Rural hospitals employ 18% fewer nurses per bed
07
Only 11% of medical students choose rural practice
08
Rural EMS workforce turnover is 25% annually vs. 15% urban
09
70% of rural hospitals rely on contract labor for specialists
10
Rural physician assistants are 6.5 per 10,000 vs. 10.2 urban
11
Only 5% of residency programs are rural-based
12
Rural pharmacists per 10,000 is 8.1 vs. 11.4 urban
13
40% of rural health centers face staffing shortages
14
Rural optometrists are 4.2 per 10,000 vs. 7.1 urban
15
Rural physical therapists number 5.8 per 10,000 vs. 9.3 urban
16
55% of rural CRNAs provide anesthesia services
17
Rural dietitians are 2.1 per 10,000 vs. 4.5 urban
18
Only 3% of rural hospitals have full palliative care teams
19
Rural social workers per 10,000 is 12.4 vs. 18.7 urban
20
65% of rural areas are primary care health professional shortage areas
21
Rural OB-GYNs are 1.8 per 10,000 vs. 5.2 urban women
22
Rural turnover rate for hospital CEOs is 18% vs. 12% urban
Interpretation
Healthcare Workforce and Resources Interpretation
The data paints a bleakly comedic picture: the rural American healthcare system is essentially running on a skeleton crew of valiant, aging generalists who are desperately trying to cover for every missing specialist, while the support staff is perpetually revolving out the door.
05 · Category
Mental Health21 stats
01
Rural suicide attempts are 1.5 times higher than urban rates
02
25% of rural adults report serious psychological distress vs. 18% urban
03
Rural youth suicide rate is 2 times urban, 14.9 vs. 7.2 per 100,000
04
Only 20% of rural areas have adequate mental health providers
05
Rural depression treatment gap is 40% unserved
06
Rural substance use disorder treatment access covers 50% less than urban
07
30% of rural farmers report high stress levels leading to anxiety
08
Rural PTSD prevalence among veterans is 18% vs. 14% urban
09
Rural elderly loneliness affects 35% vs. 25% urban
10
Rural bipolar disorder diagnosis is 2.1% vs. 1.8% urban
11
Rural schizophrenia prevalence is 1.1% with 60% untreated
12
Rural anxiety disorders affect 19% vs. 16% urban adults
13
45% of rural physicians report burnout vs. 38% urban
14
Rural teen mental health crisis calls rose 25% post-COVID
15
Rural eating disorder rates are 8% vs. 6% urban young women
16
Rural ADHD diagnosis in children is 10.2% vs. 9.5% urban
17
Rural autism spectrum services reach only 30% of needs
18
Rural dementia caregiving burden is 28% higher
19
22% of rural adults use illicit drugs vs. 19% urban
20
Rural alcohol use disorder prevalence is 7.5% vs. 6.8% urban
21
Rural telepsychiatry fills only 15% of mental health gaps
Interpretation
Mental Health Interpretation
The statistics paint a grimly ironic portrait: rural America is being psychologically hollowed out, not by a lack of strength, but by a systemic and devastating scarcity of the care its people desperately need and deserve.
Reference
Cite This Report
This report is designed to be cited. We maintain stable URLs and versioned verification dates. Copy the format appropriate for your publication below.
APA
Rachel Svensson. (2026, February 13). Rural Health Statistics. Gitnux. https://gitnux.org/rural-health-statistics
MLA
Rachel Svensson. "Rural Health Statistics." Gitnux, 13 Feb 2026, https://gitnux.org/rural-health-statistics.
Chicago
Rachel Svensson. 2026. "Rural Health Statistics." Gitnux. https://gitnux.org/rural-health-statistics.
Sources & references
65 datasets cited across this report · attribution is report-level