In today’s increasingly competitive business landscape, understanding and optimizing revenue metrics is more essential than ever before. As a vital component of measuring a company’s financial health, these metrics provide valuable insights into its overall performance and growth potential. This blog post delves deep into the world of revenue metrics, discussing their importance, various types, and how to effectively analyze them in order to make informed decisions and drive lasting success. Whether you are an entrepreneur, a C-level executive, or a budding finance professional, this comprehensive guide will equip you with the knowledge and tools necessary to elevate your business and maximize profitability.
Revenue Metrics You Should Know
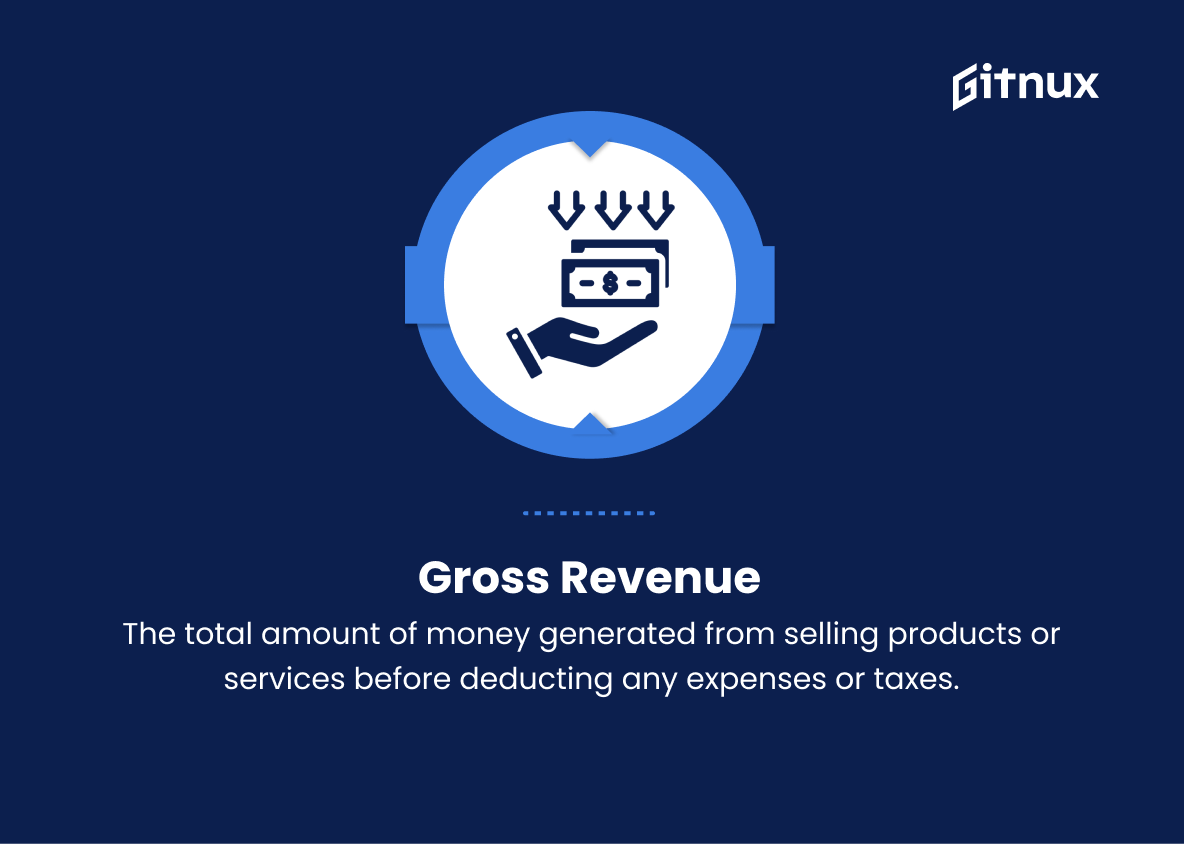
1. Gross Revenue
The total amount of money generated from selling products or services before deducting any expenses or taxes.
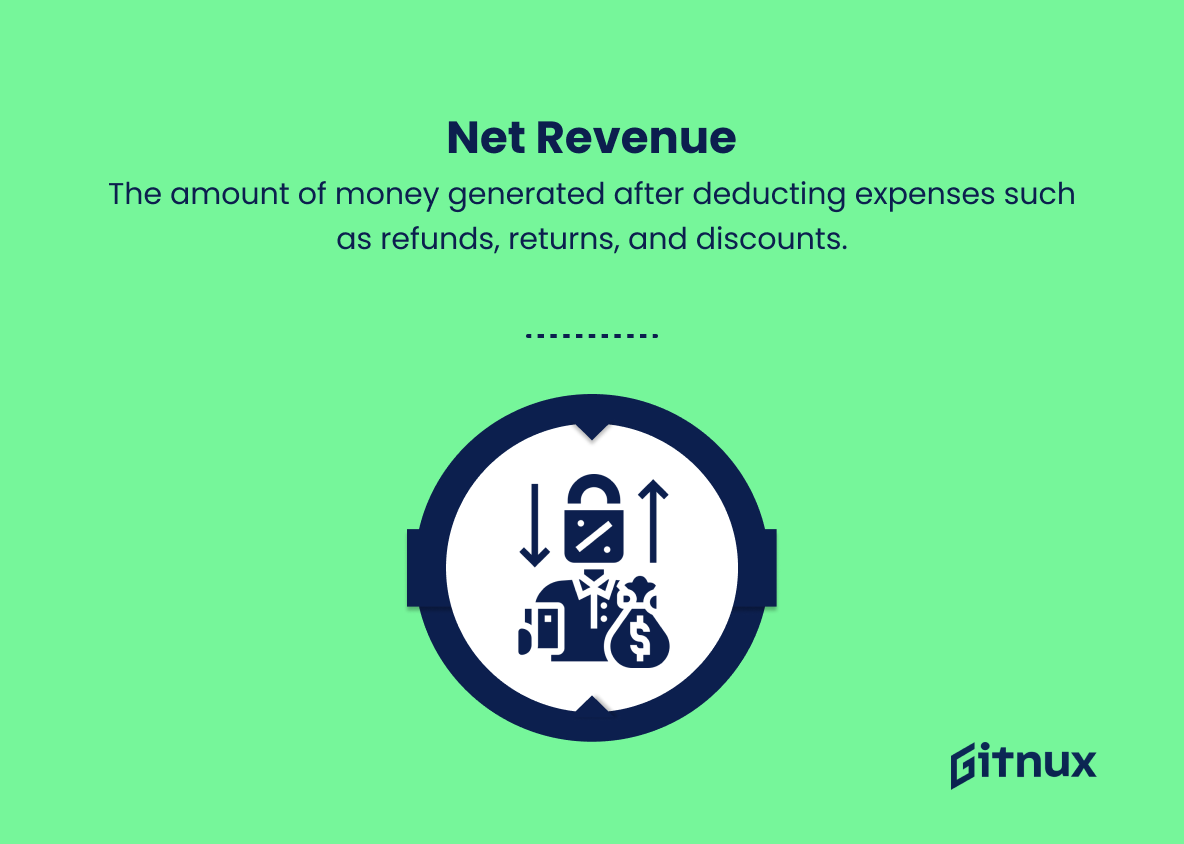
2. Net Revenue
The amount of money generated after deducting expenses such as refunds, returns, and discounts.
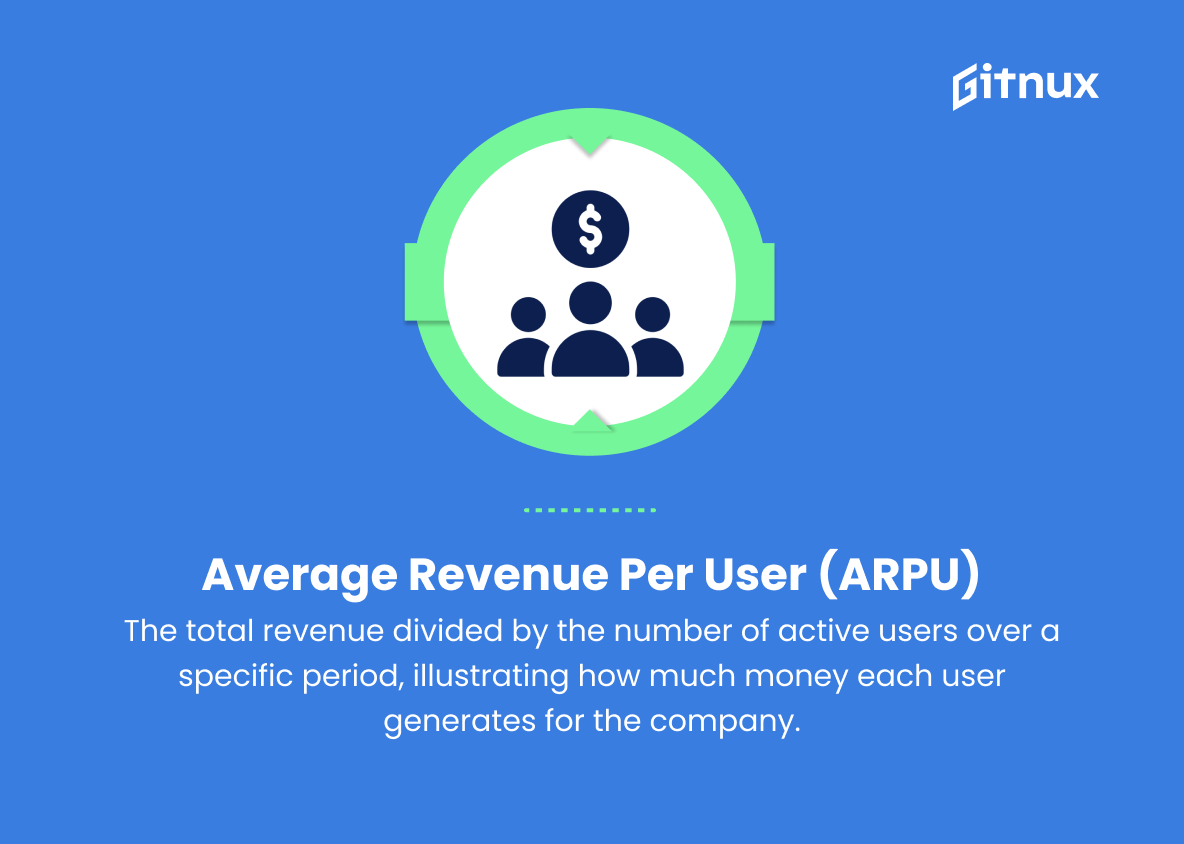
3. Average Revenue Per User (ARPU)
The total revenue divided by the number of active users over a specific period, illustrating how much money each user generates for the company.
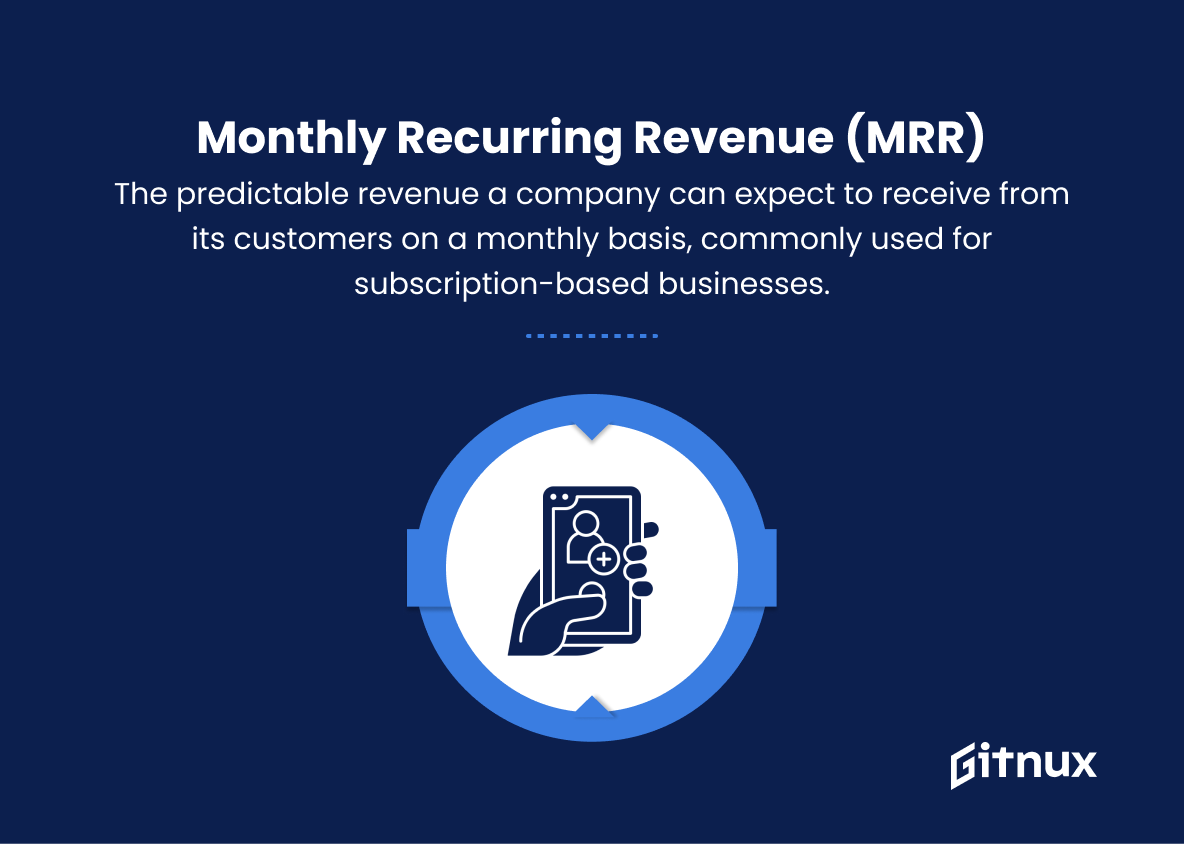
4. Monthly Recurring Revenue (MRR)
The predictable revenue a company can expect to receive from its customers on a monthly basis, commonly used for subscription-based businesses.
5. Annual Recurring Revenue (ARR)
The annual equivalent of MRR, showing the total amount of predictable revenue a company can expect to receive in a year.
6. Revenue Growth Rate
The percentage increase in revenue over a specific period, indicating the rate at which the company is growing.
7. Revenue per Employee
The total revenue divided by the number of employees, showcasing the efficiency and productivity of the workforce.
8. Customer Lifetime Value (CLV)
The total net profit a company can expect to generate from a customer during their entire relationship with the business.
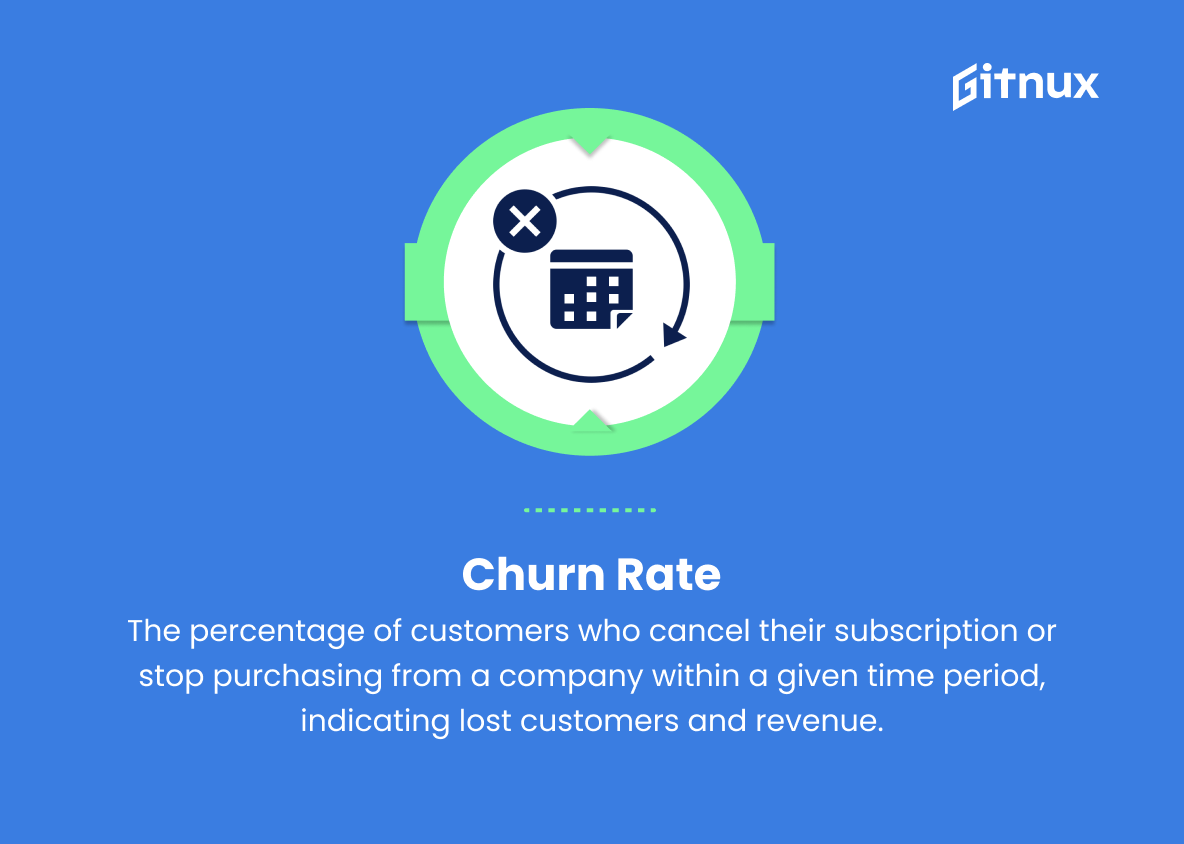
9. Churn Rate
The percentage of customers who cancel their subscription or stop purchasing from a company within a given time period, indicating lost customers and revenue.
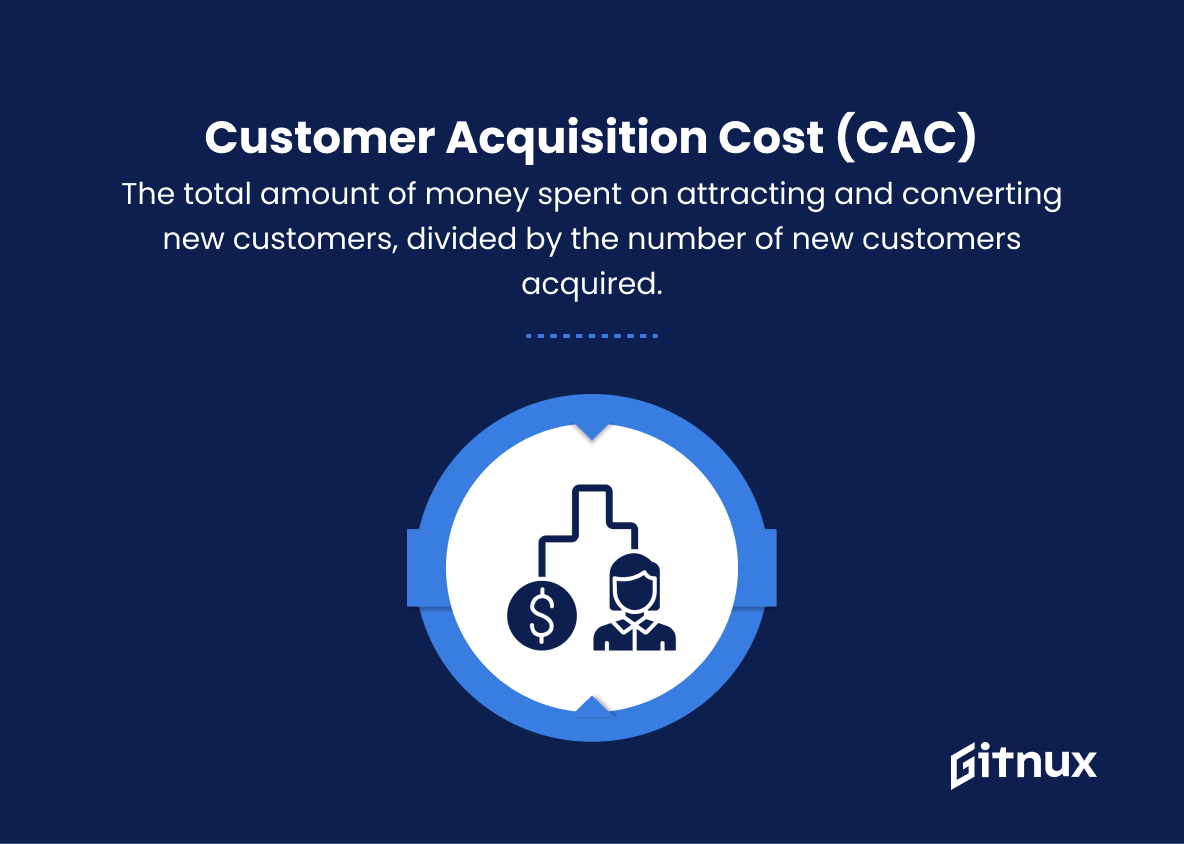
10. Customer Acquisition Cost (CAC)
The total amount of money spent on attracting and converting new customers, divided by the number of new customers acquired.
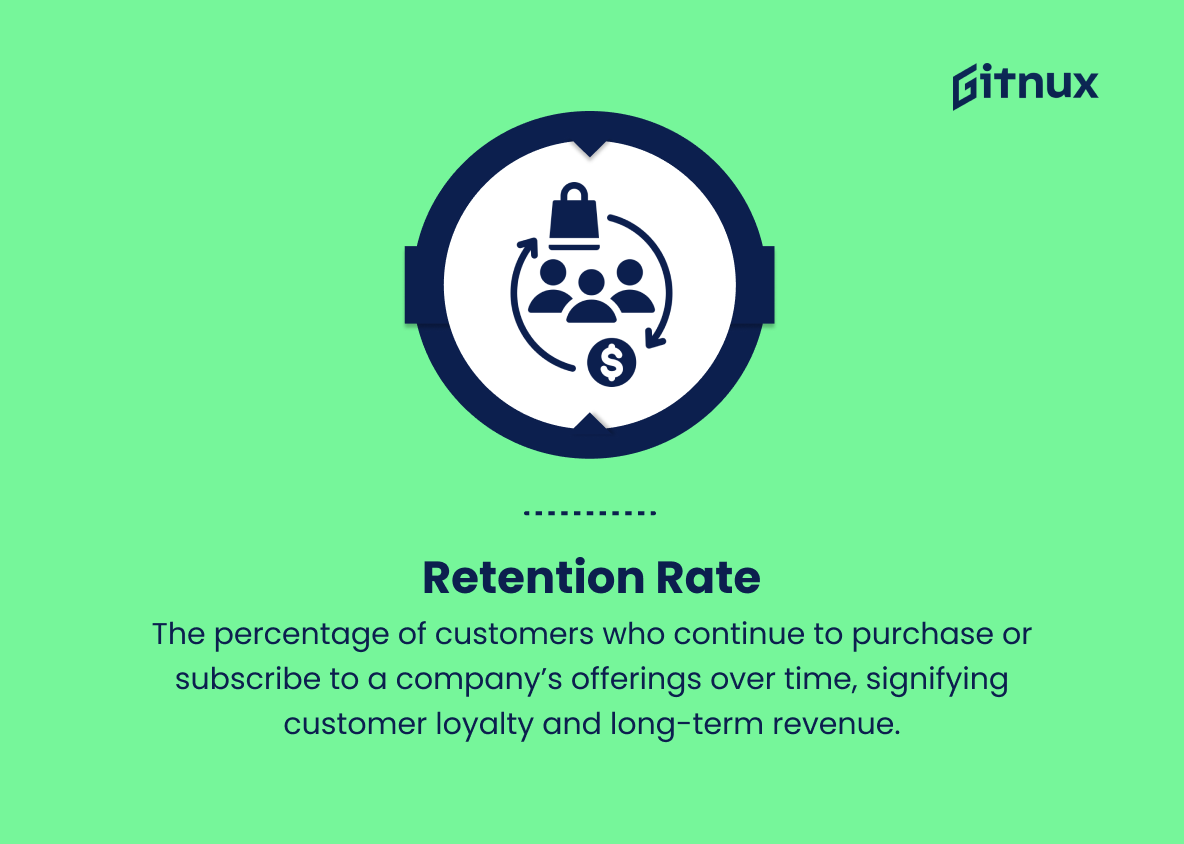
11. Retention Rate
The percentage of customers who continue to purchase or subscribe to a company’s offerings over time, signifying customer loyalty and long-term revenue.
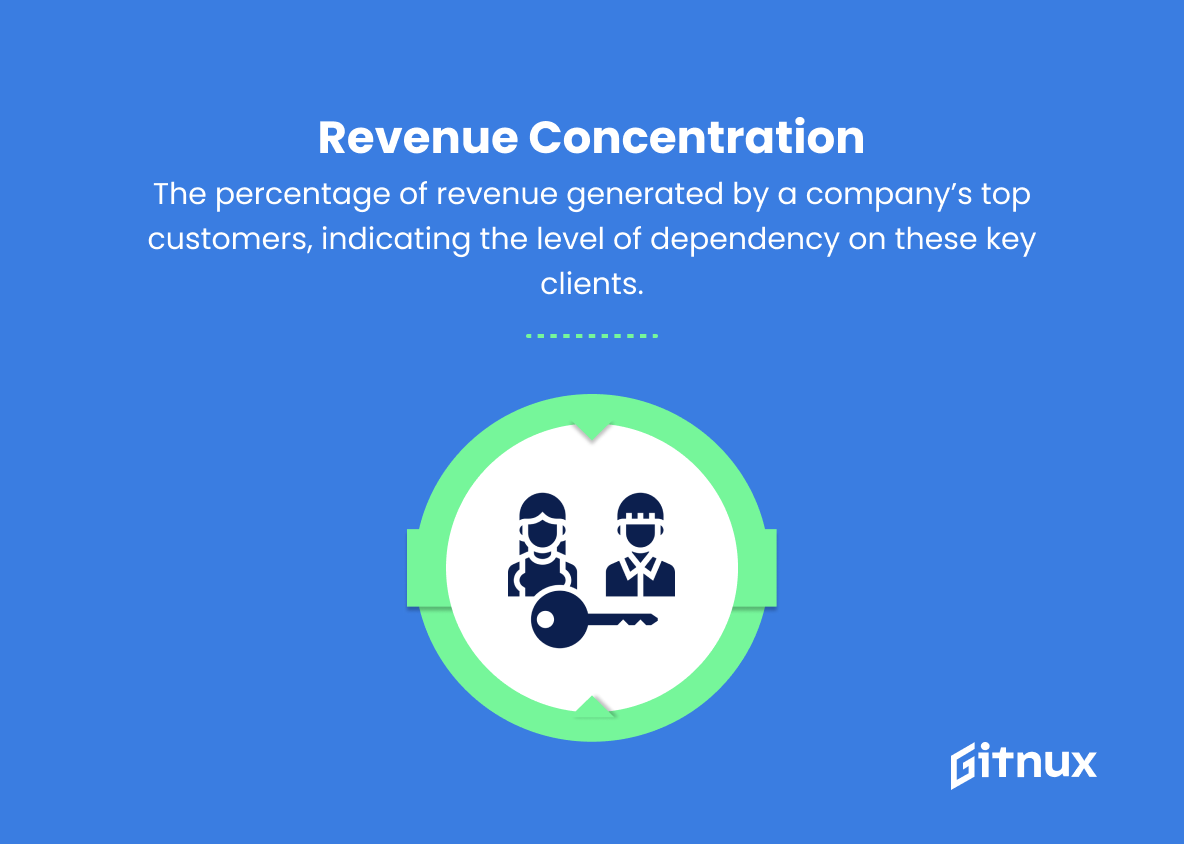
12. Revenue Concentration
The percentage of revenue generated by a company’s top customers, indicating the level of dependency on these key clients.
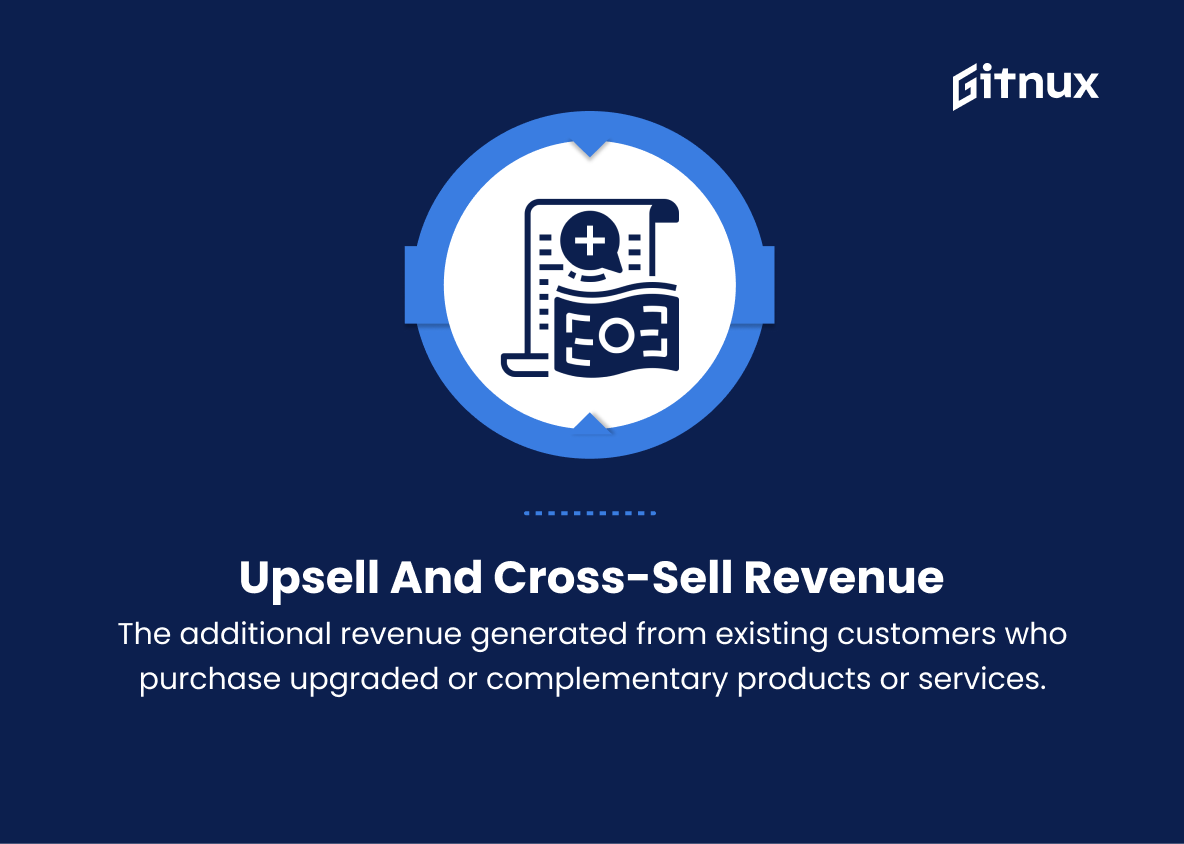
13. Upsell and Cross-Sell Revenue
The additional revenue generated from existing customers who purchase upgraded or complementary products or services.
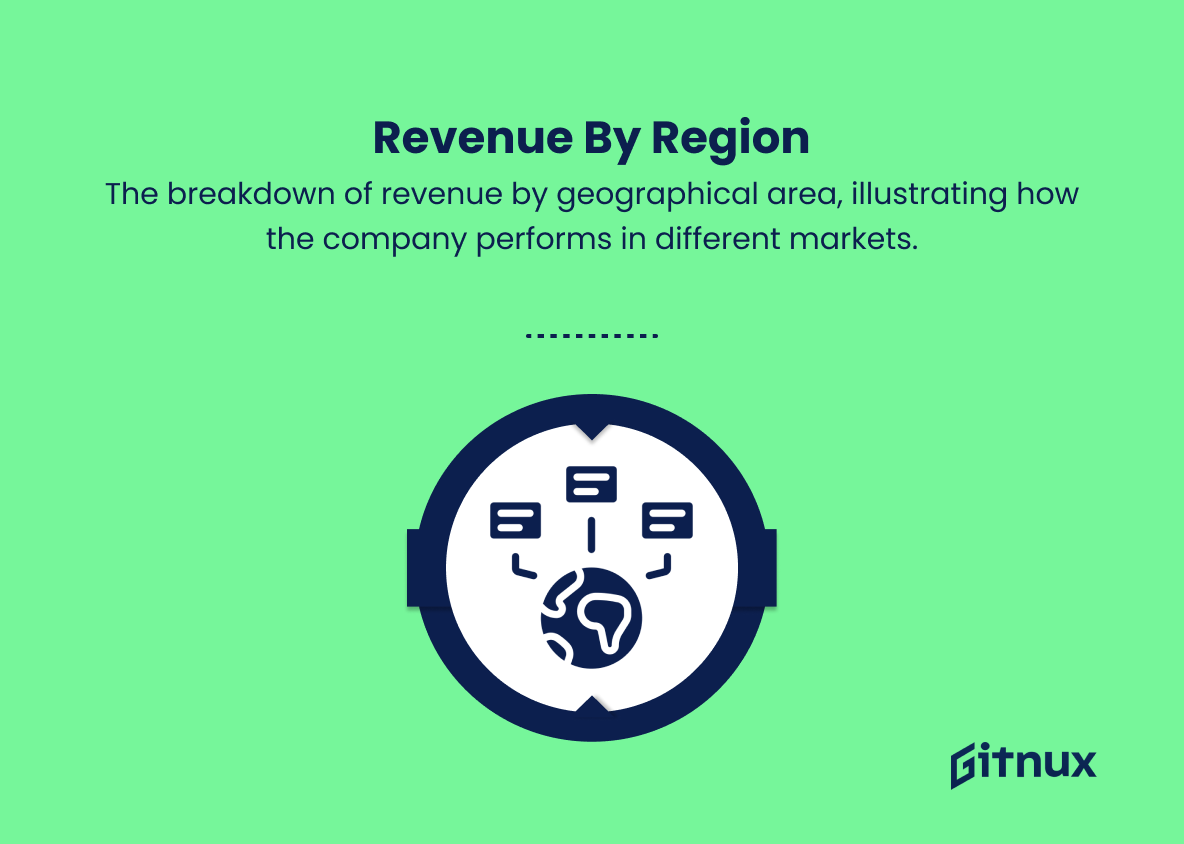
14. Revenue by Region
The breakdown of revenue by geographical area, illustrating how the company performs in different markets.
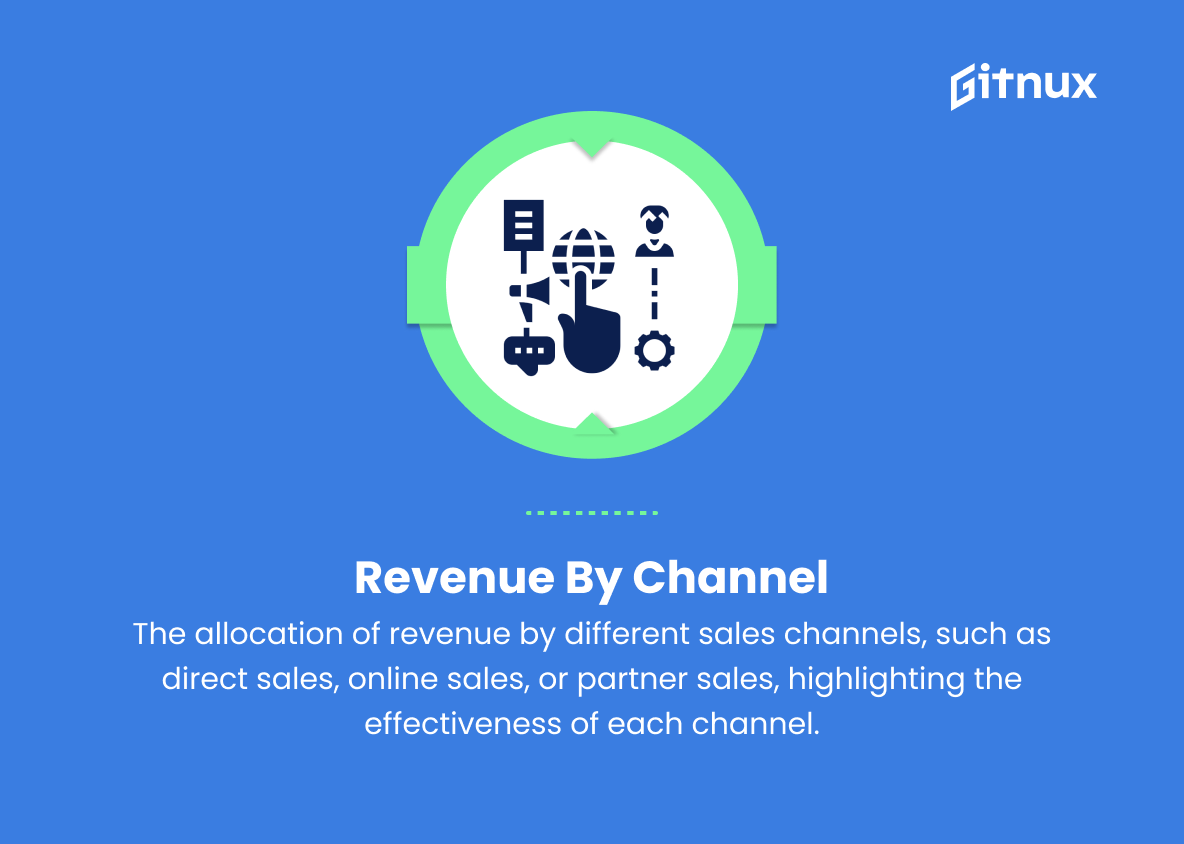
15. Revenue by Channel
The allocation of revenue by different sales channels, such as direct sales, online sales, or partner sales, highlighting the effectiveness of each channel.
16. Revenue by Product or Service
The division of revenue by each product or service offering, showcasing the most profitable areas of the company.
17. Revenue per Lead
The total revenue divided by the number of leads generated, illustrating the overall quality and potential value of each lead.
18. Cost of Goods Sold (COGS)
The costs directly associated with producing a product or providing a service, affecting the profitability and margins of the company.
Revenue Metrics Explained
Revenue metrics are essential indicators for businesses to monitor their financial performance and make informed decisions. Gross Revenue provides an overview of the total amount generated, while Net Revenue takes into account the expenses, helping businesses evaluate their profitability. Metrics such as ARPU, MRR, and ARR give insights into user value and overall revenue stability. Monitoring revenue growth rate and revenue per employee promote efficiency and productivity assessments. CLV, Churn rate, and Retention Rate enable businesses to understand customer loyalty and long-term revenue.
CAC helps evaluate the cost-effectiveness of customer acquisition strategies while Revenue Concentration identifies dependency on key clients. Upsell and Cross-Sell Revenue help maximize customer value, while Revenue by Region, Channel, Product or Service, and Lead provide granular insights into performance and sales opportunities. Lastly, the Cost of Goods Sold directly impacts the profitability and margins of a business, underlining its significance in the overall revenue analysis. By evaluating these metrics, companies can optimize their strategies and ensure sustained growth and success.
Conclusion
In conclusion, it’s evident that understanding and tracking revenue metrics is an essential aspect of running a successful business. By focusing on key performance indicators, such as Monthly Recurring Revenue (MRR), Customer Lifetime Value (CLV), and Churn Rate, businesses can gain valuable insights into their financial health and make data-driven decisions for further growth.
To remain competitive and foster a thriving business environment, it’s essential for entrepreneurs to constantly monitor revenue metrics, making adjustments as necessary to improve efficiency and effectiveness. Remember, a profitable business is one that pays close attention to the numbers, and effectively employing these revenue metrics will help to ensure a stable, successful future for your company.
