In today’s rapidly evolving real estate market, it is crucial for investors to have a firm understanding of the key metrics that drive successful decision-making. These metrics not only provide valuable insights into the performance and potential of various real estate investments but also equip investors with the knowledge necessary to manage risk and optimize returns.
In this comprehensive blog post, we will delve into the most critical real estate investment metrics, offering a thorough understanding of their importance, how they are calculated, and how to leverage them to make informed investment choices. Whether you are a seasoned investor or just beginning your real estate journey, this essential knowledge will serve as a foundation for a more robust and profitable investment strategy. So, let’s dive in and explore the world of real estate investment metrics.
Real Estate Investment Metrics You Should Know
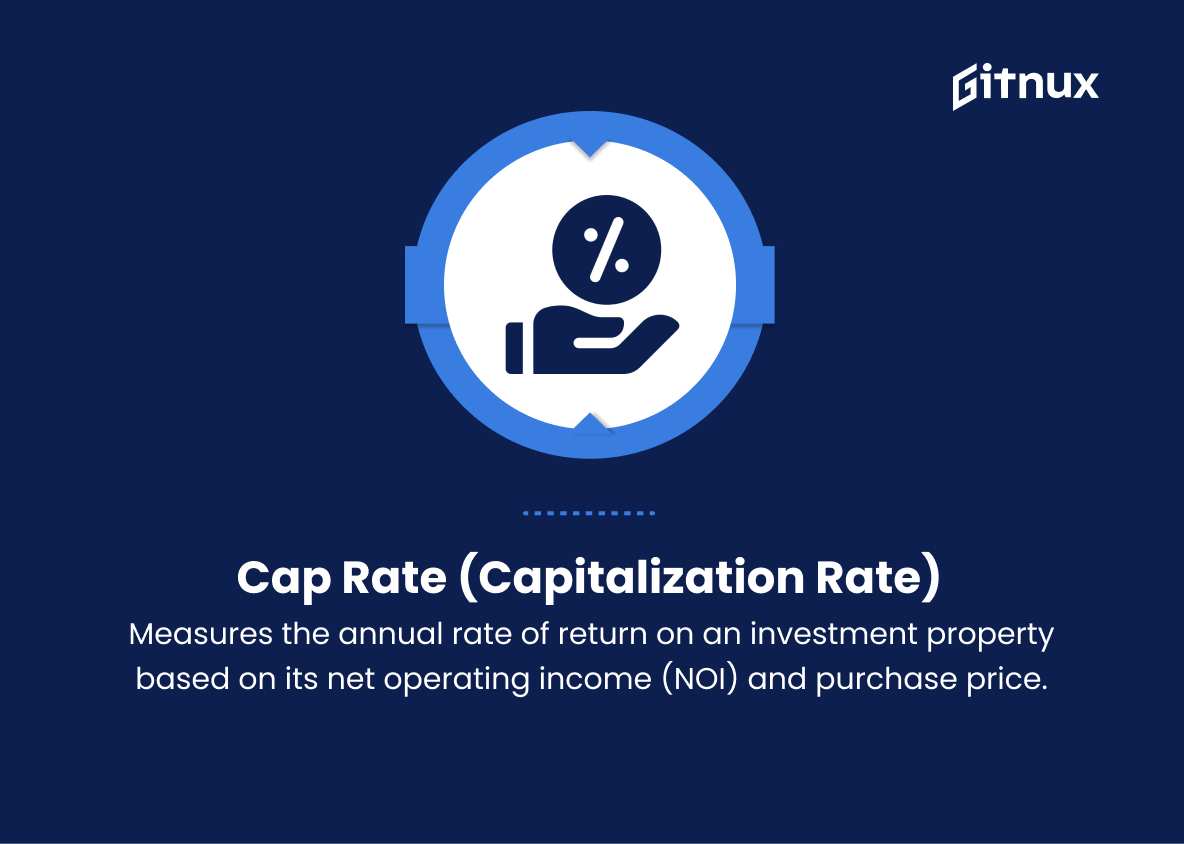
1. Cap Rate (Capitalization Rate)
Measures the annual rate of return on an investment property based on its net operating income (NOI) and purchase price. It is calculated by dividing NOI by the property’s purchase price.
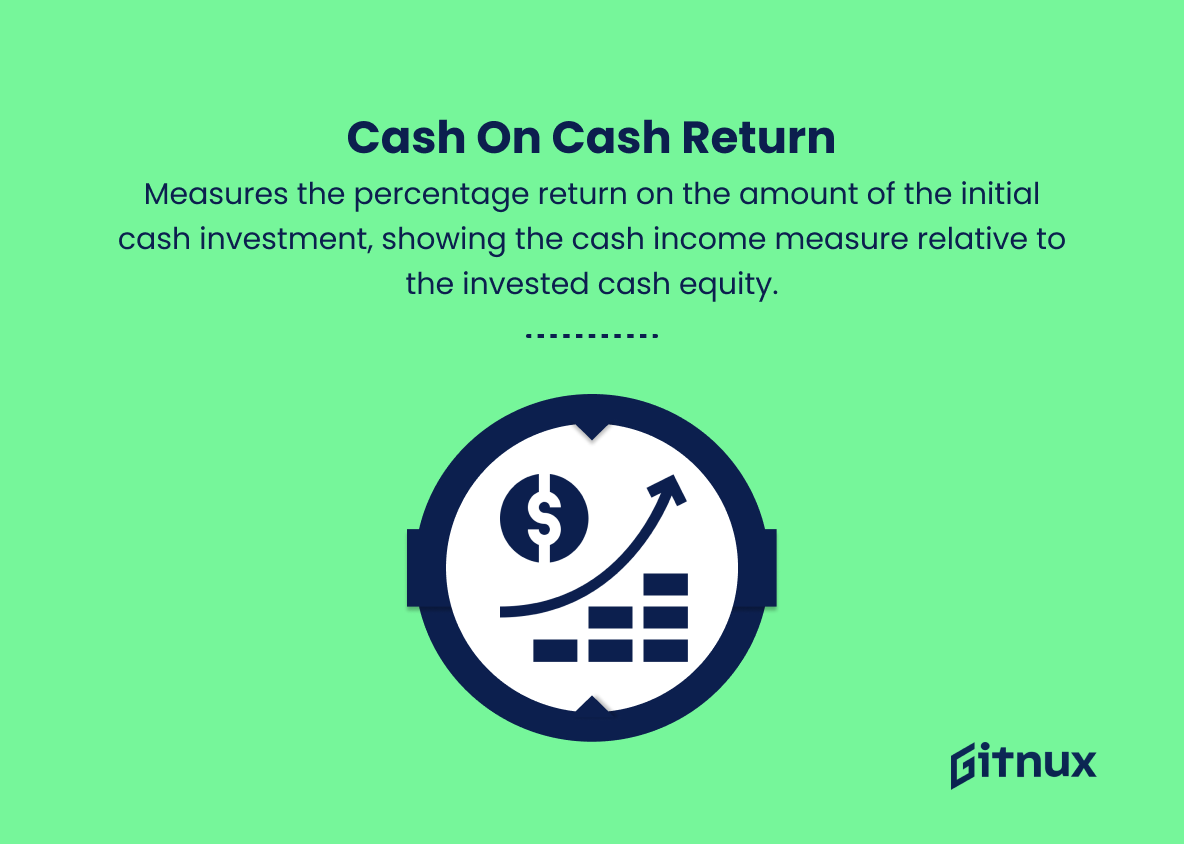
2. Cash on Cash Return
Measures the percentage return on the amount of the initial cash investment, showing the cash income measure relative to the invested cash equity. It is calculated by dividing the annual pre-tax cash flow by the total cash invested.
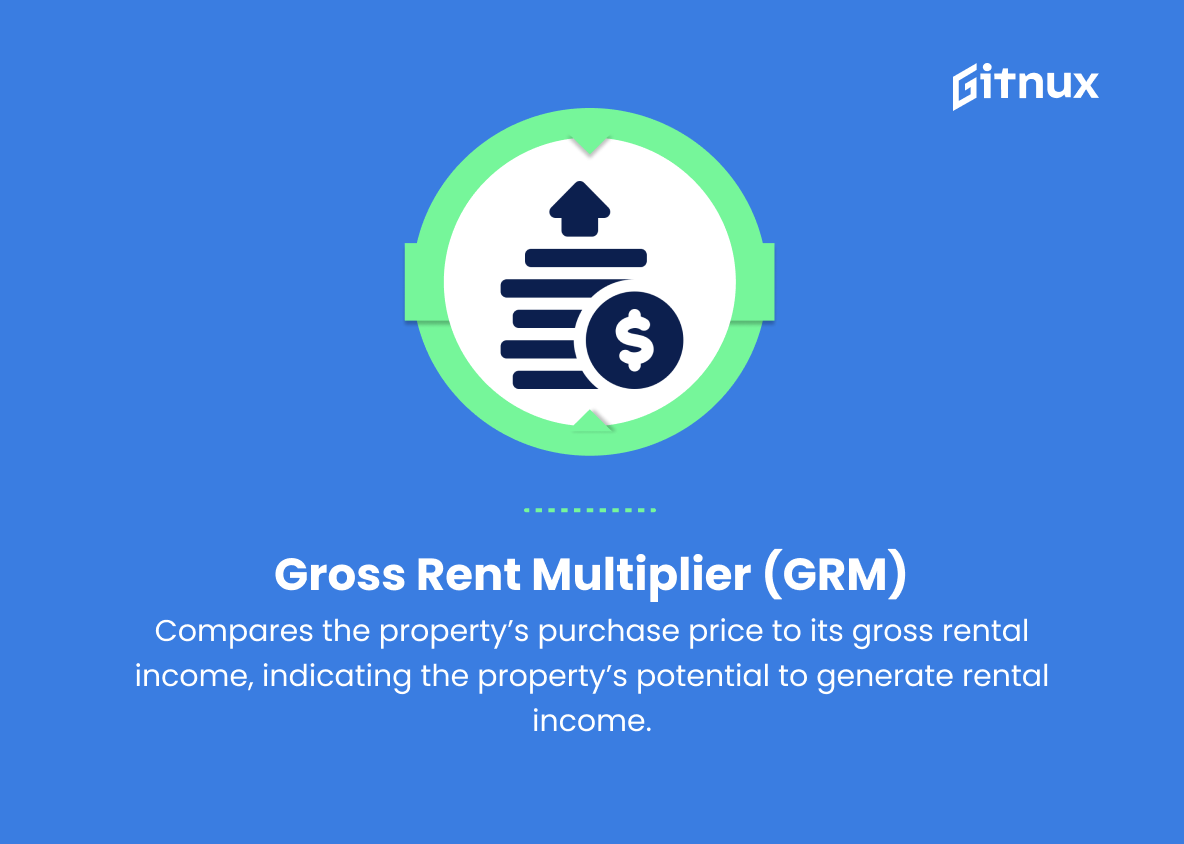
3. Gross Rent Multiplier (GRM)
Compares the property’s purchase price to its gross rental income, indicating the property’s potential to generate rental income. It is calculated by dividing the purchase price by the annual gross rental income.
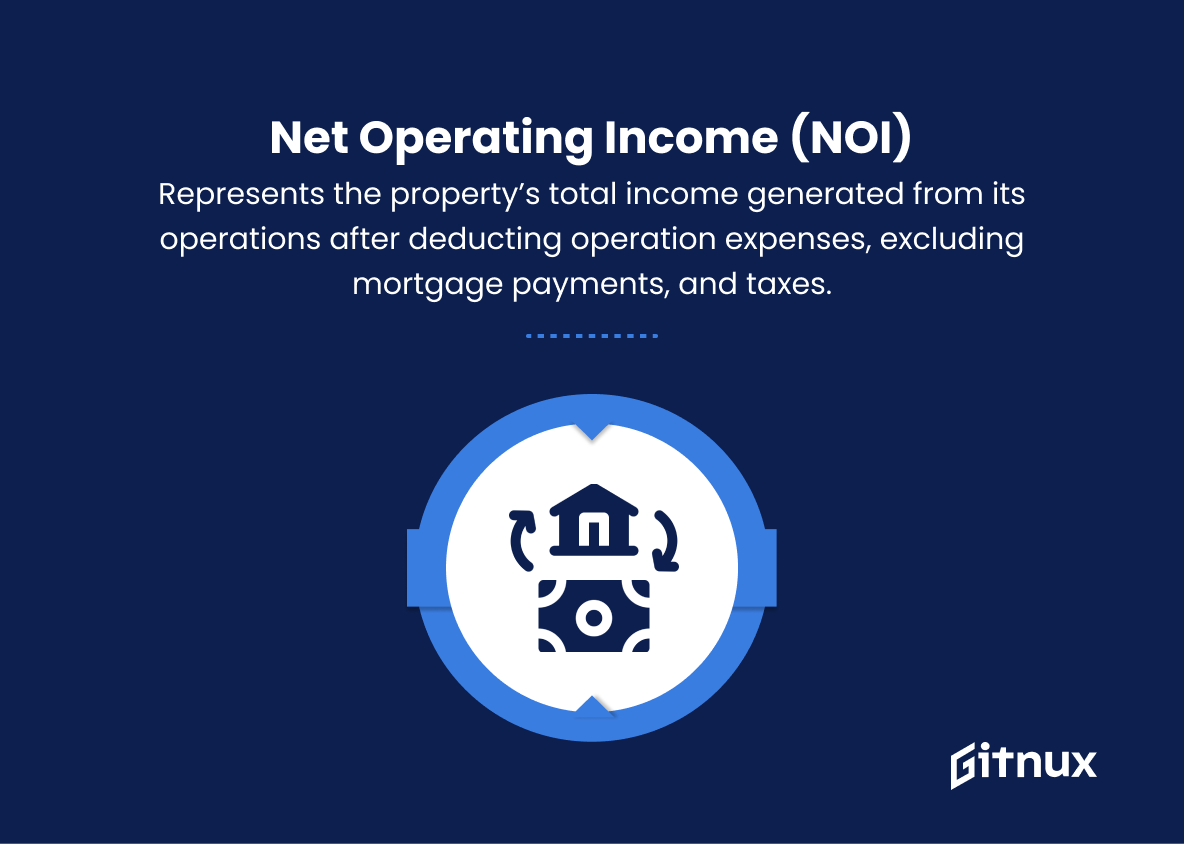
4. Net Operating Income (NOI)
Represents the property’s total income generated from its operations after deducting operation expenses, excluding mortgage payments, and taxes.
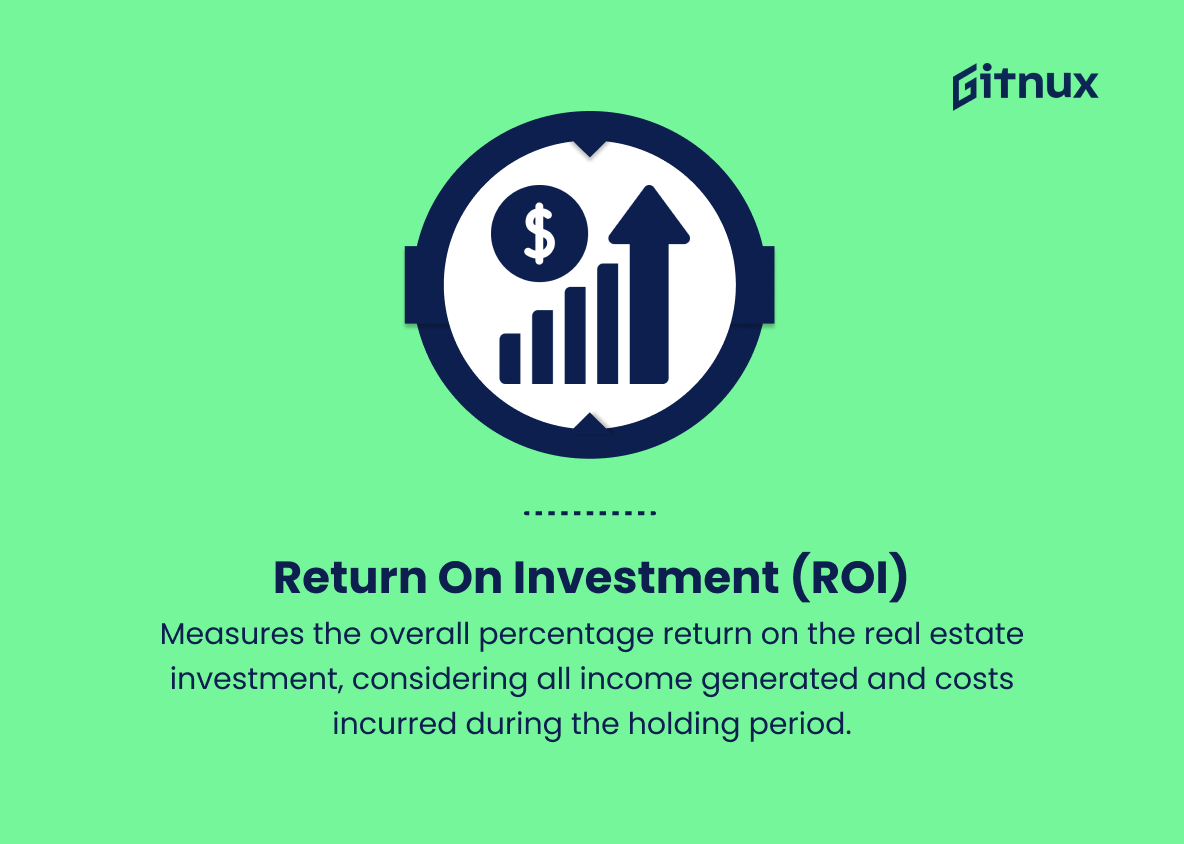
5. Return on Investment (ROI)
Measures the overall percentage return on the real estate investment, considering all income generated and costs incurred during the holding period. It can be calculated as a ratio of the net profit to the total purchase/investment costs.
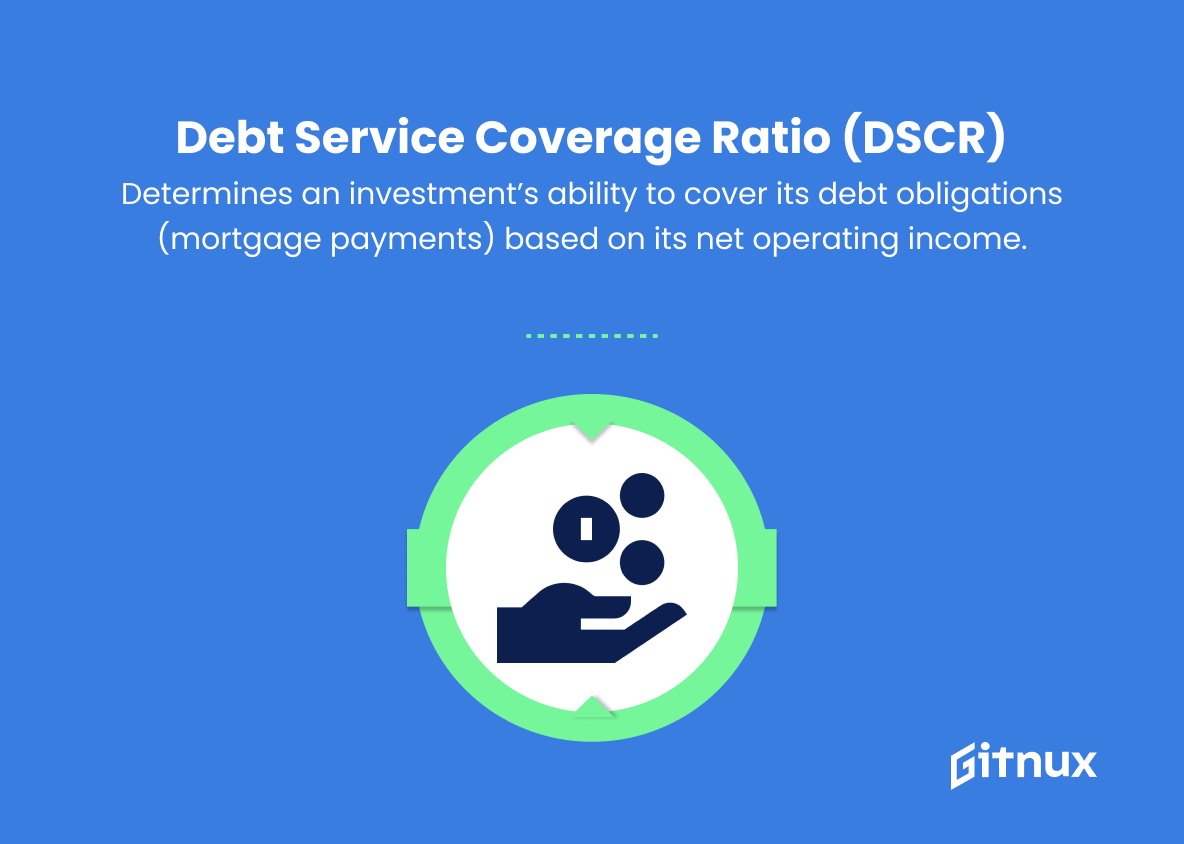
6. Debt Service Coverage Ratio (DSCR)
Determines an investment’s ability to cover its debt obligations (mortgage payments) based on its net operating income. It is calculated by dividing the NOI by the total annual debt service.
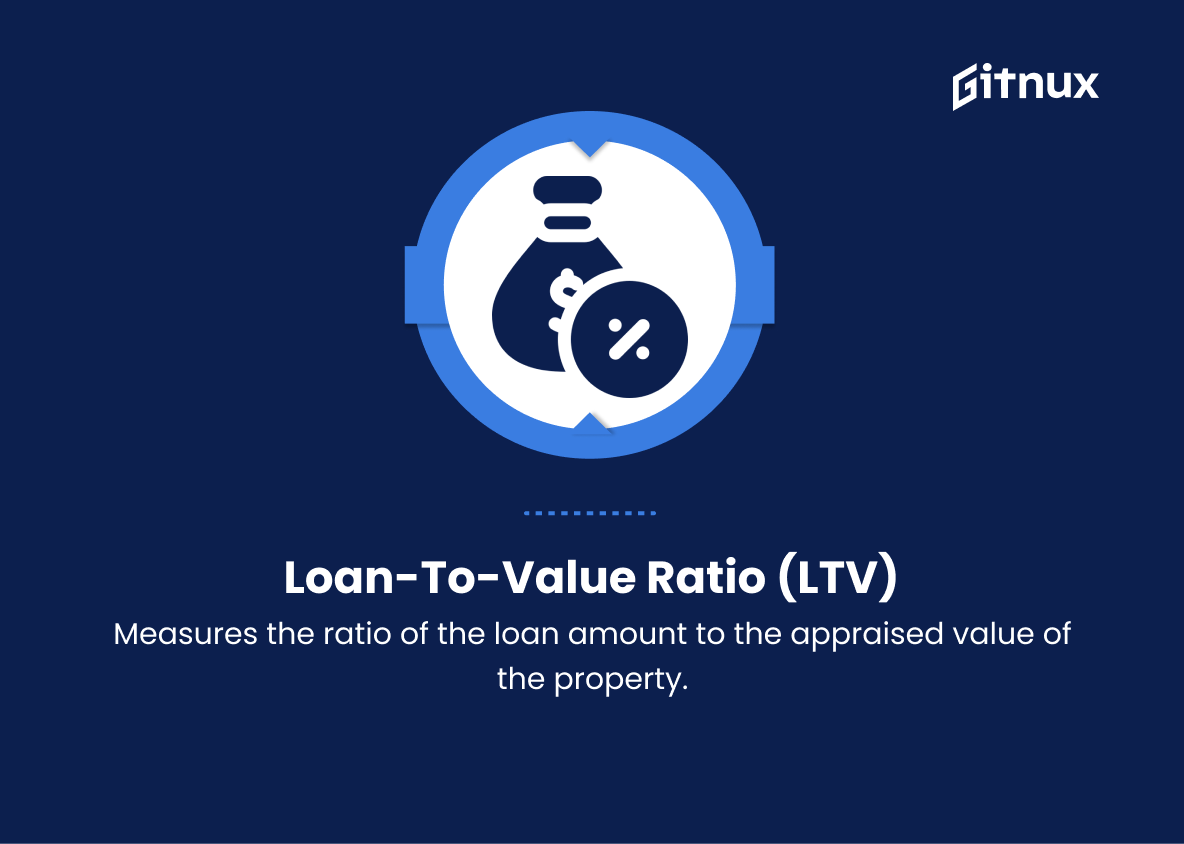
7. Loan-to-Value Ratio (LTV)
Measures the ratio of the loan amount to the appraised value of the property. It is an essential metric for financing as it shows the amount of equity in the property versus the outstanding loan.
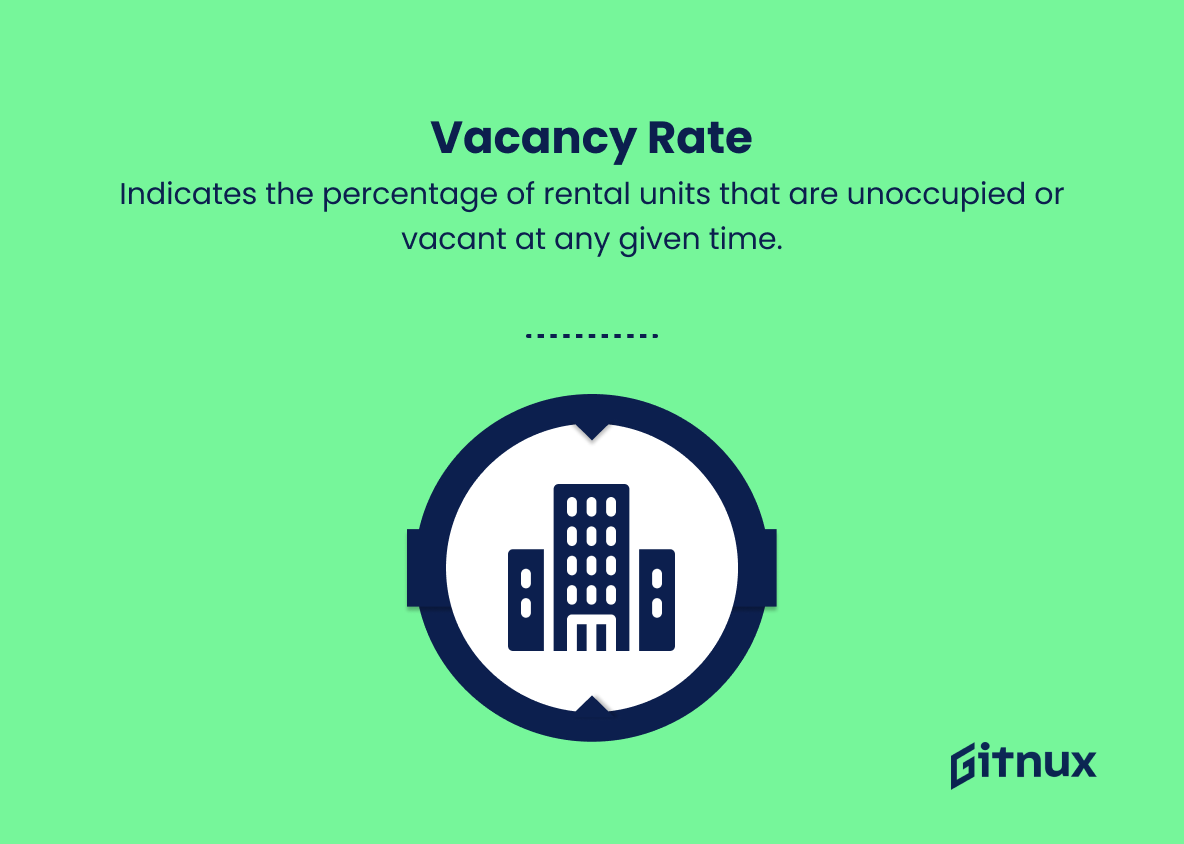
8. Vacancy Rate
Indicates the percentage of rental units that are unoccupied or vacant at any given time. A low vacancy rate can signal a strong rental market, while a high vacancy rate may indicate a weak rental market.
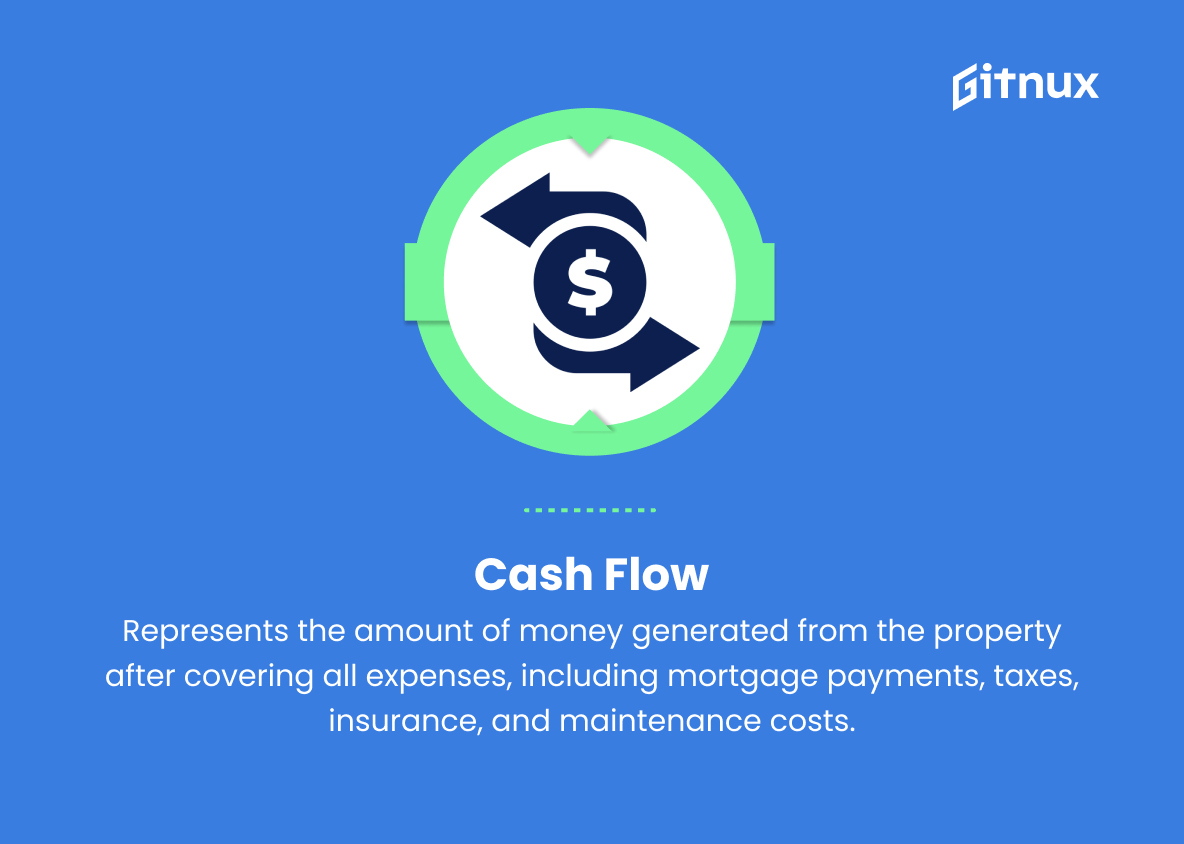
9. Cash Flow
Represents the amount of money generated from the property after covering all expenses, including mortgage payments, taxes, insurance, and maintenance costs.
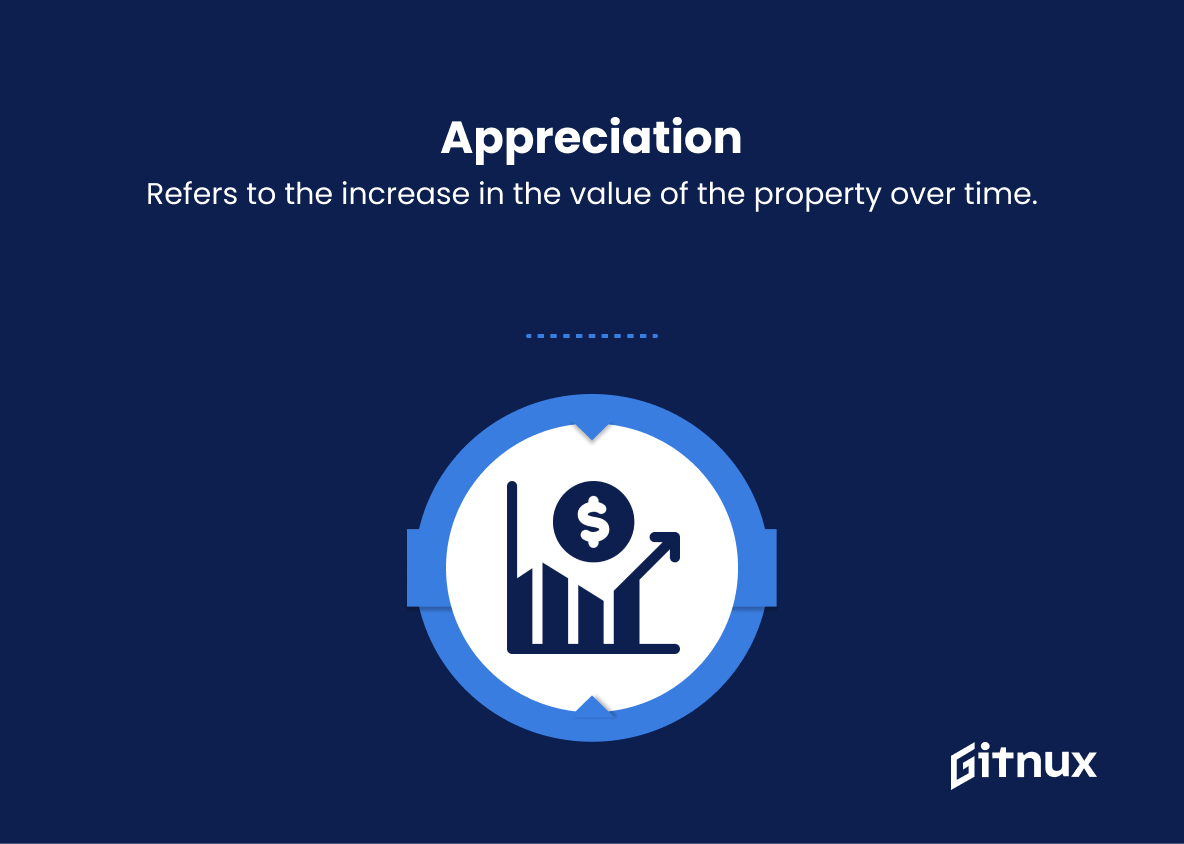
10. Appreciation
Refers to the increase in the value of the property over time. This is an essential component of real estate returns as it can significantly affect an investment’s long-term profitability.
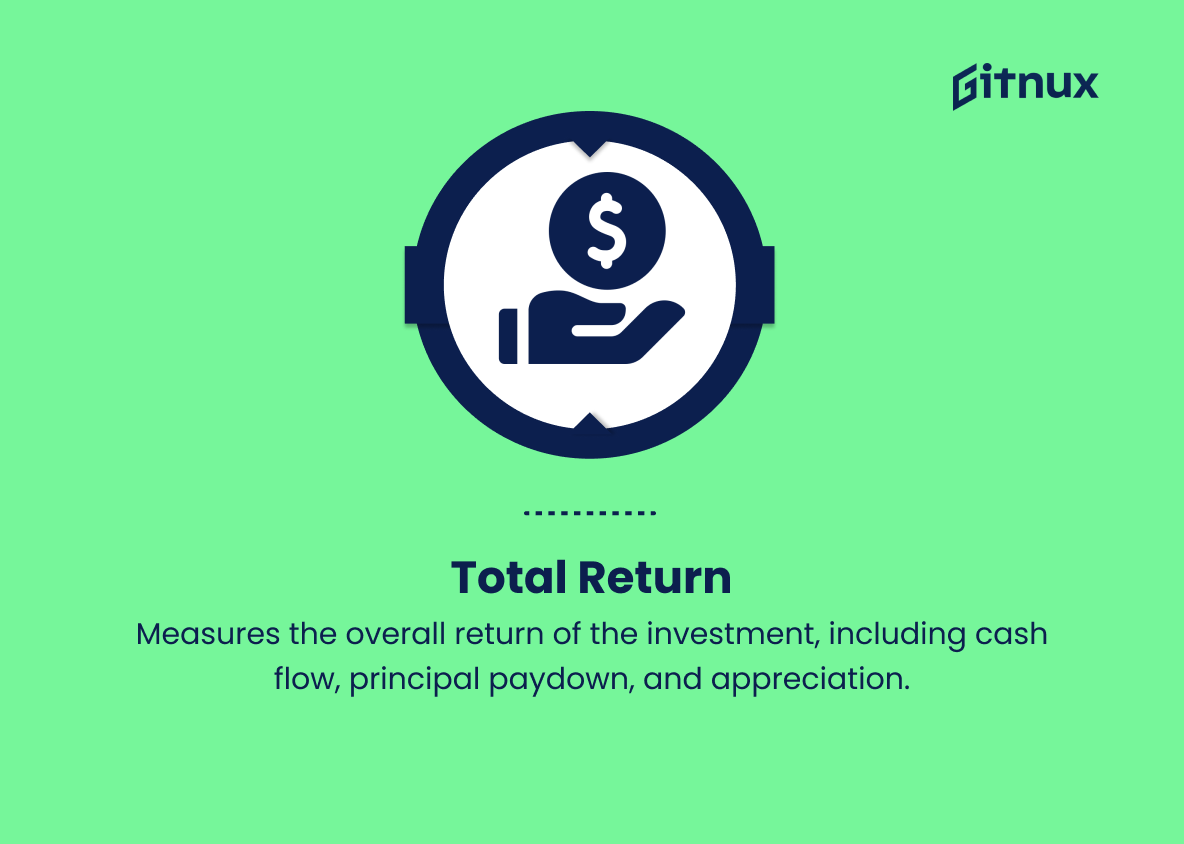
11. Total Return
Measures the overall return of the investment, including cash flow, principal paydown, and appreciation. This provides a comprehensive view of an investment’s performance over time.
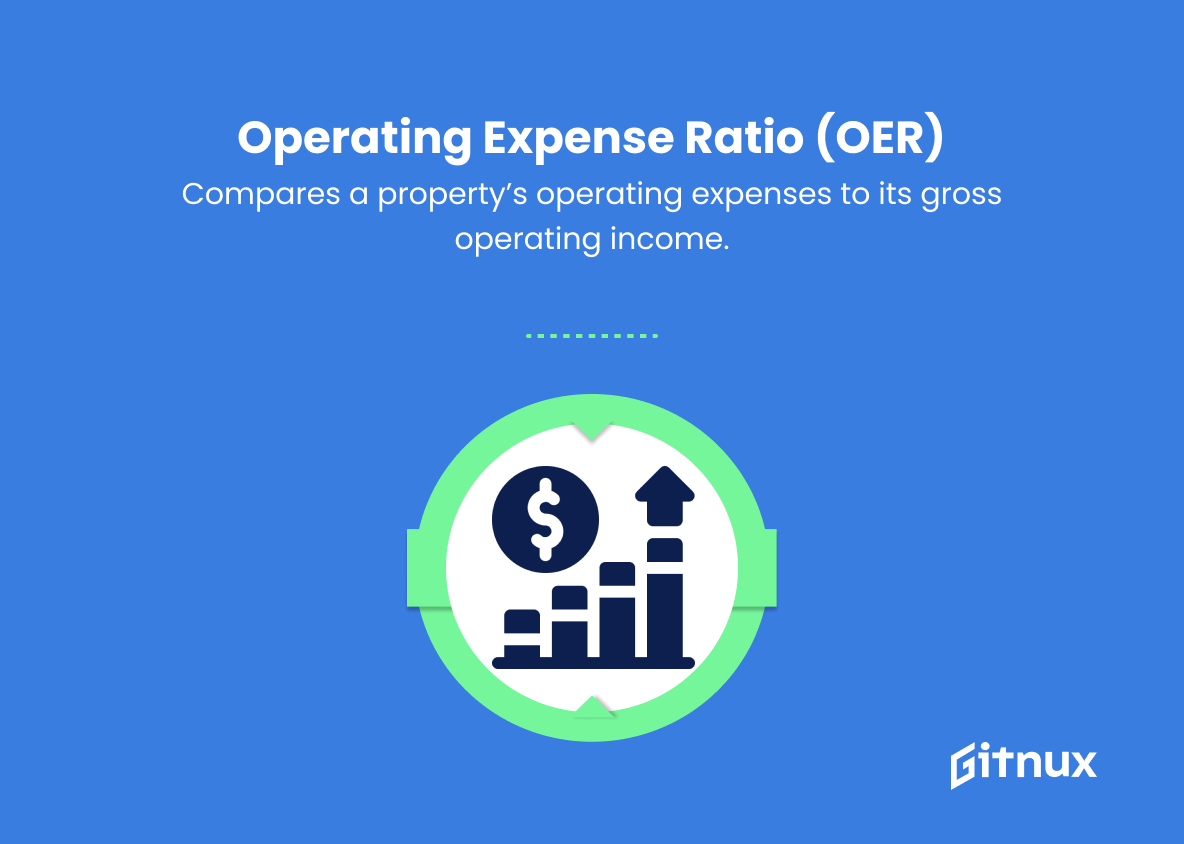
12. Operating Expense Ratio (OER)
Compares a property’s operating expenses to its gross operating income. A lower OER indicates better efficiency in operating the property, translating to higher profitability.
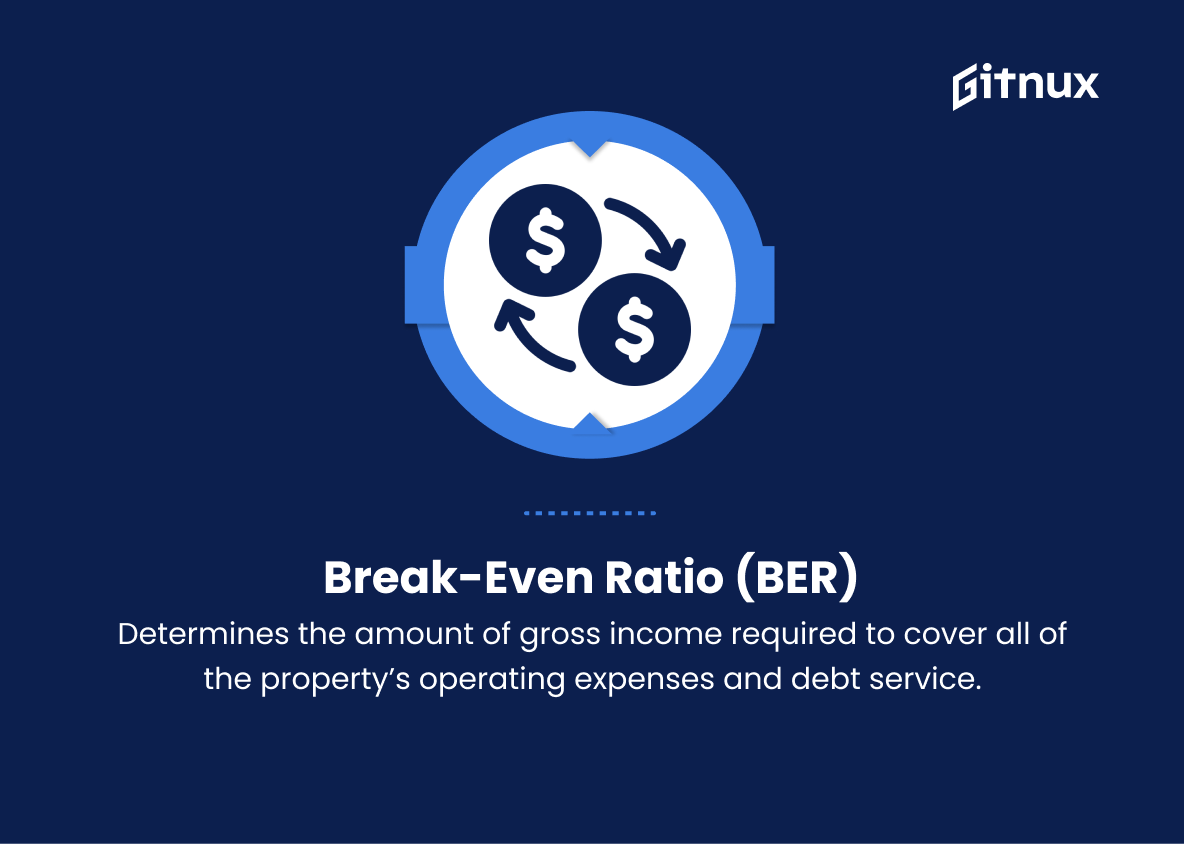
13. Break-Even Ratio (BER)
Determines the amount of gross income required to cover all of the property’s operating expenses and debt service. It is the percentage of gross income used to service debt and operation costs.
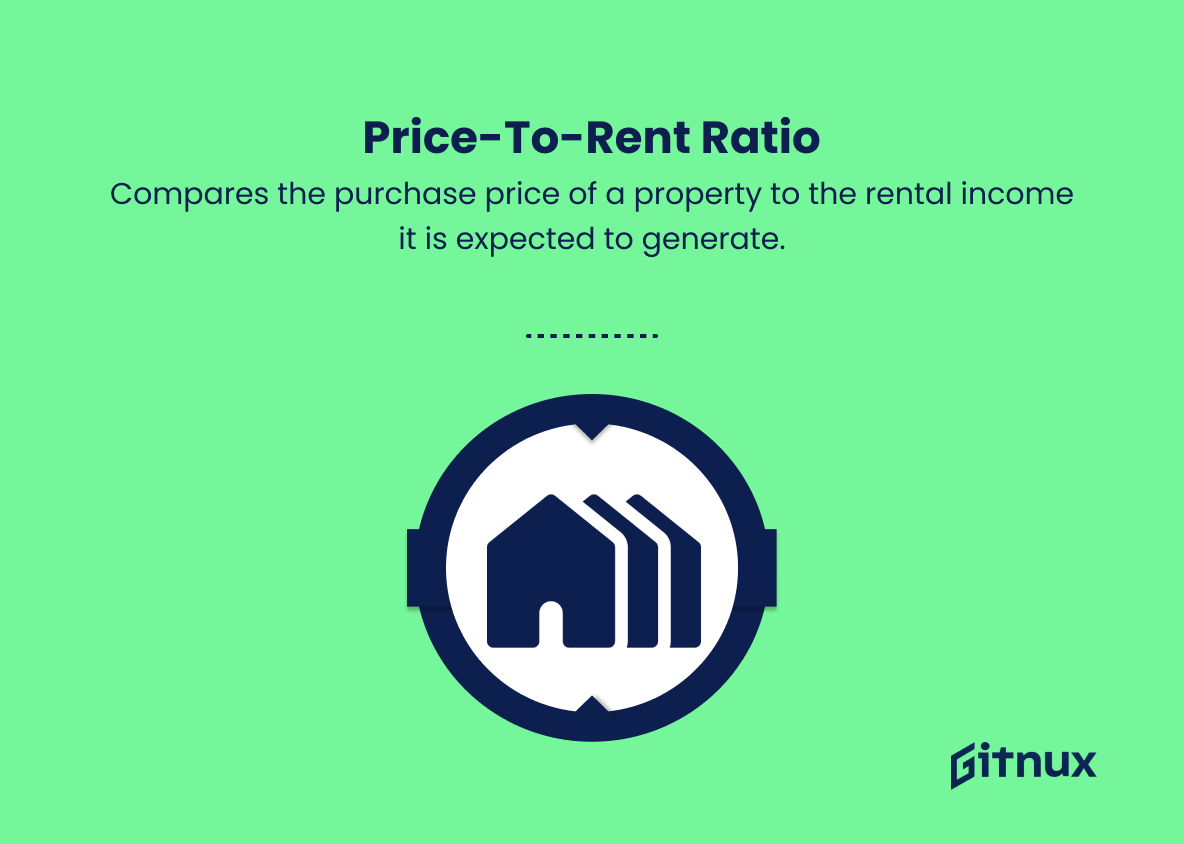
14. Price-to-Rent Ratio
Compares the purchase price of a property to the rental income it is expected to generate. A lower price-to-rent ratio indicates an investment that may be more profitable.
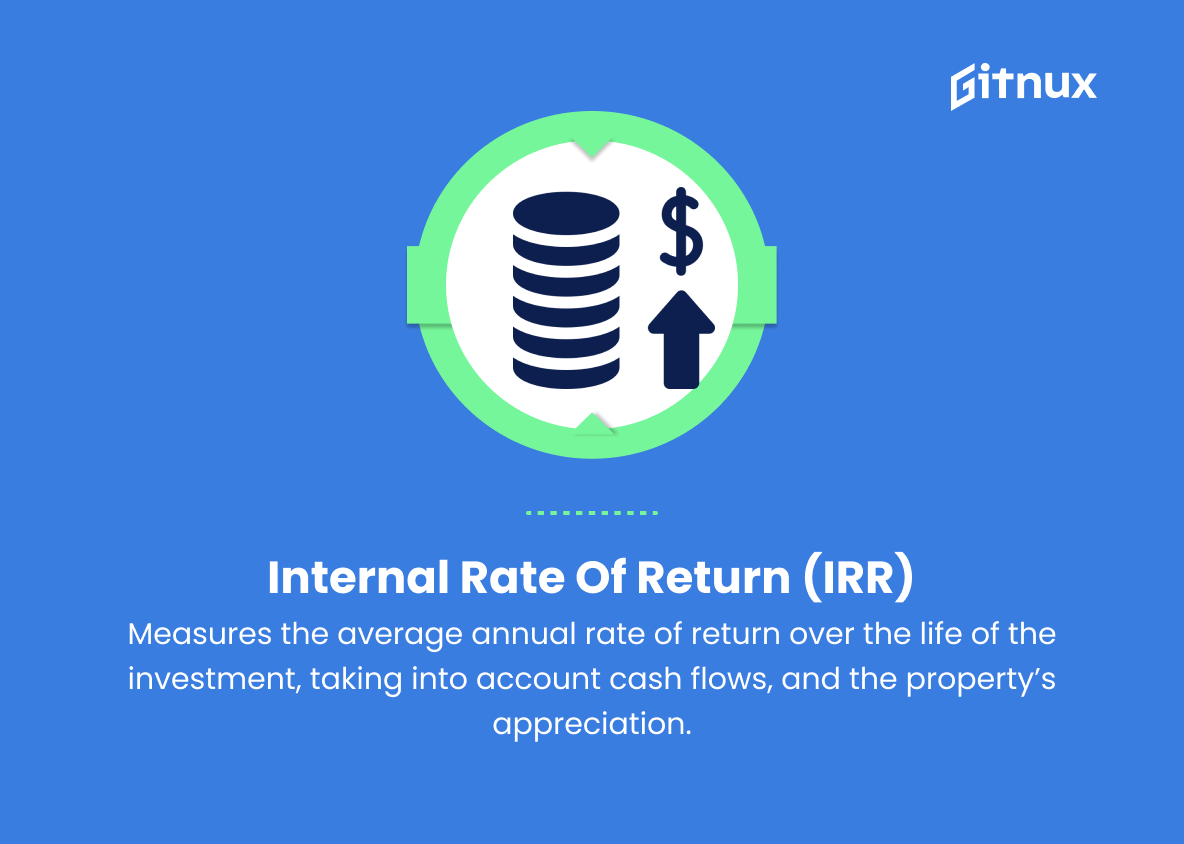
15. Internal Rate of Return (IRR)
Measures the average annual rate of return over the life of the investment, taking into account cash flows, and the property’s appreciation. IRR is a comprehensive measure of an investment’s profitability over its holding period.
Real Estate Investment Metrics Explained
Real estate investment metrics are crucial in evaluating the profitability and viability of property investments. The Capitalization Rate, or Cap Rate, determines the annual rate of return on a property based on its income and purchase price, enabling investors to gauge its potential performance. Cash on Cash Return provides insight into the percentage return on the initial cash investment, allowing investors to understand the cash income relative to their equity. The Gross Rent Multiplier (GRM) assesses a property’s ability to generate rental income compared to its purchase price, while the Net Operating Income (NOI) highlights the revenue generated after deducting operational expenses.
Return on Investment (ROI) offers a comprehensive view of the total percentage return, and the Debt Service Coverage Ratio (DSCR) demonstrates an investment’s capacity to cover debt obligations. Calculating the Loan-to-Value Ratio (LTV) reveals the proportion of outstanding loans compared to property value, while the Vacancy Rate indicates the strength of the rental market. Cash Flow represents the actual money generated after covering all expenses, and Appreciation concerns the increase in property value over time—an essential factor in long-term returns. Total Return measures overall investment performance, including cash flow, principal paydown, and appreciation. Operating Expense Ratio (OER) and Break-Even Ratio (BER) help to evaluate property management efficiency, while Price-to-Rent Ratio assists in identifying potentially more profitable investments. Finally, the Internal Rate of Return (IRR) serves as a comprehensive measure of investment performance, considering cash flows and property appreciation over the investment duration.
Conclusion
In conclusion, understanding and utilizing real estate investment metrics is crucial for any savvy investor. These metrics not only aid in making informed decisions, but also help in maximizing returns while minimizing risks.
By thoroughly analyzing key metrics such as cap rate, ROI, IRR, net operating income, and cash flow, investors can identify profitable investment opportunities and ensure the long-term growth and success of their real estate portfolios. Ultimately, mastering these metrics is the key to unlocking your full potential as a real estate investor and achieving financial independence.
