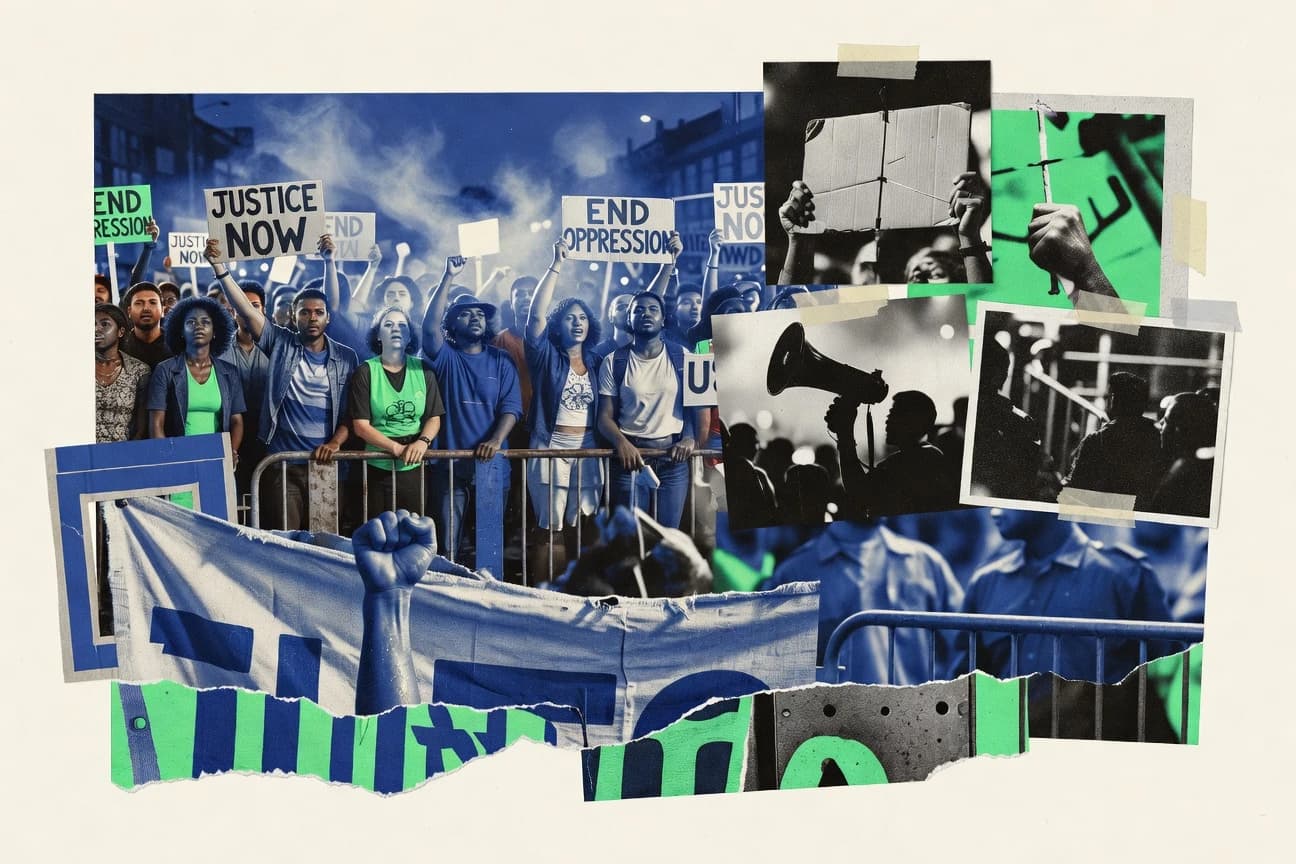

Across 2010 to 2020, worldwide protests grew 30% based on Carnegie data, but the most intense months were concentrated in just a few surges that reshaped participation patterns. George Floyd protests alone made up 93% of all US demonstrations in summer 2020, spreading across 7,750 events worldwide. This post connects that spike to everything from Hong Kong’s 13 month movement to climate strikes in 7,500+ cities and what those waves did to arrests, budgets, and policy.
Key Takeaways
- The George Floyd protests accounted for 93% of all U.S. demonstrations in summer 2020, with 7,750 events
- Worldwide, there were 10,000+ Black Lives Matter solidarity protests in 60+ countries in 2020
- U.S. protests rose 50% from 2016-2020, with 24,000+ events in 2020 alone
- U.S. George Floyd protests cost $1-2 billion in insured damages, highest in history
- Hong Kong protests caused HK$100 billion+ economic loss over 6 months in 2019
- Chile 2019 protests led to $3-4 billion GDP loss, 1.1% contraction Q4 2019
- Only 4.5% of protests from 2006-2020 were violent globally, per Nonviolent and Violent Campaigns study
- Nonviolent protests succeed 53% of time vs. 26% for violent ones (1900-2006)
- 2011 Arab Spring saw 2 regimes fall (Tunisia, Egypt) out of 6 major protests
- During the 2019-2020 Hong Kong protests, the largest single-day turnout was estimated at 1.7 million participants on June 16, 2019, representing about 24% of the city's population
- The 2017 Women's March in Washington, D.C., drew an estimated 470,000 to 680,000 participants, making it one of the largest single-day protests in U.S. history
- Black Lives Matter protests in the U.S. from May to August 2020 involved an estimated 15 to 26 million participants across over 2,400 locations
- Hong Kong protests saw 10,000+ injuries and psychological trauma in 30% of youth participants
- U.S. George Floyd protests (2020) resulted in 25 deaths, 2,000+ injuries to police, 12,000+ arrests
- Tiananmen Square 1989 massacre killed 200-10,000 protesters per estimates
In 2020, George Floyd protests dominated, with millions joining global solidarity while protests spread longer and cost billions.
Related reading
01 · Category
Duration and Frequency26 stats
01
The George Floyd protests accounted for 93% of all U.S. demonstrations in summer 2020, with 7,750 events
02
Worldwide, there were 10,000+ Black Lives Matter solidarity protests in 60+ countries in 2020
03
U.S. protests rose 50% from 2016-2020, with 24,000+ events in 2020 alone
04
Hong Kong protests (2019-2020) lasted 13 months with over 10,000 events
05
French Yellow Vests protests continued for 2+ years with 100+ consecutive Saturdays
06
U.S. BLM protests from 2013-2020 totaled over 10,600 demonstrations
07
Global climate strikes occurred weekly in 7,500+ cities since 2018
08
Chile's 2019 protests lasted 6 months with daily actions in 50+ cities
09
India's farmers' protest endured 13 months from Nov 2020 to Dec 2021
10
Belarus protests (2020-2021) had near-daily marches for 6 months
11
U.S. anti-war protests (1963-1975) included 3,000+ major events
12
Lebanon's 2019 protests lasted 10 months with nationwide blockades
13
Thailand protests (2020-2021) spanned 18 months with 1,000+ rallies
14
Myanmar civil disobedience movement post-2021 coup lasted 2+ years ongoing
15
Iran's 2022 protests continued for 6+ months across 200+ cities
16
U.S. Occupy movement (2011) had encampments lasting 2 months in 900+ cities
17
Algeria Hirak protests (2019-) paused but resumed, totaling 2 years intermittent
18
Global Extinction Rebellion actions since 2018 include 5,000+ events yearly
19
U.S. police brutality protests post-Ferguson (2014-2020) averaged 1,000/year
20
Hong Kong had 16,000+ protest-related arrests over 2019-2020 period
21
Worldwide protests increased 30% from 2010-2020 per Carnegie data
22
Puerto Rico 2019 protests led to governor's resignation after 2 weeks intense action
23
Armenia Velvet Revolution took 11 days of continuous marches in 2018
24
Sudanese protests (2018-2019) spanned 9 months leading to Bashir's ouster
25
Russia anti-Putin protests (2011-2012) had 100+ events over 9 months
26
U.S. Civil Rights Movement protests (1954-1968) included 2,000+ sit-ins and marches
Interpretation
Duration and Frequency Interpretation
We are living not in an age of isolated discontent but in a relentless global chorus of dissent, where the sheer volume and persistence of protest across every continent suggest this is no longer a sporadic outbreak of anger but the defining soundtrack of our time.
02 · Category
Economic and Legal Consequences20 stats
01
U.S. George Floyd protests cost $1-2 billion in insured damages, highest in history
02
Hong Kong protests caused HK$100 billion+ economic loss over 6 months in 2019
03
Chile 2019 protests led to $3-4 billion GDP loss, 1.1% contraction Q4 2019
04
BLM 2020 riots damaged 1,500+ businesses, $500M+ uninsured losses in Minneapolis alone
05
French Yellow Vests: €1 billion+ blocked tolls/fuel sales losses by Dec 2018
06
India's farmers' protest disrupted ₹2.5 lakh crore trade over 1 year
07
U.S. Jan 6 Capitol: $30 million damages, 1,500+ lawsuits pending
08
Lebanon 2019 protests caused $2 billion tourism loss, banks closed weeks
09
Myanmar post-coup protests/economy: 18% GDP contraction 2021, $10B+ losses
10
Belarus 2020: 4,000+ businesses sanctioned, $10B+ export losses
11
Thailand protests 2020: Tourism down 80%, $40B GDP hit 2020 partly due
12
Iran 2022 protests: $1B+ damages, 300+ businesses burned
13
Occupy Wall Street evictions cost cities $20M+ in policing
14
Algeria Hirak: Oil strikes cost $5B+ revenue 2019
15
U.S. 2020 protests policing cost $1.5B+ across cities
16
Hong Kong: 10,000+ convicted by 2023, average sentence 4 years under NSL
17
U.S. BLM arrests: 14,000+ charged, 90% dropped or non-violent misdemeanors
18
Jan 6: 1,200+ federal charges, 700+ guilty pleas by 2023
19
France Yellow Vests: 13,000+ investigated, 4,000 convictions mostly fines
20
Global protest policing costs average $100K per large event per studies
Interpretation
Economic and Legal Consequences Interpretation
The world’s price tag for dissent runs into the trillions, revealing an uncomfortable truth: whether protests shake empires or main streets, the ledger of change always demands a costly, and often contradictory, settlement.
03 · Category
Impacts and Outcomes22 stats
01
Only 4.5% of protests from 2006-2020 were violent globally, per Nonviolent and Violent Campaigns study
02
Nonviolent protests succeed 53% of time vs. 26% for violent ones (1900-2006)
03
2011 Arab Spring saw 2 regimes fall (Tunisia, Egypt) out of 6 major protests
04
U.S. Civil Rights Act 1964 passed after years of protests influencing 80% of Congress
05
Hong Kong protests led to 5 demands unmet, but electoral reforms partially granted
06
India's farmers' protests forced repeal of 3 farm laws in Nov 2021 after 1 year
07
Chile protests (2019) resulted in new constitution process approved by 78% referendum
08
BLM protests correlated with 20-30% drop in police killings in 2020 cities
09
Women's March 2017 boosted Democratic turnout by 11% in midterms per studies
10
South Africa's anti-apartheid protests led to 1994 democratic elections
11
Velvet Revolution in Czechoslovakia (1989) ended communism in 10 days nonviolently
12
Philippine People Power Revolution (1986) ousted Marcos with 2 million protesters
13
U.S. Vietnam War protests contributed to 1973 withdrawal and 58% public opposition peak
14
Yellow Vests forced Macron to raise minimum wage by 100 euros/month in 2019
15
Occupy Wall Street shifted discourse, leading to 2012 Dodd-Frank support polls at 60%
16
Sudanese revolution (2019) removed al-Bashir after 30 years, installed civilian council
17
Belarus protests (2020) failed to oust Lukashenko but led to 5 million emigrant votes abroad
18
Iran's 2022 protests led to 500+ deaths but no regime change, morality police paused
19
Lebanon protests (2019) caused government resignations but economic crisis worsened
20
Global climate protests influenced EU Green Deal adoption in 2019
21
U.S. protests post-Floyd led to 140+ police reform bills passed in states by 2021
22
Gandhi's Salt March (1930) sparked independence movement, leading to 60,000 arrests
Interpretation
Impacts and Outcomes Interpretation
The data suggests that peaceful protest, while not a guaranteed slam dunk, is the global underdog's statistically superior bet for creating lasting change, as violence tends to be a tragically inefficient shortcut that often sacrifices lives for little gain.
04 · Category
Participation and Scale30 stats
01
During the 2019-2020 Hong Kong protests, the largest single-day turnout was estimated at 1.7 million participants on June 16, 2019, representing about 24% of the city's population
02
The 2017 Women's March in Washington, D.C., drew an estimated 470,000 to 680,000 participants, making it one of the largest single-day protests in U.S. history
03
Black Lives Matter protests in the U.S. from May to August 2020 involved an estimated 15 to 26 million participants across over 2,400 locations
04
The 1989 Tiananmen Square protests in Beijing peaked with over 1 million participants in the city center
05
India's 2020-2021 farmers' protests saw up to 250,000 farmers camped at Delhi borders at peak times
06
The 2011 Egyptian Revolution protests in Tahrir Square had daily attendances exceeding 1 million people
07
France's Yellow Vests movement (2018-2019) mobilized 282,000 participants nationwide on November 17, 2018
08
The 1963 March on Washington for Jobs and Freedom attracted 250,000 participants
09
Chile's 2019 protests peaked with 1.2 million demonstrators in Santiago on October 25, 2019
10
The 2020 George Floyd protests spread to over 2,000 cities and towns in the U.S., with total participation estimated at 15-26 million
11
Anti-lockdown protests in the U.S. during 2020-2021 drew crowds of up to 10,000 in Michigan on April 30, 2020
12
The 1999 WTO protests in Seattle involved 40,000 participants, shutting down the conference
13
Global Climate Strike on September 20, 2019, saw 4 million participants worldwide
14
The 2014 Umbrella Movement in Hong Kong had peak daily attendance of 100,000-400,000
15
U.S. anti-Vietnam War protests peaked with 500,000 in Washington, D.C., on November 15, 1969
16
Belarus 2020 protests after elections drew up to 200,000 in Minsk on August 16, 2020
17
Sudan's 2018-2019 revolution saw 1-2 million in Khartoum on April 6, 2019
18
The 2021 Myanmar protests against the coup had daily marches of tens of thousands, peaking at 1 million in Yangon
19
London's 2003 anti-Iraq War march had 1.5 million participants, largest in UK history
20
Puerto Rico's 2019 Telegramgate protests drew 500,000-1 million on July 22
21
The 2019 Lebanese October Revolution saw 1.5 million protesters, a quarter of the population
22
Algeria's Hirak protests (2019-) peaked with 1-3 million in Algiers on March 1, 2019
23
U.S. Women's March 2018 had 1.8 million participants across 600+ cities
24
The 2022 Iranian protests after Mahsa Amini's death involved millions across 100+ cities
25
Global anti-vaccine mandate protests in Canada (2022) saw 10,000-50,000 in Ottawa trucker convoy
26
The 1968 global protests included 400,000 in Mexico City before Olympics
27
Russia's 2022 anti-war protests drew 15,000 arrests in first weeks, implying large crowds
28
Thailand's 2020-2021 youth-led protests peaked at 100,000 in Bangkok
29
The 2011 Occupy Wall Street inspired global protests with 100,000+ in NYC over months
30
Armenia's 2018 Velvet Revolution had 100,000+ marching to Yerevan
Interpretation
Participation and Scale Interpretation
Hong Kong's 1.7 million march was a city-sized statement, but the true measure of a protest isn't found in a single snapshot—it's in the persistence of 15 million Americans marching for Black lives, the endurance of Indian farmers at Delhi's gates, and the quiet, viral courage of a single student facing a tank, proving that the most powerful numbers are often the most human.
05 · Category
Violence and Casualties21 stats
01
Hong Kong protests saw 10,000+ injuries and psychological trauma in 30% of youth participants
02
U.S. George Floyd protests (2020) resulted in 25 deaths, 2,000+ injuries to police, 12,000+ arrests
03
Tiananmen Square 1989 massacre killed 200-10,000 protesters per estimates
04
Chile 2019 protests had 36 civilian deaths, 445 eye injuries from police rubber bullets
05
BLM protests 2020 saw 570+ riots with $1-2B property damage, 14,000+ arrests
06
Myanmar 2021 protests killed 1,500+ civilians by security forces
07
Belarus 2020 protests led to 30,000+ arrests, 1,000+ hospitalized from beatings
08
Iran's Mahsa Amini protests (2022) caused 500+ deaths, 20,000+ arrests
09
Yellow Vests France: 11 deaths, 4,000+ injured including 2,500 police by Dec 2018
10
U.S. Jan 6 Capitol riot (2021) had 5 deaths, 174 police injured, 1,200+ charged
11
Kent State shooting (1970): 4 students killed, 9 wounded by National Guard
12
Sudanese revolution: 100+ killed by forces before Bashir fall
13
Lebanon 2019 protests: 6 deaths, 2,700 injured in first month
14
Occupy Wall Street: 7,000+ arrests nationwide, minimal deaths but 200+ injuries
15
Algeria Hirak: 10+ deaths from crowd crushes/police, thousands injured
16
Thailand 2020 protests: 2 deaths, 100+ injured by police water cannons/pepperspray
17
Russia 2022 anti-war: 15,000+ arrested, beatings reported in 100+ cities
18
Puerto Rico 2019: 3 deaths, minimal violence but tear gas widespread
19
WTO Seattle 1999: 600+ arrests, 100 injured including police from projectiles
20
U.S. anti-lockdown: 100+ arrests in Michigan, few injuries but vehicle rammings
21
Global protests: Police use force in 20% of events, injuring 1-5% participants per ACLED
Interpretation
Violence and Casualties Interpretation
These sobering statistics, from Hong Kong to Minneapolis and Minsk to Tehran, are a global ledger of pain proving that when a society's dialogue breaks down, the resulting bill is always paid in blood, trauma, and shattered glass.
Reference
Cite This Report
This report is designed to be cited. We maintain stable URLs and versioned verification dates. Copy the format appropriate for your publication below.
APA
Christopher Morgan. (2026, February 13). Protest Statistics. Gitnux. https://gitnux.org/protest-statistics
MLA
Christopher Morgan. "Protest Statistics." Gitnux, 13 Feb 2026, https://gitnux.org/protest-statistics.
Chicago
Christopher Morgan. 2026. "Protest Statistics." Gitnux. https://gitnux.org/protest-statistics.
Sources & references
48 datasets cited across this report