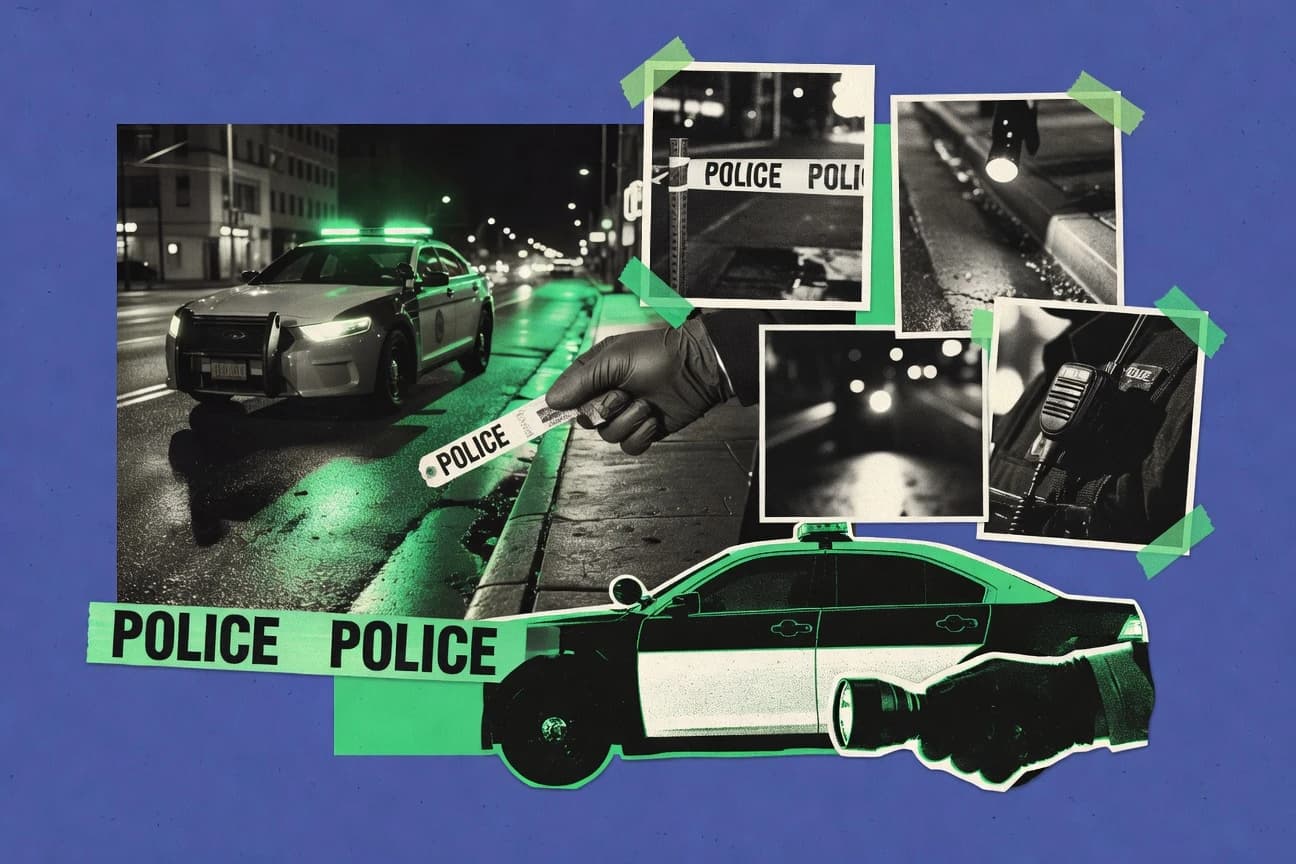

Nearly 12% of Americans did not have to wait until the next election to feel the weight of policing statistics. About 12 people are killed by police per million people in 2022, yet 7.6 million arrests were made nationwide that same year. As we sort through arrests, traffic stops, budgets, and public trust, the pattern that emerges is both expected and unsettling.
Key Takeaways
- In 2022, police made 7.6 million arrests nationwide
- Drug abuse violations accounted for 1.1 million arrests or 15% of total in 2022
- There were 549,136 arrests for violent crimes in 2022
- In FY2022, total US police expenditures reached $122.3 billion
- Police spending accounted for 9% of city general expenditures in 2022
- From 2017-2022, police funding in large cities increased by 4.6% nominally
- In 2022, the United States had approximately 697,195 full-time sworn law enforcement officers across nearly 18,000 agencies
- As of 2021, women comprised 12.6% of full-time sworn officers in local police departments
- Black or African American officers made up 12.5% of full-time sworn personnel in local police departments in 2021
- In 2023 Gallup poll, 51% of Americans confident in local police, up from 48% in 2022
- 66% of white Americans trust police a great deal/fair amount in 2023, vs 36% Black
- 42% of Americans satisfied with police honesty in 2022 Pew survey
- From 2015-2022, police use of force incidents resulted in 8,000 civilian deaths
- In 2022, 1,176 people were killed by police in the US
- Black Americans were 2.9 times more likely to be killed by police than whites in 2022
In 2022, 7.6 million arrests were made nationwide, including 1.1 million drug abuse arrests.
Related reading
01 · Category
Arrests and Enforcement Activities30 stats
01
In 2022, police made 7.6 million arrests nationwide
02
Drug abuse violations accounted for 1.1 million arrests or 15% of total in 2022
03
There were 549,136 arrests for violent crimes in 2022
04
Property crime arrests totaled 846,000 in 2022, representing 11% of total arrests
05
DUI arrests numbered 803,000 in 2022
06
69% of all arrests in 2022 were of adults aged 18 and over
07
Murder and nonnegligent manslaughter arrests were 8,757 in 2022
08
Aggravated assault arrests reached 248,300 in 2022
09
Larceny-theft arrests totaled 522,000 in 2022
10
456,220 arrests for drug violations occurred in 2021, down from previous years
11
Traffic arrests were 1.2 million in 2022
12
Robbery arrests numbered 38,000 in 2022
13
27% of arrests were for crimes against persons in 2022
14
Burglary arrests were 92,000 in 2022
15
Weapons violation arrests totaled 164,000 in 2022
16
In 2022, 10.4 million arrests were estimated including unreported agencies
17
Rape arrests were 13,200 in 2022
18
Vagrancy arrests numbered 22,000 in 2022
19
81% of murder arrests were male offenders in 2022
20
Motor vehicle theft arrests were 67,000 in 2022
21
Under 18-year-olds accounted for 5% of all arrests in 2022
22
Simple assaults led with 603,000 arrests in 2022
23
Forgery and counterfeiting arrests were 37,000 in 2022
24
73% of violent crime arrests were adults in 2022
25
Arson arrests totaled 6,800 in 2022
26
Sex offenses (except rape) arrests were 40,000 in 2022
27
In 2021, police conducted 21 million traffic stops
28
Fraud arrests numbered 85,000 in 2022
29
15% of arrests involved drug possession only in 2022
30
Embezzlement arrests were 11,000 in 2022
Interpretation
Arrests and Enforcement Activities Interpretation
The landscape of American law enforcement in 2022 reveals a nation grappling most frequently with traffic stops and drug violations, yet haunted most profoundly by the stark, though relatively few, arrests for murder and rape.
02 · Category
Budget and Funding27 stats
01
In FY2022, total US police expenditures reached $122.3 billion
02
Police spending accounted for 9% of city general expenditures in 2022
03
From 2017-2022, police funding in large cities increased by 4.6% nominally
04
New York City allocated $11.3 billion to NYPD in FY2023
05
Federal funding for law enforcement grants totaled $1.8 billion in FY2022 via COPS
06
Average police budget per officer was $185,000in large US cities in 2022
07
Salaries and wages comprised 42% of police budgets in cities over 1 million in 2022
08
Overtime pay for police rose 27% from 2018-2022 in major cities
09
State and local governments spent $115 billion on police protection in 2020
10
Police funding increased 11% adjusted for inflation from 2016-2022 in 100 largest cities
11
COPS Hiring Program awarded $139 million to hire 1,476 officers in FY2022
12
Pensions for police officers cost states $40 billion annually as of 2021
13
25% of police budgets in small cities went to equipment in 2021
14
Los Angeles PD budget was $1.85 billion in FY2023
15
Federal Byrne JAG grants distributed $380 million for law enforcement in FY2022
16
Police salaries averaged $72,200nationally in 2022
17
Benefits added 35% to police compensation costs in 2021
18
Capital spending on police facilities was $5.2 billion in 2020
19
Minneapolis police budget rose 12% post-2020 despite defund talks
20
68% of police budgets were personnel costs in mid-sized cities 2022
21
Chicago PD budget hit $2.1 billion in 2023
22
Military equipment transfers via 1033 program valued $7.4 billion from 2006-2020
23
Training budgets averaged $1,200per officer annually in 2021
24
Philadelphia PD allocated $840 million in FY2023
25
Nationwide police overtime expenditures totaled $3.5 billion in 2021
26
In 2022, law enforcement agencies received $1.2 billion in asset forfeiture funds
27
Houston PD budget was $1.4 billion for FY2023
Interpretation
Budget and Funding Interpretation
America keeps writing a very large, very serious check to the police, but the overtime charges suggest we’re not exactly getting a bulk discount on public safety.
03 · Category
Officer Demographics and Employment29 stats
01
In 2022, the United States had approximately 697,195 full-time sworn law enforcement officers across nearly 18,000 agencies
02
As of 2021, women comprised 12.6% of full-time sworn officers in local police departments
03
Black or African American officers made up 12.5% of full-time sworn personnel in local police departments in 2021
04
The average age of full-time sworn officers in local police departments was 41 years in 2021
05
Hispanic or Latino officers represented 18.1% of full-time sworn officers in local police departments in 2021
06
In 2020, there were 18,396 state and local law enforcement agencies in the US reporting to the FBI's UCR program
07
Full-time sworn officers increased by 1.2% from 2019 to 2020 in sheriff's offices
08
In 2021, 73% of local police departments were located in cities with populations under 10,000
09
The ratio of full-time sworn officers to 1,000 residents was 2.4 nationally in 2020
10
Asian officers accounted for 1.7% of full-time sworn personnel in municipal police departments in 2021
11
In 2019, 84% of local police departments had 50 or fewer full-time sworn officers
12
Female officers in sheriff's offices rose to 11.5% in 2020 from 10.8% in 2016
13
In 2021, the median years of service for full-time sworn officers was 11 years
14
Tribal police agencies employed 3,100 full-time sworn officers in 2020
15
65% of full-time sworn officers had some college education or higher in 2021 local police departments
16
Rural counties had 1.9 officers per 1,000 residents in 2020, compared to 2.6 in suburban areas
17
In 2022, New York City Police Department had 35,881 officers, the largest in the US
18
7.3% of officers were under 25 years old in local police departments in 2021
19
Special jurisdiction agencies had 49,000 full-time sworn officers in 2020
20
25% of local police departments reported officer shortages in 2021 surveys
21
In 2018, 14.4% of sworn officers were female across all agencies
22
Local police departments authorized 449,000 full-time personnel in 2019
23
42% of officers had bachelor's degrees or higher in 2021
24
Sheriff's offices in the West had the highest officer-to-population ratio at 2.8 per 1,000 in 2020
25
2.1% of full-time sworn officers were Native American or Alaska Native in 2021
26
Chicago PD had 11,836 sworn officers in 2022
27
18% of agencies reported hiring more than 10 new officers in 2021
28
Full-time sworn officers totaled 780,000 including all levels in 2020
29
30.4% of officers were aged 40-49 in local departments in 2021
Interpretation
Officer Demographics and Employment Interpretation
Despite an army of nearly 700,000 officers, American policing remains a predominantly older, male, and locally fragmented profession, slowly inching toward greater diversity while grappling with persistent staffing shortages and a wide disparity in community resources.
More related reading
04 · Category
Public Trust and Perceptions26 stats
01
In 2023 Gallup poll, 51% of Americans confident in local police, up from 48% in 2022
02
66% of white Americans trust police a great deal/fair amount in 2023, vs 36% Black
03
42% of Americans satisfied with police honesty in 2022 Pew survey
04
81% of Republicans confident in police in 2023, vs 28% Democrats
05
Only 33% of Black Americans rate local police performance as excellent/good in 2023
06
56% approval of local law enforcement in 2023 Harvard CAPS poll
07
Trust in police dropped to 45% nationally post-2020 George Floyd
08
62% of Americans say police treat whites better than minorities in 2022
09
75% support more police funding in high-crime neighborhoods 2023
10
47% of young adults (18-29) confident in police 2023 Gallup
11
89% of Americans want police to spend same/more time in communities 2021
12
Satisfaction with police response times at 68% in 2022 surveys
13
26% of Black Americans trust police to treat them fairly in 2023
14
70% believe police make communities safer per 2023 poll
15
Urban residents trust police at 48% in 2023, vs 60% rural
16
55% approve of police handling protests in 2022
17
64% say police respect people's rights in 2023 NAPO poll
18
Only 38% of Democrats have high confidence in police 2023
19
92% of Americans rank police among top respected professions 2023
20
49% satisfied with police protection in neighborhoods 2022
21
Hispanic trust in police at 52% in 2023 Gallup
22
67% support qualified immunity for officers 2023 poll
23
59% say more police needed in most communities 2023
24
Trust rebound to 51% in 2023 from 48% low in 2022
25
71% of Americans want police focused on serious crimes 2021
26
45% rate local police performance positively in 2023 Pew
Interpretation
Public Trust and Perceptions Interpretation
The statistics paint a portrait of a nation that simultaneously respects its police as an institution, depends on them for safety, and yet harbors a deep, persistent, and often racialized skepticism about whether that institution will treat all of its citizens fairly.
05 · Category
Use of Force Incidents26 stats
01
From 2015-2022, police use of force incidents resulted in 8,000 civilian deaths
02
In 2022, 1,176 people were killed by police in the US
03
Black Americans were 2.9 times more likely to be killed by police than whites in 2022
04
97% of police killings from 1980-2022 did not result in officer charges
05
Tasers were used in 1% of police-public interactions in 2021
06
24% of people killed by police in 2022 were Black, despite being 13% of population
07
Police used firearms in 94% of fatal force incidents in 2022
08
From 2013-2022, 30% of police killings involved mental health crises
09
Non-lethal force was reported in 2% of contacts in 2021 BJS survey
10
1,096 police killings occurred in 2021
11
Officers were killed by gunfire 60 times in 2022
12
15% of deadly force victims were fleeing in 2022
13
Chokeholds and neck restraints used in 5% of force incidents pre-2020 bans
14
78% of police shooting victims were armed in 2022 WaPo data
15
Police dogs bitten 1,000+ people annually pre-2020
16
Less-lethal munitions like rubber bullets used 2,000+ times in 2020 protests
17
26 unarmed people killed by police in 2022
18
Force complaints sustained in only 8% of cases in 2021
19
Pepper spray deployed in 1.5% of use-of-force reports 2015-2020
20
55% of fatal police encounters involved vehicle pursuits 2015-2022
21
Body cameras captured 65% of use-of-force incidents in equipped depts 2021
22
Native Americans killed by police at 3x rate of population share in 2022
23
40% of police killings had no body camera footage in 2022
24
Electrical weapons like Tasers caused 1,150 deaths since 2001
25
Hands-on physical force used in 22% of traffic stops 2021
26
12 people killed by police per million in 2022
Interpretation
Use of Force Incidents Interpretation
These sobering numbers reveal a system where the badge too often becomes a casket, accountability is a statistical ghost, and communities of color bear a disproportionate weight of the tragedy.
Reference
Cite This Report
This report is designed to be cited. We maintain stable URLs and versioned verification dates. Copy the format appropriate for your publication below.
APA
Helena Kowalczyk. (2026, February 13). Police Statistics. Gitnux. https://gitnux.org/police-statistics
MLA
Helena Kowalczyk. "Police Statistics." Gitnux, 13 Feb 2026, https://gitnux.org/police-statistics.
Chicago
Helena Kowalczyk. 2026. "Police Statistics." Gitnux. https://gitnux.org/police-statistics.
Sources & references
41 datasets cited across this report · attribution is report-level