
Global plastic production exceeds 400 million tonnes each year. Only 9 percent of all plastic waste undergoes recycling worldwide. The rest enters landfills, oceans, or the air and food chain as microplastics.
Key Takeaways
- Annual global plastic packaging production hit 146 million tonnes in 2015, expected to reach 205 million by 2021
- 8 million metric tons of plastic enter oceans annually from land-based consumption
- Microplastics found in 93% of bottled water samples, average 325 particles/liter
- Global plastic production reached 460 million metric tons in 2019, marking a 13-fold increase from 34 million metric tons in 1950
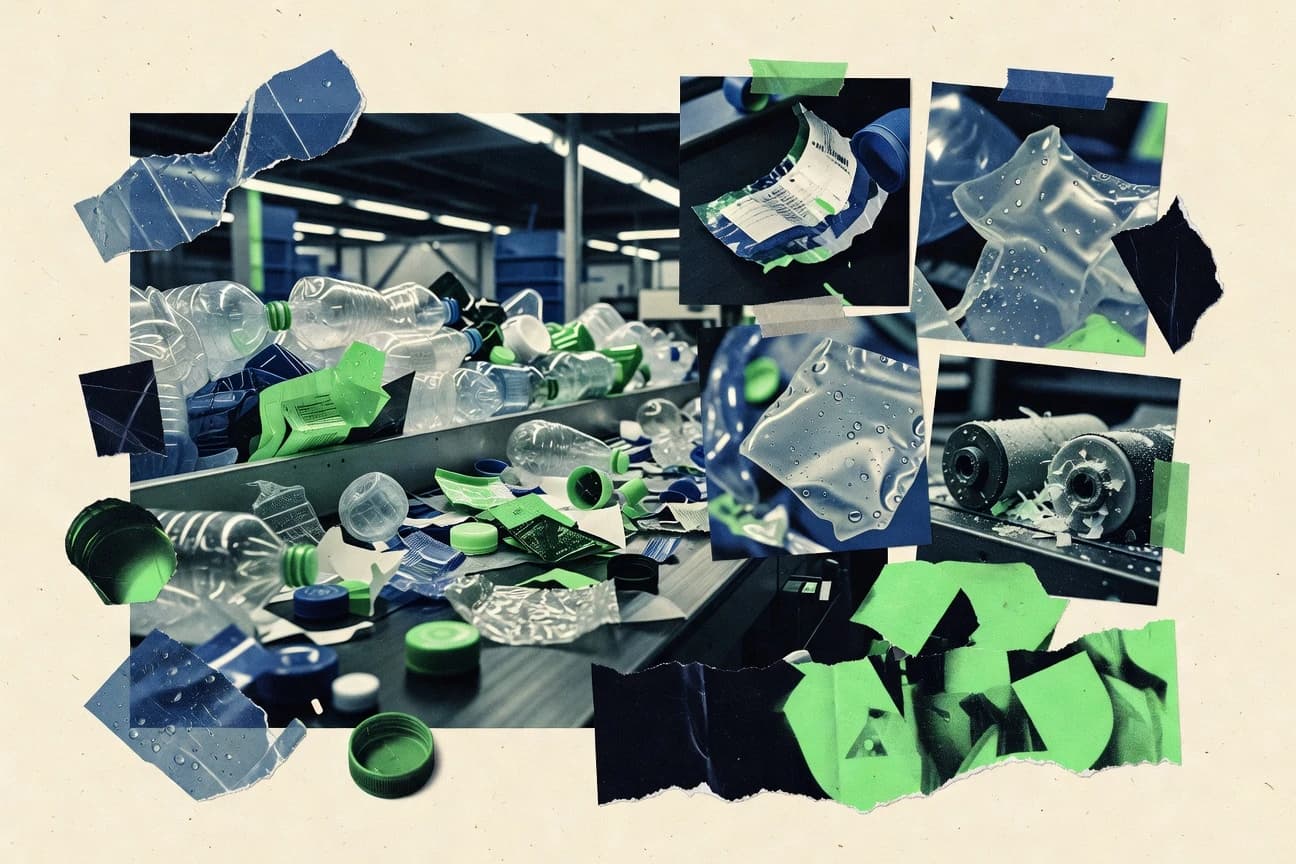
- Plastic recycling rate globally is only 9%, with 79% landfilled or littered
Plastic production keeps rising fast, making improved recycling and reduction urgently necessary to cut waste.
Related reading
01 · Category
Consumption30 stats
01
Annual global plastic packaging production hit 146 million tonnes in 2015, expected to reach 205 million by 2021
02
Packaging uses 42% of all plastics produced, totaling about 174 million tonnes in 2022
03
In the US, 99% of plastic packaging is used for food and beverages
04
Global plastic packaging consumption grew from 78.6 million tonnes in 2002 to 146.7 million tonnes in 2015
05
Single-use plastic packaging accounts for 40% of total plastic production
06
In Europe, 40.5% of plastics are used in packaging, 20.4 million tonnes in 2022
07
US plastic consumption per capita is 130 kg annually
08
Global average plastic use per person is 60 kg per year
09
Bottled water consumption leads to 600 billion plastic bottles used yearly worldwide
10
Plastic bags consumption globally is 5 trillion per year
11
In the UK, plastic packaging consumption is 2.4 million tonnes annually
12
Agricultural plastic film use is 5.4 million tonnes per year in Europe
13
Building and construction sector consumes 20% of plastics, 92 million tonnes globally in 2022
14
Automotive industry uses 10% of plastics, about 46 million tonnes yearly
15
Electrical and electronics plastics consumption is 6%, 28 million tonnes annually
16
Household, leisure, and sports use 10% of plastics, 46 million tonnes per year
17
India consumes 15 million tonnes of plastics annually, mostly packaging
18
Japan plastic consumption per capita is 76 kg/year
19
Plastic cutlery and utensils consumption is 2.7 billion pieces daily worldwide
20
Straw consumption globally exceeds 500 million per day
21
Coffee pods use 40 billion plastic units yearly
22
Tobacco filters contain 4.5 trillion plastic fibers released annually from cigarettes
23
Fishing gear accounts for 10% of marine plastic debris from consumption
24
E-commerce packaging plastic use doubled since 2015 to 15 million tonnes in 2022
25
Disposable diaper plastics consumption is 300,000 tonnes per day globally
26
Toothpaste tubes and personal care plastics: 120 billion units/year
27
Global plastic toy production and consumption: 80 billion pieces annually
28
Medical plastics consumption surged 15% during COVID to 12 million tonnes in 2020
29
Airline plastic cutlery: 1 billion meals served daily with disposables pre-COVID
30
Fast food packaging plastics: 3 million tonnes/year in US alone
Interpretation
Consumption Interpretation
Our insatiable appetite for convenience is brilliantly, tragically illustrated by the fact that we wrap 99% of our US food and drink in a material designed to outlive us by centuries, using enough of it each year globally to mold a life-sized plastic figurine for every human on Earth.
02 · Category
Environmental Impact25 stats
01
8 million metric tons of plastic enter oceans annually from land-based consumption
02
Microplastics concentration in ocean surface waters averages 0.01 particles per cubic meter globally
03
80% of marine debris is plastic, with 5.25 trillion pieces floating in oceans
04
Plastic pollution kills 1 million seabirds and 100,000 marine mammals annually
05
By 2050, plastic could outweigh fish in the ocean by weight
06
Rivers transport 1.15 to 2.41 million tonnes of plastic to oceans yearly
07
Great Pacific Garbage Patch contains 1.8 trillion plastic pieces weighing 80,000 tonnes
08
Microplastics in 88% of ocean surface, density up to 590,000 pieces/km²
09
Plastic contributes to 3-4 million tonnes of greenhouse gas emissions annually from degradation
10
14 million tonnes of plastic enter oceans yearly, equivalent to 40 billion bottles/month
11
Coral reefs suffer 90% damage from plastic smothering and stress
12
Plastic in Arctic sea ice: up to 12,000 particles per liter of meltwater
13
Soil microplastic contamination averages 4.4% by weight in farmland
14
Plastic mulch films leave 130,000 tonnes of residue in EU soils yearly
15
Atmospheric microplastic deposition: 4.4 tonnes per 1 million people annually in urban areas
16
Plastic burning releases 850 million tonnes CO2-equivalent yearly
17
50% of plastics produced since 2000 still in use or landfills
18
Mismanaged plastic waste: 109 kg per capita globally
19
Plastic in freshwater lakes: 0.43 million tonnes accumulated globally
20
Desert dust carries microplastics 3,500 km
21
Plastic pollution costs fisheries $13 billion annually
22
700 marine species affected by plastic entanglement or ingestion
23
Plastic reduces ocean primary productivity by 15-30% in polluted areas
24
Global plastic waste generation: 353 million tonnes in 2019
25
Landfill plastic accumulation: 25% of total waste, 79 million tonnes/year
Interpretation
Environmental Impact Interpretation
We’ve engineered a world where our convenience now chokes the seas, poisons the soil, and taints the air, all while amassing a staggering plastic legacy that future generations will sift through in disbelief.
03 · Category
Health22 stats
01
Microplastics found in 93% of bottled water samples, average 325 particles/liter
02
Humans ingest 5 grams of plastic weekly, equivalent to a credit card
03
Blood samples show 77% contaminated with microplastics, up to 1.6 µg/mm³
04
Placental microplastics in 60% of samples from 62 Italian women
05
Lung tissue has 39 microplastic particles per cm² from inhalation
06
BPA exposure affects 93% of Americans, linked to hormone disruption
07
Phthalates in 75% of fast food packaging
08
Plastic chemicals linked to 100,000 cancer cases yearly in EU
09
Microplastics in 100% of human stools tested globally
10
Children ingest 2,000 microplastic particles yearly from sugar packaging
11
Seafood consumption leads to 11,000 microplastic particles per year per person
12
Airborne microplastics: adults inhale 272 particles/day, children 184
13
PFAS "forever chemicals" from plastics in 99% of humans
14
Plastic incineration releases dioxins, carcinogenic at 0.1 pg TEQ/kg body weight daily
15
Breast milk contains average 99 µg/kg microplastics
16
Sperm counts declined 50% since 1973, correlated with phthalate exposure from plastics
17
ADHD risk increases 1.5-fold with high urinary BPA from plastics
18
Obesity risk 1.23 times higher with high plastic chemical exposure
19
Plastic monomers like styrene classified carcinogenic by IARC
20
Infants exposed to 74,000 microplastic particles/year via bottles
21
Colorectal cancer risk from microplastics: inflammation markers up 20%
22
Endocrine disruption from plastics affects 80% of EU newborns
Interpretation
Health Interpretation
Our bodies are becoming modern art installations, painstakingly assembled from the plastic particles we've woven into every facet of our lives, from the air we breathe and the water we drink to the very tissues that cradle new life.
More related reading
04 · Category
Production30 stats
01
Global plastic production reached 460 million metric tons in 2019, marking a 13-fold increase from 34 million metric tons in 1950
02
In 2022, annual global plastic production exceeded 400 million tonnes, with Asia accounting for 52% of total output
03
Polyethylene (PE) constitutes 29% of global plastic production at approximately 134 million tonnes per year as of 2022
04
Polypropylene (PP) production stands at 24% of total plastics, equating to about 111 million tonnes annually in 2022
05
Polyvinyl chloride (PVC) makes up 10% of global plastic production, around 46 million tonnes per year in recent data
06
In the EU, plastic production was 56.5 million tonnes in 2022, down 1.5% from the previous year due to energy costs
07
China produced over 32% of the world's plastics in 2021, totaling about 147 million tonnes
08
The United States plastic resin production reached 25.3 million metric tons in 2022
09
Global plastic production is projected to double by 2040 to nearly 1 billion tonnes annually
10
In 2020, fossil fuel-based virgin plastic production was 367 million tonnes
11
PET production globally was 28 million tonnes in 2022, primarily for bottles
12
Polystyrene (PS) accounts for 6% of plastic production, about 28 million tonnes yearly
13
Plastic additives production reached 40 million tonnes in 2020
14
In India, plastic production capacity was 9.8 million tonnes per annum as of 2022
15
Brazil's plastic production hit 8.5 million tonnes in 2021
16
Germany's plastic production was 14.2 million tonnes in 2022
17
Japan produced 13.5 million tonnes of plastics in 2021
18
Saudi Arabia's petrochemical plastic production capacity is 18 million tonnes annually as of 2023
19
Ethylene, a key plastic feedstock, had global production of 200 million tonnes in 2022
20
Propylene production for plastics was 130 million tonnes globally in 2022
21
Plastic film production worldwide was 80 million tonnes in 2021
22
Injection molding plastics production accounts for 32% of total plastic processing
23
Extrusion blow molding represents 10% of plastic production volume globally
24
Bioplastic production was 2.2 million tonnes in 2022, 0.5% of total plastics
25
Virgin plastic production from natural gas increased 20% since 2019 to 120 million tonnes in 2022
26
Plastic production energy intensity is 60 GJ per tonne on average
27
China's plastic production grew 6.5% annually from 2015-2020
28
EU plastic converters processed 54.1 million tonnes in 2022
29
Global plastic packaging production was 200 million tonnes in 2022
30
HDPE production globally reached 40 million tonnes in 2022
Interpretation
Production Interpretation
Humanity has gotten so adept at sculpting our own synthetic geological layer that we now produce nearly a billion tons of plastic a year—essentially burying ourselves in our own ingenuity.
05 · Category
Recycling26 stats
01
Plastic recycling rate globally is only 9%, with 79% landfilled or littered
02
In the EU, 41.5% of plastic waste collected for recycling in 2022, 16.1 million tonnes
03
US plastic recycling rate is 5-6%, recycling 3.1 million tons out of 42 million generated in 2018
04
PET bottle recycling rate globally is 18%, recovering 7 million tonnes annually
05
HDPE recycling recovers 30% globally, about 5.5 million tonnes per year
06
Only 1% of plastic bags are recycled worldwide
07
Mechanical recycling processes 17% of EU plastic waste, chemical recycling emerging at 0.1%
08
China banned plastic waste imports in 2018, reducing global recycling by 25%
09
Japan recycles 84% of plastic waste through incineration with energy recovery
10
Germany's plastic packaging recycling rate is 67% as of 2022
11
Global recycled plastic market value $50 billion in 2022, projected to $80 billion by 2030
12
91% of plastic not recycled ends in landfills, incinerators, or environment
13
EU recycled 10.2 million tonnes of plastics in 2022, up 7% from prior year
14
India's plastic recycling rate is 60% informal sector, formal 9%
15
Brazil recycles 1.2% of plastic packaging
16
Chemical recycling capacity globally is 0.3 million tonnes/year
17
rPET production in Europe reached 1 million tonnes in 2022
18
Plastic film recycling in US is 10%, recovering 0.8 million tons annually
19
Multi-layer packaging recycling rate <10% due to complexity
20
Global plastic waste exported for recycling peaked at 14 million tonnes in 2016
21
UK plastic packaging recycling rate 64% in 2022
22
Australia recycles 13% of plastics, with 72% landfilled
23
Pyrolysis recycling yields 70% oil from plastics, but scales to 1 million tonnes globally
24
Sorting technology recovers 95% purity for PET flakes in advanced facilities
25
Plastic-to-plastic recycling circularity is 2-5% currently
26
70% of plastic collected for recycling in developing countries ends up dumped
Interpretation
Recycling Interpretation
The global recycling rate for plastic is a dismal nine percent, which means we are failing so spectacularly that even our landfills are better collectors than our circular economies.
Reference
Cite This Report
This report is designed to be cited. We maintain stable URLs and versioned verification dates. Copy the format appropriate for your publication below.
APA
Samuel Norberg. (2026, February 13). Plastic Statistics. Gitnux. https://gitnux.org/plastic-statistics
MLA
Samuel Norberg. "Plastic Statistics." Gitnux, 13 Feb 2026, https://gitnux.org/plastic-statistics.
Chicago
Samuel Norberg. 2026. "Plastic Statistics." Gitnux. https://gitnux.org/plastic-statistics.
Sources & references
72 datasets cited across this report · attribution is report-level