
More than 70% of surveyed agencies are already using GTFS realtime, yet nearly half of transport departments still flag data interoperability as their biggest MaaS barrier. At the same time, mobility outcomes are shifting fast, from 12% lower average waiting times in MaaS pilots to a 19% drop in private car trips in controlled studies. This post pulls together the industry’s most telling figures across ridesharing, micromobility, ticketing, and safety so you can see what is actually changing and what still isn’t.
Key Takeaways
- 40% of respondents reported that shared mobility services improved urban mobility management in their cities in 2023
- $21.1 billion global revenue from ridesharing in 2022
- $5.3 billion global micromobility market size in 2022
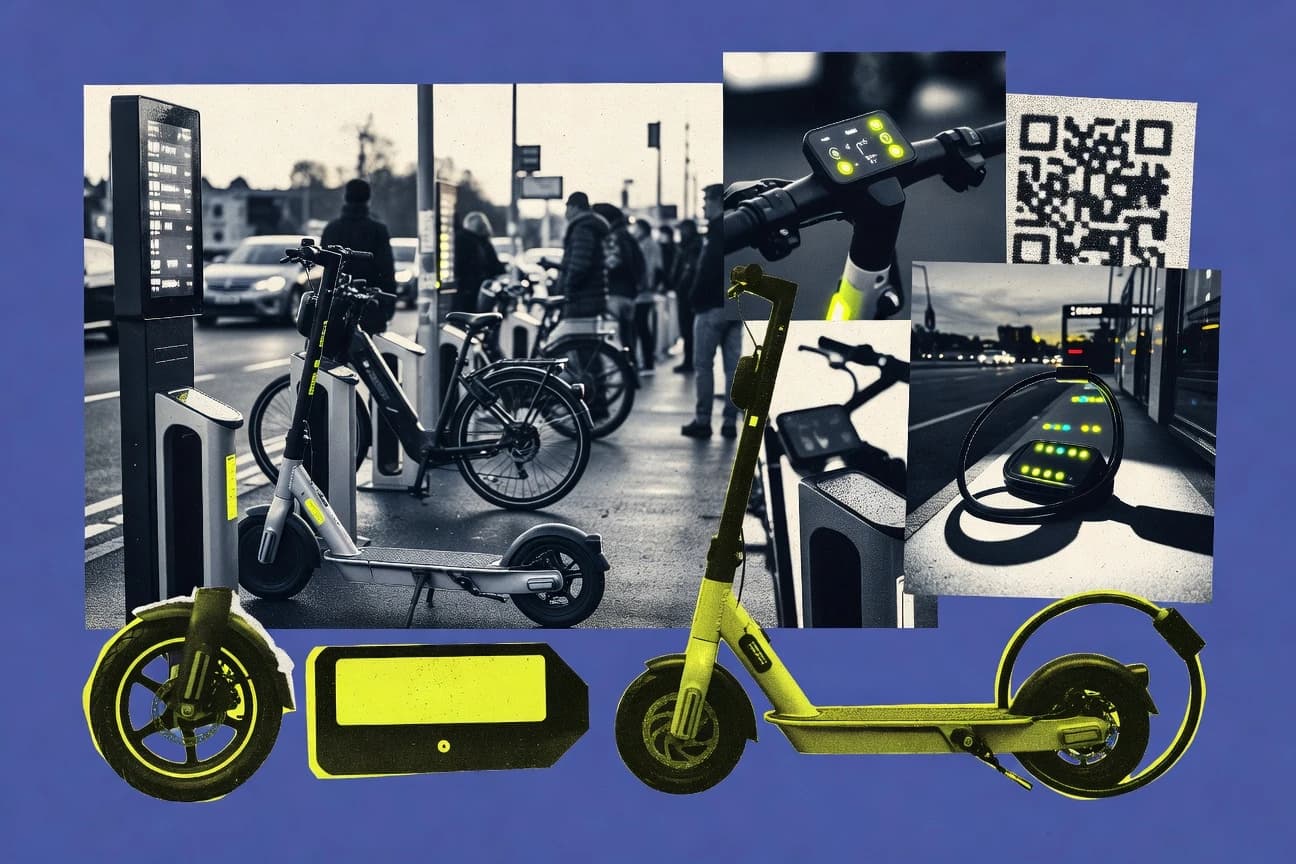
- 600+ cities were deploying micromobility services by end-2022
- 49% of transport agencies said data interoperability is a top barrier to deploying MaaS services
- Rideshare use was associated with 2% of US vehicle miles traveled in 2021 estimates from a travel behavior analysis
- 12% reduction in average waiting time using integrated booking/real-time information in a 2020 MaaS pilot study
- 19% decrease in private car trips after introducing MaaS-integrated mobility plans in a 2019–2021 controlled study
- 15% increase in public-transport ridership attributable to integrated ticketing/MaaS bundles in a European case study
- 25% lower fleet operating costs achieved by operators using predictive repositioning algorithms tested in a 2020–2022 study
- Dockless shared bikes had an average deployment lifespan of 18 months before replacement cycles in a 2020 operational study
- Shared scooters required rebalancing every 1.8 days on average during peak season in a 2021 city operations study
- 16.3% year-over-year growth in US transit ridership to 3.4 billion trips in 2023 (seasonally adjusted)
- Shared mobility safety incidents requiring medical attention were 0.6 per 100,000 rides in 2022 based on hospital surveillance sentinel sites (US)
- Injury severity (proportion of riders transported by ambulance) was 18% for e-scooter crashes in 2022 EMS data
MaaS is already cutting wait times and car trips, but data interoperability remains the biggest rollout barrier.
Related reading
01 · Category
Market Size8 stats
01
40% of respondents reported that shared mobility services improved urban mobility management in their cities in 2023
02
$21.1 billion global revenue from ridesharing in 2022
03
$5.3 billion global micromobility market size in 2022
04
2.7 million electric vehicles (EVs) sold globally in 2019 and 10 million in 2020, growing the addressable electrified mobility market
05
Public charging infrastructure reached 1.5 million outlets globally in 2022
06
The global MaaS/connected mobility data market was $6.4 billion in 2022 (as reported by market research firm on mobility data/connected services)
07
$1.9 billion smart parking market in 2023 supports MaaS parking search/integration ecosystems
08
Docked bike systems accounted for 46% of shared bike fleets in Europe in 2021
Interpretation
Market Size Interpretation
In the Market Size view of Mobility as a Service, the sector’s momentum is clear with $21.1 billion in global ridesharing revenue in 2022 and a $6.4 billion MaaS and connected mobility data market the same year, complemented by $5.3 billion in micromobility and growth in enabling infrastructure such as 1.5 million public charging outlets in 2022.
02 · Category
Industry Trends9 stats
01
600+ cities were deploying micromobility services by end-2022
02
49% of transport agencies said data interoperability is a top barrier to deploying MaaS services
03
Rideshare use was associated with 2% of US vehicle miles traveled in 2021 estimates from a travel behavior analysis
04
Shared mobility injuries increased by 16% from 2021 to 2022 in a US hospital surveillance analysis
05
In 2022, the EU’s urban mobility policies targeted a 90% reduction in road transport GHG by 2050 (context for MaaS decarbonization)
06
GTFS-realtime adoption exceeded 70% among surveyed agencies in 2021
07
70% of local transportation agencies reported using or being able to accept real-time transit data feeds during 2021 (GTFS-realtime readiness)
08
1,500+ transit agencies worldwide published GTFS-realtime feeds by 2023
09
51% of US travelers who used ride-hailing said app-based payments were a key reason for continued use (2019–2023 survey reporting)
Interpretation
Industry Trends Interpretation
Industry Trends in MaaS are accelerating as micromobility expanded to 600+ cities by end 2022 and real time data capabilities rose sharply with GTFS realtime adoption topping 70% in 2021, showing that scalable MaaS is being driven by better interoperability and live transit information.
03 · Category
Performance Metrics10 stats
01
12% reduction in average waiting time using integrated booking/real-time information in a 2020 MaaS pilot study
02
19% decrease in private car trips after introducing MaaS-integrated mobility plans in a 2019–2021 controlled study
03
15% increase in public-transport ridership attributable to integrated ticketing/MaaS bundles in a European case study
04
CO2 emissions per passenger-km were 41% lower for rail than cars in OECD comparisons for 2019
05
Multimodal trip planners reduced the average number of transfers by 0.4 per trip in a 2020 controlled experiment
06
A 2021 peer-reviewed meta-analysis found that MaaS interventions reduced perceived travel time by 10% on average
07
The average occupancy of ride-hailing vehicles in the US was 1.3 persons per vehicle in 2019 survey-based estimates
08
A 1% increase in service availability was associated with a 0.6% increase in rider demand in a regression analysis of shared mobility in 2020
09
A 10-minute improvement in average wait time increased ridership by 7% in a 2018–2020 behavioral study
10
A 10 percentage-point increase in service coverage was associated with a 6–8% increase in ridership demand across dockless micromobility programs (2018–2021 elasticity analysis)
Interpretation
Performance Metrics Interpretation
Across Performance Metrics, MaaS repeatedly shows that small improvements in service and information translate into measurable demand gains, such as a 12% reduction in waiting time leading to higher usage and a 10 minute wait time improvement boosting ridership by 7%.
More related reading
04 · Category
Cost Analysis9 stats
01
25% lower fleet operating costs achieved by operators using predictive repositioning algorithms tested in a 2020–2022 study
02
Dockless shared bikes had an average deployment lifespan of 18 months before replacement cycles in a 2020 operational study
03
Shared scooters required rebalancing every 1.8 days on average during peak season in a 2021 city operations study
04
Maintenance accounted for 35% of shared micromobility operating costs in a 2022 operator cost model
05
Repositioning/rebalancing accounted for 25% of total micromobility costs in a 2019–2021 cost accounting study
06
Maintenance represented 35% of shared micromobility operating costs in a 2022 operator cost model (excluding depreciation and platform overhead)
07
Parking operations and geofencing compliance accounted for about 10% of shared micromobility operating costs in 2022 city/operator cost accounting
08
Rebalancing labor and logistics costs were ~25% of dockless scooter operating costs in 2019–2021 accounting models
09
Vehicle and battery replacement contributed ~15% of operating costs for dockless e-bikes in 2021–2022 (operator maintenance budgets)
Interpretation
Cost Analysis Interpretation
Cost analysis shows that repositioning and maintenance are consistently the biggest controllable expenses, with predictive repositioning cutting fleet operating costs by 25% and maintenance making up about 35% of shared micromobility operating costs in 2022, while rebalancing accounts for roughly 25% of total micromobility costs.
05 · Category
User Adoption1 stats
01
16.3% year-over-year growth in US transit ridership to 3.4 billion trips in 2023 (seasonally adjusted)
Interpretation
User Adoption Interpretation
User adoption for mobility services appears strong as US transit ridership rose 16.3% year over year to 3.4 billion trips in 2023, showing growing rider engagement with public mobility offerings.
06 · Category
Safety & Risk3 stats
01
Shared mobility safety incidents requiring medical attention were 0.6 per 100,000 rides in 2022 based on hospital surveillance sentinel sites (US)
02
Injury severity (proportion of riders transported by ambulance) was 18% for e-scooter crashes in 2022 EMS data
03
39% of surveyed city transportation departments cited curbside safety management as a top micromobility governance challenge in 2023
Interpretation
Safety & Risk Interpretation
Safety & Risk in shared mobility is still a concern, with medical-attention incidents at 0.6 per 100,000 rides in 2022 alongside a high 18% ambulance-transport share for e-scooter crash injuries and 39% of city transportation departments flagging curbside safety management as a major micromobility governance challenge in 2023.
Reference
Cite This Report
This report is designed to be cited. We maintain stable URLs and versioned verification dates. Copy the format appropriate for your publication below.
APA
Catherine Wu. (2026, February 13). Mobility As A Service Industry Statistics. Gitnux. https://gitnux.org/mobility-as-a-service-industry-statistics
MLA
Catherine Wu. "Mobility As A Service Industry Statistics." Gitnux, 13 Feb 2026, https://gitnux.org/mobility-as-a-service-industry-statistics.
Chicago
Catherine Wu. 2026. "Mobility As A Service Industry Statistics." Gitnux. https://gitnux.org/mobility-as-a-service-industry-statistics.
Sources & references
40 datasets cited across this report · attribution is report-level
+19 additional datasets cited (not shown individually)