
Online research shapes 82% of kitchen cabinet purchases, while 68% of U.S. consumers still favor white shaker cabinets in current surveys. Homeowners also keep pushing for functional upgrades, with 52% prioritizing soft-close drawers in new installs. Together, these shifts show a market that is refining style preferences while tightening around delivery and pricing expectations.
Key Takeaways
- 68% of U.S. consumers prefer white shaker cabinets in 2023 surveys.
- The U.S. kitchen cabinets market size reached $13.2 billion in 2023, growing at a CAGR of 4.5% from 2018-2023.
- Shaker style holds 58% market preference in U.S. 2023.
- Annual U.S. kitchen cabinet production output 85 million linear feet in 2023.
- U.S. Northeast holds 28% of national cabinet sales.
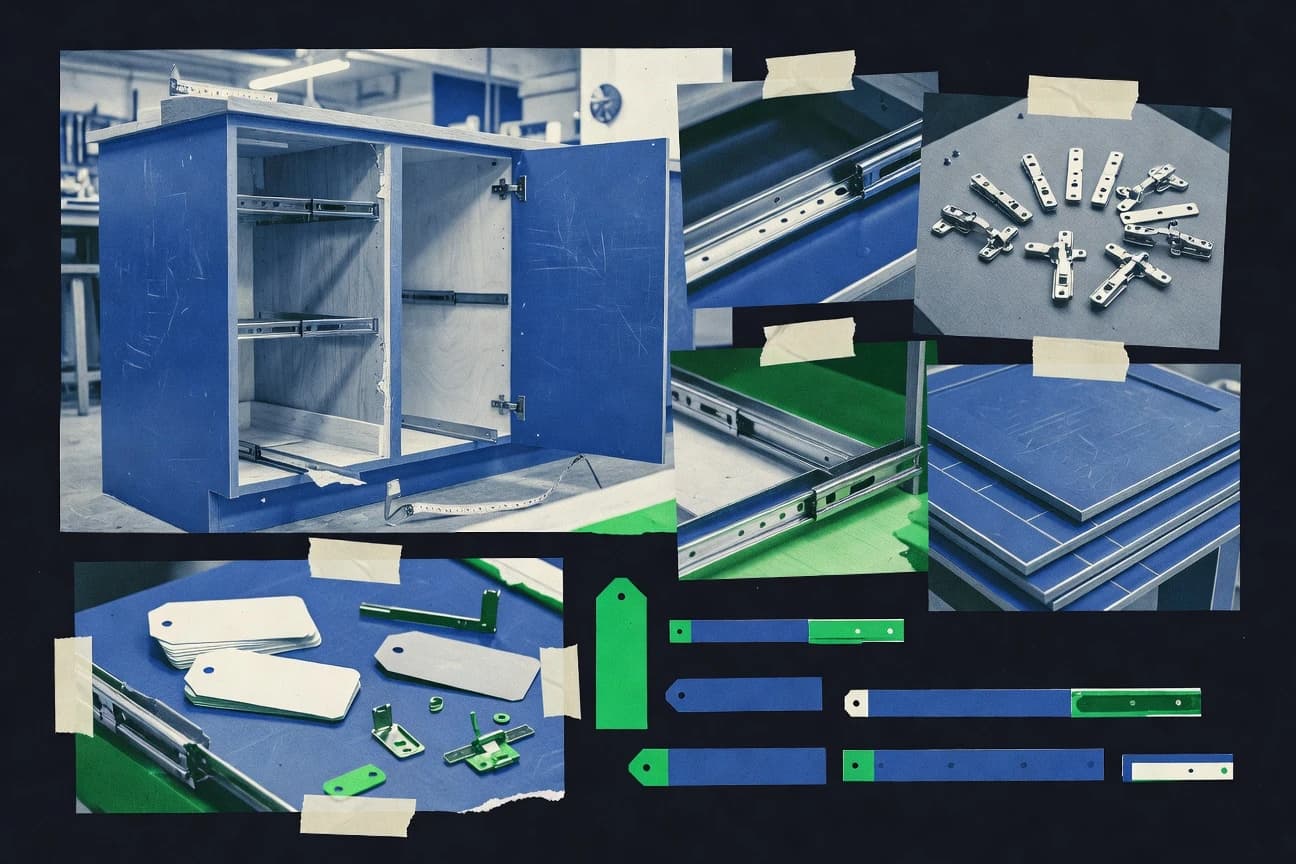
Kitchen cabinet industry growth is driven by rising home renovation demand and consumer preference for modern designs.
Related reading
01 · Category
Consumer Behavior30 stats
01
68% of U.S. consumers prefer white shaker cabinets in 2023 surveys.
02
52% of homeowners prioritize soft-close drawers in new cabinets.
03
Millennial buyers opt for matte finishes in 61% of purchases in 2023.
04
45% increase in demand for handleless cabinets among urban consumers.
05
73% of buyers consider sustainability in cabinet material choices.
06
Average spend on kitchen cabinets per remodel $8,200in U.S. 2023.
07
39% of consumers choose quartz countertops pairing with cabinets.
08
Online research influences 82% of cabinet purchases in 2023.
09
55% prefer two-tone cabinet color schemes in modern kitchens.
10
Gen Z favors open shelving over upper cabinets in 48% designs.
11
67% of high-income buyers select custom cabinets over stock.
12
Warranty importance rated 9.2/10 by 71% of buyers in 2023.
13
29% growth in pull-out pantry cabinet demand post-pandemic.
14
64% of families choose durable laminate over wood veneer.
15
Smart cabinets with integrated tech desired by 23% tech-savvy buyers.
16
51% report budget constraints limit cabinet upgrades in 2023.
17
Blue cabinets popularity surged 34% in coastal regions.
18
77% value easy-clean surfaces in cabinet selections.
19
First-time buyers favor RTA cabinets at 42% adoption rate.
20
36% influenced by social media in cabinet style choices.
21
Eco-labels sway 59% of millennial purchases.
22
Mixed metals in hardware preferred by 47% in 2023.
23
62% prioritize storage capacity over aesthetics alone.
24
Vintage-inspired cabinets up 25% in suburban markets.
25
54% choose gray tones for transitional kitchens.
26
Pet-friendly durable cabinets demanded by 31% households.
27
Butcher block fronts rising 18% in farmhouse styles.
28
69% satisfied with dealer showroom experiences.
29
Oak wood declined to 12% preference from 28% in 2018.
30
44% opt for glass-front uppers for display.
Interpretation
Consumer Behavior Interpretation
The modern American kitchen is a fascinating battleground of values, where timeless white shakers stand firm, but sustainability, soft-close drawers, and a deep online research habit are the new essential forces shaping a landscape where nearly everyone feels budget-pinched but still dreams of quartz, clever storage, and a really, really good warranty.
02 · Category
Market Size & Revenue30 stats
01
The U.S. kitchen cabinets market size reached $13.2 billion in 2023, growing at a CAGR of 4.5% from 2018-2023.
02
Global kitchen cabinets market was valued at $78.5 billion in 2022, projected to reach $112.3 billion by 2030 at 4.7% CAGR.
03
North American kitchen cabinetry revenue hit $15.8 billion in 2023, up 5.2% YoY.
04
European kitchen cabinets sector generated €22.4 billion in sales in 2022.
05
U.S. semi-custom kitchen cabinets segment accounted for 42% of market share in 2023 valued at $5.54 billion.
06
Stock kitchen cabinets in the U.S. generated $4.1 billion in 2023, representing 31% market share.
07
Custom kitchen cabinets market in U.S. was $3.56 billion in 2023 with 27% share.
08
Asia-Pacific kitchen cabinets market valued at $28.7 billion in 2022, fastest growing region at 6.1% CAGR.
09
Residential sector dominated U.S. kitchen cabinets with 78% revenue share at $10.3 billion in 2023.
10
Commercial kitchen cabinets in U.S. contributed $2.9 billion or 22% of total market in 2023.
11
IKEA's kitchen cabinet sales reached $14.2 billion globally in FY2023.
12
U.S. kitchen remodel market, including cabinets, totaled $28.4 billion in 2023.
13
Online kitchen cabinets sales in U.S. grew to $1.8 billion in 2023, 14% of total.
14
Premium kitchen cabinets segment in Europe valued at €8.9 billion in 2022.
15
China kitchen cabinets production value hit ¥450 billion in 2023.
16
U.S. kitchen cabinet exports reached $1.2 billion in 2023.
17
Imports of kitchen cabinets to U.S. totaled $4.5 billion in 2023, mainly from China.
18
Average revenue per U.S. kitchen cabinet manufacturer was $45.6 million in 2023.
19
Top 10 U.S. kitchen cabinet firms controlled 35% of market revenue in 2023.
20
Projected U.S. kitchen cabinets market to $18.7 billion by 2030 at 5.1% CAGR.
21
Global modular kitchen cabinets market at $42.3 billion in 2023.
22
U.S. RTA kitchen cabinets sales $2.9 billion in 2023.
23
Kitchen cabinets part of $450 billion global furniture market, 17% share.
24
Canada kitchen cabinets market $2.1 billion CAD in 2023.
25
UK kitchen furniture market £3.2 billion in 2023.
26
India kitchen cabinets market $5.6 billion in 2023, 12% CAGR.
27
Australia kitchen cabinets revenue AUD 1.8 billion in 2023.
28
Brazil kitchen cabinets market BRL 12.4 billion in 2023.
29
South Korea kitchen cabinets $3.4 billion USD in 2023.
30
Mexico kitchen cabinets imports $850 million in 2023.
Interpretation
Market Size & Revenue Interpretation
Despite their humble role as mere storage, kitchen cabinets have cooked up a staggering global economy where America's semi-custom preferences and IKEA's flat-pack empire quietly dominate a $450 billion furniture world, proving we will pay a pretty penny to hide our pots and pans.
03 · Category
Material & Design Trends28 stats
01
Shaker style holds 58% market preference in U.S. 2023.
02
Quartz composite cabinets grew 22% in popularity.
03
Matte black finishes used in 37% modern designs.
04
Frameless European-style cabinets 41% of new installs.
05
Recycled ocean plastic cabinets launched in 15% premium lines.
06
High-gloss acrylic doors 26% share in urban luxury.
07
Thermofoil materials down 8% due to durability concerns.
08
Walnut wood premium segment up 19% in 2023.
09
LED-integrated cabinetry standard in 33% new kitchens.
10
Bamboo sustainable option in 11% eco-designs.
11
Textured laminates mimic wood at 29% adoption.
12
Brass hardware accents in 52% transitional styles.
13
Painted cabinets 63% of total color applications.
14
Slab door designs up 31% in contemporary markets.
15
FSC-certified wood 71% in North American production.
16
Marble-effect laminates 24% in budget renovations.
17
Soft-touch lacquer finishes 18% luxury segment.
18
Aluminum frames for glass panels 14% increase.
19
Cork-lined drawers in 9% wellness-focused kitchens.
20
Carbon-neutral paints used on 27% cabinets.
21
Inset doors traditional 22% vs overlay 78%.
22
Vegan leather cabinet fronts 7% emerging trend.
23
Antique brass distressing 35% farmhouse appeal.
24
Phenolic resin panels 16% commercial use.
25
Two-toned shaker 49% most requested combo.
26
Stainless steel cabinets 12% in pro kitchens.
27
Terrazzo-look laminates up 21%.
28
Finger-pull profiles replace knobs in 56% minimalist.
Interpretation
Material & Design Trends Interpretation
In a sea of trends that would make a designer's head spin, it seems America’s kitchen style is a masterclass in modern pragmatism: we’re loyal to the timeless simplicity of Shaker cabinets but love to accessorize them with eco-tech, black matte drama, and the quiet luxury of hidden finger pulls.
More related reading
04 · Category
Production & Manufacturing29 stats
01
Annual U.S. kitchen cabinet production output 85 million linear feet in 2023.
02
China produced 1.2 billion sqm of kitchen cabinets in 2023.
03
U.S. manufacturers used 2.8 million cubic meters of plywood for cabinets in 2023.
04
Average production cycle for custom U.S. kitchen cabinets is 6-8 weeks in 2023.
05
65% of U.S. kitchen cabinets manufactured with CNC machinery in 2023.
06
Global kitchen cabinet factories numbered 45,000 in 2023.
07
U.S. cabinet industry employed 92,500 workers in manufacturing in 2023.
08
Automation rate in European kitchen cabinet production reached 72% in 2023.
09
Particleboard usage in global kitchen cabinets 48% of total materials in 2023.
10
U.S. kitchen cabinet waste generation 1.2 million tons annually in 2023.
11
MDF panels production for cabinets in Europe 15 million m3 in 2023.
12
Robotic assembly lines in top 50 global cabinet makers increased 28% in 2023.
13
U.S. custom cabinet lead time averaged 45 days in 2023 surveys.
14
China kitchen cabinet export production capacity 60% of global total in 2023.
15
Sustainable wood sourcing in U.S. cabinet production 82% certified in 2023.
16
Energy consumption per cabinet unit dropped 15% in U.S. factories 2018-2023.
17
Number of U.S. kitchen cabinet plants decreased to 1,250 in 2023 from 1,500 in 2018.
18
Laser cutting adoption in cabinet manufacturing 55% globally in 2023.
19
Annual output per U.S. cabinet worker 12,500 lf in 2023.
20
Recycled content in U.S. cabinet materials averaged 22% in 2023.
21
3D printing prototypes used in 18% of U.S. cabinet design firms in 2023.
22
Global kitchen cabinet paint/coating production 450,000 tons in 2023.
23
U.S. factory defect rate for cabinets fell to 2.1% in 2023.
24
Hardware components per average kitchen cabinet set 450 pieces in 2023.
25
Vietnam kitchen cabinet production grew 22% to 120 million units in 2023.
26
76% of U.S. cabinets use soft-close mechanisms standard in 2023.
27
Powder coating lines in operation 1,200 globally for cabinets in 2023.
28
U.S. cabinet edgebanding machine installations up 19% in 2023.
29
41% of global production shifted to frameless cabinets by 2023.
Interpretation
Production & Manufacturing Interpretation
While American craftsmanship excels in custom precision with shrinking plants and rising automation—producing mountains of plywood cabinets for a nation obsessed with soft-close drawers—the sheer, staggering scale of global output, dominated by China’s billions and Vietnam’s surge, reminds us that our beloved kitchens are born from a relentless, efficient, and often wasteful industrial machine striving to become leaner and greener.
05 · Category
Regional & Global Insights21 stats
01
U.S. Northeast holds 28% of national cabinet sales.
02
California kitchen cabinet market $2.1 billion in 2023.
03
Germany leads Europe with €6.8 billion cabinet revenue.
04
China exports 65% of global kitchen cabinets $25B value.
05
Florida remodel boom drove 15% cabinet sales growth.
06
Middle East kitchen cabinets market $4.2B growing 7.2% CAGR.
07
Texas cabinet imports from Mexico up 32% in 2023.
08
Italy kitchen cabinet exports €3.1 billion to U.S./EU.
09
Southeast Asia production hub Vietnam 18% global share.
10
UK post-Brexit cabinet prices up 12% regionally.
11
Australia imports 70% cabinets from Asia $1.2B value.
12
Midwest U.S. stock cabinets dominate 45% local sales.
13
Poland emerged as EU cabinet exporter $2.4B in 2023.
14
India domestic market 35% urban metro cities.
15
Canada Quebec province 22% national cabinet production.
16
Turkey kitchen exports to Europe $1.8B in 2023.
17
Pacific Northwest U.S. sustainable cabinets 41% sales.
18
Brazil Sao Paulo state 55% national market share.
19
South Africa imports $450M cabinets mostly Asia.
20
Japan high-end cabinet market ¥900B domestic.
21
New York City luxury segment $850M in 2023.
Interpretation
Regional & Global Insights Interpretation
The global kitchen cabinet landscape reveals a story of regional dominance and strategic trade, where America's Northeast holds court, California flexes its financial muscle, and Florida's remodeling boom cooks up profits, while China feeds the world's appetite for cabinets, Germany anchors Europe, and everyone else is either scrambling for a piece of the countertop or paying a premium for it.
Reference
Cite This Report
This report is designed to be cited. We maintain stable URLs and versioned verification dates. Copy the format appropriate for your publication below.
APA
Thomas Lindqvist. (2026, February 13). Kitchen Cabinets Industry Statistics. Gitnux. https://gitnux.org/kitchen-cabinets-industry-statistics
MLA
Thomas Lindqvist. "Kitchen Cabinets Industry Statistics." Gitnux, 13 Feb 2026, https://gitnux.org/kitchen-cabinets-industry-statistics.
Chicago
Thomas Lindqvist. 2026. "Kitchen Cabinets Industry Statistics." Gitnux. https://gitnux.org/kitchen-cabinets-industry-statistics.
Sources & references
100 datasets cited across this report · attribution is report-level