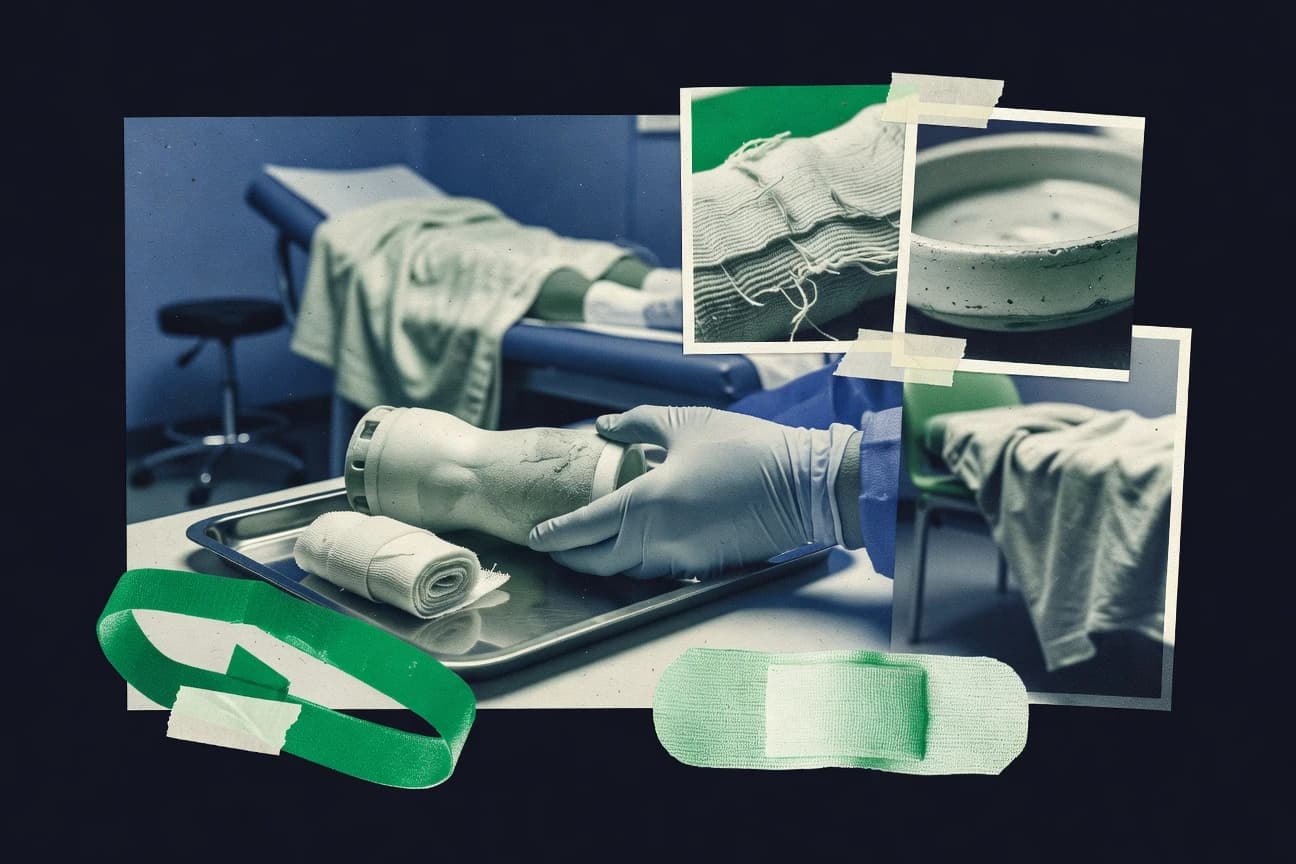

With 140,000 lower limb amputations each year in the United States among people with diabetes, the scale is hard to ignore and the toll starts long before a surgery date. After a diabetes amputation, survival and recovery can look stark with 5 year mortality reported at 44 to 68 percent and a 50 percent one year readmission rate driven mostly by infections. This post pulls together the latest statistics behind diabetes amputation outcomes and the factors that change them, including prevention measures like foot screening and multidisciplinary care.
Key Takeaways
- 5-year mortality post-diabetes amputation is 44-68%
- Contralateral amputation occurs in 30% of patients within 3 years of first amputation
- Hospital length of stay for diabetes amputation averages 12.5 days
- In the United States, approximately 140,000 lower limb amputations occur annually among people with diabetes, representing about 60% of all non-traumatic lower-limb amputations
- Globally, diabetes contributes to over 1 million lower-limb amputations each year
- In 2019, the age-adjusted amputation rate for people with diagnosed diabetes in the US was 12.4 per 1,000 person-years
- Annual foot screening reduces amputation rates by 85% in high-risk groups
- Multidisciplinary foot care teams lower major amputation rates by 50%
- Tight glycemic control (HbA1c <7%) cuts amputation risk by 40%
- Peripheral neuropathy affects 50% of type 2 diabetes patients and is the primary risk factor for amputation
- Poor glycemic control (HbA1c >9%) increases amputation risk by 3.5-fold in diabetics
- Smoking doubles the risk of amputation in diabetes patients with peripheral artery disease
- US lifetime cost of diabetes amputation exceeds $50,000 per patient
- Annual US healthcare expenditure for diabetes amputations totals $11 billion
- Medicare spends $8,200 more per amputee diabetic vs non-amputee annually
Diabetes-related amputations carry high mortality and readmission rates, but screening and specialized care can greatly reduce them.
Related reading
01 · Category
Clinical Outcomes25 stats
01
5-year mortality post-diabetes amputation is 44-68%
02
Contralateral amputation occurs in 30% of patients within 3 years of first amputation
03
Hospital length of stay for diabetes amputation averages 12.5 days
04
1-year readmission rate post-amputation is 50% in diabetics, primarily for infections
05
Pain prevalence post-lower limb amputation in diabetics is 65% at 6 months
06
Functional mobility recovery: only 40% regain independent walking 1 year post-amputation
07
Phantom limb pain affects 60% of diabetic amputees long-term
08
Wound healing failure rate in minor amputations is 25%, leading to major ones
09
Cardiovascular mortality post-amputation is 25% within 2 years
10
Prosthesis use success rate is 50% in diabetic amputees due to comorbidities
11
Depression incidence post-amputation reaches 42% at 2 years
12
Infection recurrence in stumps occurs in 20% within 6 months
13
Balance impairment leads to 35% fall rate in first year post-amputation
14
Quality of life SF-36 scores drop 40% post-major amputation in diabetics
15
30-day postoperative mortality for diabetes amputation is 5-10%
16
Skin graft failure in amputation sites is 15% higher in diabetics
17
Heterotopic ossification occurs in 20% of below-knee amputations
18
ADL independence lost in 55% of bilateral amputees
19
Neuropathic pain management succeeds in only 30% of cases
20
Revision surgery rate for amputations is 18% within 1 year
21
Energy expenditure for walking increases 25% post-unilateral amputation
22
Cognitive impairment prevalence doubles post-amputation to 28%
23
Sexual dysfunction worsens to 80% in male diabetic amputees
24
Osteomyelitis resolution post-amputation only 70%
25
Gait speed reduces to 0.6 m/s post-amputation from 1.0 m/s baseline
Interpretation
Clinical Outcomes Interpretation
Under clinical outcomes, diabetes-related amputations are linked with severe, persistent consequences, including 44 to 68% 5-year mortality, a 50% 1-year readmission rate driven largely by infections, and only 40% regaining independent walking within a year.
02 · Category
Epidemiology30 stats
01
In the United States, approximately 140,000 lower limb amputations occur annually among people with diabetes, representing about 60% of all non-traumatic lower-limb amputations
02
Globally, diabetes contributes to over 1 million lower-limb amputations each year
03
In 2019, the age-adjusted amputation rate for people with diagnosed diabetes in the US was 12.4 per 1,000 person-years
04
Among US adults with diabetes aged 65 years or older, the annual incidence of lower extremity amputation is 23.2 per 1,000
05
In England, the incidence of major lower limb amputation due to diabetes was 15.7 per 100,000 in 2017-2018
06
Australian data from 2015-2019 shows 4,400 diabetes-related amputations annually
07
In Germany, diabetes accounts for 70% of non-traumatic amputations, with 40,000 cases yearly
08
Canadian indigenous populations have a diabetes amputation rate 3 times higher than non-indigenous, at 150 per 100,000
09
In Brazil, diabetes-related amputations increased by 27% from 2008 to 2017, reaching 12,000 cases
10
South African studies report 25% of hospital admissions for diabetic foot infections lead to amputation
11
In the US, Black adults with diabetes have a 1.6 times higher amputation rate than whites (18.7 vs 11.7 per 1,000)
12
Hispanic US adults with diabetes face 1.3 times the amputation risk compared to non-Hispanics
13
Men with diabetes undergo amputations 1.5 times more frequently than women globally
14
In Europe, type 2 diabetes patients have a 20-fold increased risk of amputation compared to non-diabetics
15
US Medicare data shows 25% of diabetes patients develop foot ulcers leading to potential amputation within a lifetime
16
In India, diabetic foot ulcers precede 80% of amputations, with 100,000 cases yearly
17
Japanese national data indicates 5,500 diabetes-related amputations in 2016
18
In Scotland, amputation rates for diabetes fell 30% from 2004-2014 due to screening, from 25 to 17 per 100,000
19
French registries report 11,000 diabetes amputations annually
20
In Mexico, diabetes causes 70% of amputations, with rates at 40 per 100,000 diabetics
21
US veterans with diabetes have amputation rates of 6.6 per 1,000 person-years
22
In the UK, 120 major amputations per week are diabetes-related
23
Italian cohort studies show 2.8% annual amputation incidence in type 2 diabetes
24
In Sweden, diabetes doubles amputation risk, with 1,200 cases yearly
25
New Zealand Maori with diabetes have 2.5 times higher amputation rates
26
In China, urban diabetes patients have 15% lifetime amputation risk
27
Russian data estimates 50,000 diabetes amputations per year
28
In Turkey, 52% of amputations are diabetes-related
29
Spanish national survey: 4.6 amputations per 10,000 diabetics annually
30
In Poland, diabetes accounts for 55% of lower limb amputations
Interpretation
Epidemiology Interpretation
Epidemiology data show that diabetes drives a high and persistent amputation burden, with about 140,000 lower-limb amputations in the US each year and rates around 12.4 per 1,000 person-years in diagnosed adults, while other countries similarly report thousands of diabetes-related amputations annually, underscoring the wide global impact.
03 · Category
Interventions25 stats
01
Annual foot screening reduces amputation rates by 85% in high-risk groups
02
Multidisciplinary foot care teams lower major amputation rates by 50%
03
Tight glycemic control (HbA1c <7%) cuts amputation risk by 40%
04
Smoking cessation programs reduce amputation incidence by 30% over 5 years
05
Revascularization (angioplasty/bypass) saves limbs in 70% of critical ischemia cases
06
Offloading total contact casts heal 80% of neuropathic ulcers in 6 weeks
07
Prophylactic surgery for deformities prevents 60% of ulcer recurrences
08
Negative pressure wound therapy improves healing by 40% in post-amputation wounds
09
Statin therapy reduces amputation by 25% in PAD-diabetes patients
10
ACE inhibitors lower amputation risk by 20% via nephropathy protection
11
Custom orthotics reduce ulcer incidence by 55% in high-risk feet
12
Hyperbaric oxygen therapy salvages 65% of threatened limbs
13
Patient education on foot care decreases amputation by 45%
14
Early debridement (<48 hours) of infected ulcers prevents 70% of amputations
15
SGLT2 inhibitors reduce major amputations by 15% in trials
16
Vascular surgery prior to ulceration halves amputation rates
17
Bioengineered skin substitutes heal 50% more ulcers without amputation
18
Glycemic monitoring with CGM lowers severe events leading to amputation by 35%
19
Weight loss >10% body weight cuts PAD progression by 28%
20
Telemedicine foot monitoring reduces hospital admissions by 40%
21
Aspirin therapy prevents 20% of microvascular complications
22
Podiatry referrals within 2 weeks heal 75% of ulcers conservatively
23
Exercise programs improve circulation, reducing amputation by 25%
24
Antibiotic stewardship in osteomyelitis avoids 30% of surgeries
25
Stem cell therapy trials show 60% limb salvage in refractory cases
Interpretation
Interventions Interpretation
For the interventions category, combining targeted prevention and care measures can dramatically reduce diabetes-related amputations, such as annual foot screening cutting rates by 85% in high-risk groups and multidisciplinary foot teams lowering major amputation rates by 50%.
More related reading
04 · Category
Risk Factors27 stats
01
Peripheral neuropathy affects 50% of type 2 diabetes patients and is the primary risk factor for amputation
02
Poor glycemic control (HbA1c >9%) increases amputation risk by 3.5-fold in diabetics
03
Smoking doubles the risk of amputation in diabetes patients with peripheral artery disease
04
Duration of diabetes over 10 years triples the likelihood of lower limb amputation
05
Peripheral arterial disease (PAD) is present in 50% of diabetes-related amputations
06
Diabetic foot ulcers recur in 40% of patients within one year, leading to 20% amputation rate
07
Insulin use correlates with 2.2 times higher amputation risk due to advanced disease
08
Chronic kidney disease stage 4-5 increases amputation odds by 4.1 in diabetics
09
Obesity (BMI >30) raises amputation risk by 1.8-fold in type 2 diabetes
10
Previous amputation increases risk of contralateral amputation by 50% within 5 years
11
Visual impairment from retinopathy doubles foot ulcer and amputation risk
12
Hypertension control below 140/90 mmHg reduces amputation risk by 25%
13
Charcot neuroarthropathy occurs in 0.5-2% of diabetics and precedes 10% of amputations
14
Low ankle-brachial index (<0.9) predicts 5-year amputation risk of 10%
15
Male gender increases amputation hazard ratio to 1.4 in diabetic cohorts
16
Age over 65 years elevates amputation incidence to 28 per 1,000 person-years
17
Socioeconomic deprivation raises amputation rates by 2-fold in urban diabetics
18
Infection in foot ulcers increases amputation probability to 20% if untreated
19
Wagner grade 3+ ulcers have 28% amputation rate within 1 year
20
Anemia (Hb <11 g/dL) triples amputation risk in hospitalized diabetics
21
Hyperlipidemia uncontrolled raises PAD progression and amputation by 1.7x
22
Lack of annual foot exams increases amputation risk by 2.5 times
23
Binge alcohol consumption (>5 drinks/day) elevates risk by 1.9-fold
24
Retinopathy severity grade 4 increases amputation odds ratio to 2.3
25
Dialysis-dependent CKD patients have 10-fold amputation risk
26
Foot deformity (claw toes) present in 30% of high-risk amputation cases
27
Postprandial hyperglycemia peaks (>200 mg/dL) correlate with 3x neuropathy risk
Interpretation
Risk Factors Interpretation
For the risk factors behind diabetic amputation, the data show a clear pattern where poor control and established disease sharply raise risk, with HbA1c over 9% increasing amputation risk by 3.5 times and diabetes lasting more than 10 years tripling the likelihood, alongside major contributors like peripheral neuropathy in 50% of patients and PAD showing up in 50% of diabetes-related amputations.
05 · Category
Socioeconomic Burden26 stats
01
US lifetime cost of diabetes amputation exceeds $50,000per patient
02
Annual US healthcare expenditure for diabetes amputations totals $11 billion
03
Medicare spends $8,200more per amputee diabetic vs non-amputee annually
04
Lost productivity from diabetes amputation costs $3.4 billion yearly in US
05
Global economic burden of diabetes foot disease is $10-15 billion annually
06
UK NHS amputation costs average £30,000 per major case
07
Informal caregiving for amputees adds $2,500yearly per patient
08
Disability benefits post-amputation average $15,000/year in US
09
Prosthesis costs $10,000-20,000 initially, plus $5,000 maintenance yearly
10
Rehabilitation post-amputation costs $25,000-50,000 per episode
11
Employment rate drops to 20% post-amputation from 50% pre-diabetes
12
Family income loss averages 40% after major amputation
13
Hospital readmission costs for amputees $20,000per year extra
14
Low-income diabetics have 2x amputation costs due to delayed care
15
Australia spends AUD 1 billion yearly on diabetes complications including amputations
16
Insurance premiums rise 25% post-amputation for diabetics
17
Nursing home admission triples costs to $60,000/year post-amputation
18
Preventive foot care saves $12,000per avoided amputation
19
Rural patients incur 30% higher travel costs for amputation care
20
Lifetime societal cost per amputation $1.5 million including indirect costs
21
Women amputees face 15% higher long-term care costs due to longevity
22
Veteran Affairs amputation care costs $1.2 billion annually
23
Home modification expenses average $8,000post-amputation
24
Lost wages over 5 years post-amputation total $100,000average
25
Emergency department visits double, costing $4,000extra yearly
26
Minority groups bear 50% higher per capita amputation economic burden
Interpretation
Socioeconomic Burden Interpretation
Diabetes amputations create a heavy socioeconomic burden in the US and beyond, costing Americans over $50,000 per patient over a lifetime and adding up to $11 billion each year in healthcare spending plus $3.4 billion in lost productivity.
report visual · Key figures
Diabetes amputation outcomes and follow-up risks
Key outcomes after diabetes-related amputation are substantial—mortality is high and complications/readmissions are common.
-68%
5-year mortality post-diabetes amputation is 44-68%
-10%
30-day postoperative mortality for diabetes amputation is 5-10%
50%
1-year readmission rate post-amputation is 50% in diabetics, primarily for infections
30%
Contralateral amputation occurs in 30% of patients within 3 years of first amputation
65%
Pain prevalence post-lower limb amputation in diabetics is 65% at 6 months
40%
Functional mobility recovery: only 40% regain independent walking 1 year post-amputation
Reference
Cite This Report
This report is designed to be cited. We maintain stable URLs and versioned verification dates. Copy the format appropriate for your publication below.
APA
Helena Kowalczyk. (2026, February 13). Diabetes Amputation Statistics. Gitnux. https://gitnux.org/diabetes-amputation-statistics
MLA
Helena Kowalczyk. "Diabetes Amputation Statistics." Gitnux, 13 Feb 2026, https://gitnux.org/diabetes-amputation-statistics.
Chicago
Helena Kowalczyk. 2026. "Diabetes Amputation Statistics." Gitnux. https://gitnux.org/diabetes-amputation-statistics.
Sources & references
12 datasets cited across this report · attribution is report-level