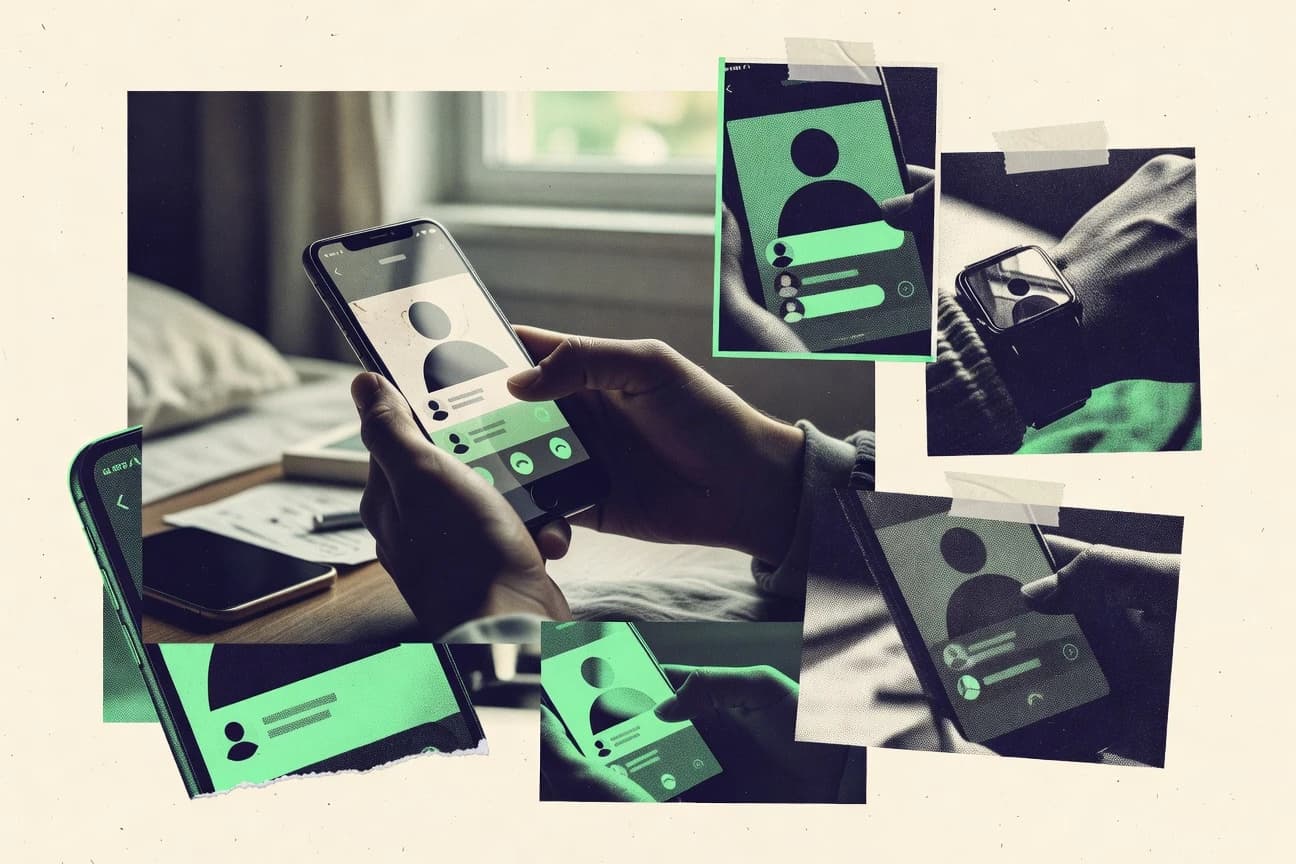

Dating app use spans major groups, with adoption varying across age, gender, and location. The page walks through how people engage day to day—peak usage times, swipe and session habits, and differences in match-to-conversation behavior. It also highlights the social dynamics that affect experience, including harassment, unwanted explicit photos, ghosting, and how moderation and verification tools influence safety.
Key Takeaways
- Average daily active users on Tinder reached 75 million in 2023, with peak usage between 6-10 PM
- Bumble users spend 30 minutes per day on average, 25% higher than Tinder, Q1 2023
- 1.6 billion swipes occur daily on Tinder globally in 2023
- 26% of Tinder matches lead to a conversation within 24 hours, 2023 data
- Bumble reports 90,000 couples married or engaged since launch
- Hinge's "Designed to be Deleted" slogan: 3 million dates from matches in 2023
- 42% of users report unwanted explicit photos received weekly
- 57% of women experienced harassment on dating apps, vs 21% men, Pew 2023
- Tinder bans 1.3 million accounts yearly for policy violations
- 55% of Tinder users report ghosting after matches
- 71% of women on Bumble prefer video chats before meeting, 2023 survey
- Hinge users share 3 photos on average, profiles with prompts get 40% more likes
- In 2023, 45.2% of Tinder users in the US were aged 18-24, totaling about 12.5 million users
- Globally, Bumble has 42 million active users as of Q1 2023, with 72% female users in heterosexual matches
- 37% of US adults aged 25-34 have used dating apps, higher than any other age group, per 2022 survey
Dating apps are thriving, with fast chats, heavy daily swipes, and major safety concerns shaping user behavior.
Related reading
01 · Category
App Usage Statistics26 stats
01
Average daily active users on Tinder reached 75 million in 2023, with peak usage between 6-10 PM
02
Bumble users spend 30 minutes per day on average, 25% higher than Tinder, Q1 2023
03
1.6 billion swipes occur daily on Tinder globally in 2023
04
Hinge users open the app 7 times per week on average, session length 12 minutes
05
55 million matches made weekly on Badoo in 2023
06
OkCupid users send 3 million messages daily, with response rate of 22%
07
Match Group apps see 14 billion interactions annually, peak on weekends
08
Grindr has 13 million monthly active users, 1 million daily logins, 2023
09
42% of dating app users check profiles during work hours, per 2022 survey
10
eHarmony users log in 5.2 times weekly, higher for premium members
11
Plenty of Fish: 2.5 million conversations started daily
12
68% of users open dating apps within 30 minutes of waking up, Morning Consult 2023
13
Zoosk: 500,000 new signups monthly, 80% mobile-only users
14
HER app: 400,000 weekly active users, 20% daily growth in communities
15
Happn records 100 million messages monthly, urban users swipe 50 times/day
16
Coffee Meets Bagel: users like 21 profiles daily on average
17
Feeld: 2 million users, 1 million kinks selected monthly
18
EliteSingles: 85,000 new members monthly, 2-hour weekly engagement
19
Thursday app: 100,000 downloads weekly during launch peaks
20
Pure: sessions average 15 minutes, 70% nighttime usage
21
BLK: 5 million downloads, 50,000 daily active users
22
Chispa: Latino users send 1 million messages/week
23
Lex: 100,000 posts monthly, 40% repeat daily visitors
24
SilverSingles: over-50s log in 4 times/week average
25
OurTime: 1.5 million monthly visitors, peak Sunday evenings
26
Tantan: 389 million users, 60 million daily actives in China
Interpretation
App Usage Statistics Interpretation
In 2023, dating app usage is heavily driven by high daily engagement, from Tinder’s 75 million average daily active users and 1.6 billion daily swipes to Hinge’s 7 app opens per week at 12 minutes per session.
02 · Category
Matching And Success Metrics27 stats
01
26% of Tinder matches lead to a conversation within 24 hours, 2023 data
02
Bumble reports 90,000 couples married or engaged since launch
03
Hinge's "Designed to be Deleted" slogan: 3 million dates from matches in 2023
04
1 in 3 OkCupid users find a long-term partner, per internal 2022 study
05
eHarmony claims responsibility for 4% of US marriages, 2 million couples
06
Grindr facilitated 10 million real-life meetups in 2023
07
Match.com: 1.6 million success stories annually
08
Plenty of Fish: 50,000 new relationships weekly
09
Zoosk: 40% of users go on dates within first week
10
Badoo: 400 million matches made since inception
11
Coffee Meets Bagel: 91% of users seeking serious relationships, 50% lead to dates
12
HER: 20% of users report finding love, community events boost by 30%
13
Happn: 1 match per 10 encounters in real life
14
Feeld: 35% of connections lead to meetups, poly users 50% higher
15
EliteSingles: 2,500 singles find love monthly
16
12% of dating app users marry someone they met online, Pew 2023
17
Hinge dates: average 2nd date rate 40% after first meetup
18
Bumble women initiate 60% more conversations leading to dates
19
Tinder Gold boosts match rate by 20x for users
20
OkCupid algorithm matches lead to 15% higher satisfaction
21
SilverSingles: 80% of matches result in messages for seniors
22
BLK: 25% higher response rates in same-community matches
23
Chispa: 30% of Latino matches lead to 3+ dates
24
Lex: 45% of ads lead to connections, text-based success
25
Thursday: weekend matches 2x more likely to meet IRL
26
Pure: 70% of chats lead to meetups within 24 hours
27
OurTime: 1 in 5 over-50s find partners
Interpretation
Matching And Success Metrics Interpretation
Across matching and success metrics, dating apps are translating connections into real outcomes at meaningful scale, with examples like Tinder converting 26% of matches into chats within 24 hours and Grindr driving 10 million real-life meetups in 2023.
03 · Category
Safety, Privacy, And Risks27 stats
01
42% of users report unwanted explicit photos received weekly
02
57% of women experienced harassment on dating apps, vs 21% men, Pew 2023
03
Tinder bans 1.3 million accounts yearly for policy violations
04
Bumble's photo verification used by 60% of users, reduces catfishing 80%
05
30% of users share location data, raising stalking risks
06
Hinge reports 25% increase in scam detections via AI in 2023
07
Grindr faced 15% data breach complaints, location spoofing common
08
19% of OkCupid users encounter romance scams annually
09
eHarmony: 95% encrypted data, but 10% report fake profiles
10
Match Group apps: 11 million safety reports processed in 2023
11
Plenty of Fish: video verification cuts fake accounts by 70%
12
63% fear doxxing on dating apps, per Norton 2023 survey
13
Zoosk: AI flags 500,000 suspicious profiles monthly
14
Badoo: selfie verification adopted by 40%
15
HER: community moderation removes 90% toxic content in 24h
16
Happn: blurred photos until mutual like, reduces harassment 50%
17
Feeld: anonymous mode used by 65%, kink privacy high
18
EliteSingles: ID verification for premium, 5% fraud rate
19
53% of LGBTQ+ users face more safety issues
20
Coffee Meets Bagel: private mode limits visibility, used by 30%
21
Pure: self-destructing chats, 99% data deleted post-use
22
SilverSingles: senior-focused moderation, 20% fewer incidents
23
BLK: cultural sensitivity training for mods, 40% less bias reports
24
Chispa: Spanish moderation team, reduces miscomms 25%
25
Lex: no images policy cuts harassment 60%
26
Thursday: event vetting, zero assaults reported at official events
27
OurTime: emergency support button used 10,000 times yearly
Interpretation
Safety, Privacy, And Risks Interpretation
Safety and privacy risks are widespread, with 57% of women reporting harassment and 42% receiving unwanted explicit photos weekly, while 30% sharing location data and 1.3 million yearly Tinder bans show that dating apps still need stronger protections.
More related reading
04 · Category
User Behaviors And Preferences26 stats
01
55% of Tinder users report ghosting after matches
02
71% of women on Bumble prefer video chats before meeting, 2023 survey
03
Hinge users share 3 photos on average, profiles with prompts get 40% more likes
04
62% of OkCupid users filter by politics post-2020 election
05
eHarmony users complete 29 dimensions quiz, 80% value compatibility scores
06
Grindr: 40% edit profiles weekly for better matches
07
48% of dating app users lie about height by 1-2 inches
08
Match.com: 65% prefer coffee dates as first meetup
09
Plenty of Fish: live streaming views up 300% in 2023
10
Zoosk: 75% of messages reference profile details increase responses 30%
11
Badoo users send 60 billion messages yearly, emojis boost replies 25%
12
Coffee Meets Bagel: 87% dislike one-night stands, prefer quality matches
13
HER: 50% prioritize mental health disclosures in bios
14
Happn: location-based, 60% message crossed paths multiple times first
15
Feeld: 45% list multiple kinks, polyamory up 20%
16
EliteSingles: 90% seek educated partners, personality tests mandatory
17
33% of users block profiles daily for unwanted advances
18
Tinder: bios under 15 words get 2x matches
19
Bumble: 52% women unmatch if no message in 24h
20
67% prefer same religion, 2023 global survey
21
SilverSingles: 70% value shared hobbies over looks
22
BLK: 80% prefer cultural compatibility
23
Chispa: family-oriented bios 35% more matches
24
Lex: text-only, 55% reference niche interests
25
Thursday: event RSVPs lead to 50% higher meetups
26
Pure: anonymous chats, 90% delete after meetup
Interpretation
User Behaviors And Preferences Interpretation
Across dating app user behaviors and preferences, people are actively shaping how they date, with 71% of Bumble women favoring video chats before meeting and 40% of Grindr users editing profiles weekly to improve matches.
05 · Category
User Demographics30 stats
01
In 2023, 45.2% of Tinder users in the US were aged 18-24, totaling about 12.5 million users
02
Globally, Bumble has 42 million active users as of Q1 2023, with 72% female users in heterosexual matches
03
37% of US adults aged 25-34 have used dating apps, higher than any other age group, per 2022 survey
04
Hinge users are 54% male and 46% female, with average age of 29 years in 2023
05
28% of dating app users in the UK are over 45 years old, up from 19% in 2019
06
Match.com users have a median income of $75,000,with 40% holding college degrees, 2023 data
07
51% of OkCupid users identify as liberal politically, compared to 29% conservative, per 2022 analysis
08
eHarmony users are 52% women, predominantly aged 30-49, with 70% seeking marriage
09
Plenty of Fish has 150 million registered users worldwide, 60% under 35, as of 2023
10
22% of Grindr users are in relationships but using the app, per 2021 Kinsey Institute study
11
HER app users are 95% LGBTQ+ women, average age 26, with 1.5 million downloads in 2023
12
34% of dating app users in India are aged 25-34, fastest growing segment, 2023 Statista
13
EliteSingles users have 85% with above-average education, median age 37
14
41% of US dating app users are parents, per 2022 Pew Research
15
Zoosk has 40 million users, 48% male, with strong presence in 80 countries, 2023
16
19% of Feeld users identify as non-binary, higher than mainstream apps, 2023 data
17
Brazilian dating app users: 55% female on Happn, average age 28
18
62% of Coffee Meets Bagel users are Asian American, median age 30
19
Lex app for queer users: 70% under 30, 60% non-binary or trans, 2023
20
27% of OurTime users (over 50) report higher satisfaction rates
21
SilverSingles: 80% users over 50, 55% female, seeking serious relationships
22
35% of dating app users in Australia are university graduates, per Finder 2023
23
Tantan (China): 300 million users, 60% aged 18-30
24
48% of Badoo users are Gen Z, with high engagement in Europe, 2023
25
Pure app: 70% users seek casual encounters, average age 25
26
29% of US dating app users earn over $100k, skewed male
27
Thursday app: 50% London-based, 65% under 35, weekly active users
28
40% of BLK users (Black singles) are aged 25-34
29
Chispa (Latino): 55% bilingual users, median age 29, 2023
30
33% of dating app users worldwide are from urban areas over 1M pop
Interpretation
User Demographics Interpretation
For the user demographics angle, the data shows dating apps are increasingly broadening beyond young adults as 28% of UK users are over 45 years old up from 19% in 2019, while the 25 to 34 age group remains the most active in the US at 37% using dating apps in 2022.
Reference
Cite This Report
This report is designed to be cited. We maintain stable URLs and versioned verification dates. Copy the format appropriate for your publication below.
APA
Kevin O'Brien. (2026, February 13). Dating App User Statistics. Gitnux. https://gitnux.org/dating-app-user-statistics
MLA
Kevin O'Brien. "Dating App User Statistics." Gitnux, 13 Feb 2026, https://gitnux.org/dating-app-user-statistics.
Chicago
Kevin O'Brien. 2026. "Dating App User Statistics." Gitnux. https://gitnux.org/dating-app-user-statistics.
Sources & references
38 datasets cited across this report · attribution is report-level