GITNUXSOFTWARE ADVICE
Finance Financial ServicesTop 10 Best Stock Market Analysis Software of 2026
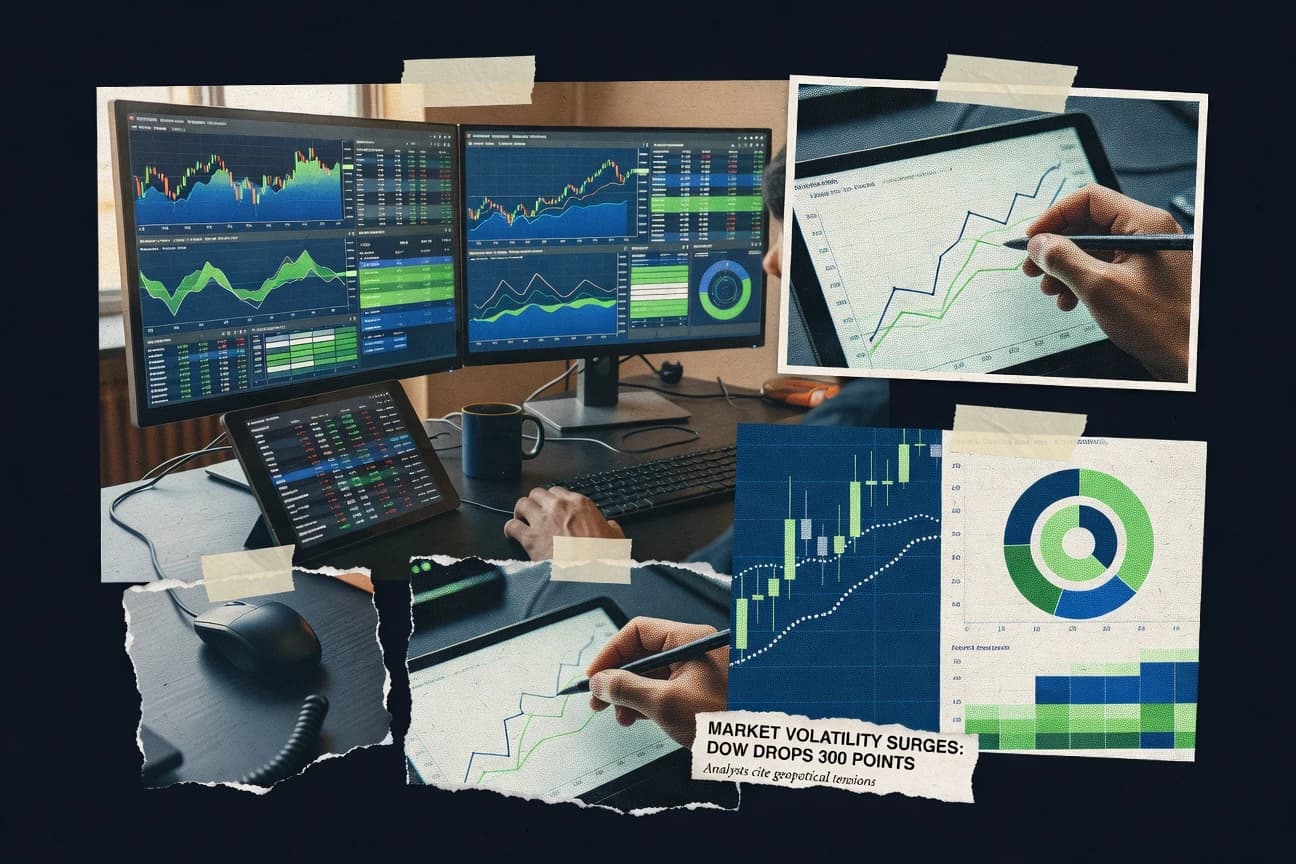
Find the best stock market analysis software tools to enhance trading decisions. Compare features & get top picks now.

How we ranked these tools
Core product claims cross-referenced against official documentation, changelogs, and independent technical reviews.
Analyzed video reviews and hundreds of written evaluations to capture real-world user experiences with each tool.
AI persona simulations modeled how different user types would experience each tool across common use cases and workflows.
Final rankings reviewed and approved by our editorial team with authority to override AI-generated scores based on domain expertise.
Score: Features 40% · Ease 30% · Value 30%
Gitnux may earn a commission through links on this page — this does not influence rankings. Editorial policy
Editor picks
Three quick recommendations before you dive into the full comparison below — each one leads on a different dimension.
TradingView
Pine Script editor with publishable custom indicators and strategy backtests
Built for stock traders needing fast charting, scripting, and community-shared analysis.
TrendSpider
Runner UpAI-assisted trendline and support-resistance detection that updates with chart changes
Built for traders needing automated technical analysis, scans, and alert workflows.
MetaTrader 5
Also GreatStrategy Tester with MQL5 backtesting and optimization for indicator-driven trading logic.
Built for traders building automated technical analysis and backtesting workflows for stocks..
Related reading
- Finance Financial ServicesTop 10 Best Stock Analysis Software of 2026
- Finance Financial ServicesTop 10 Best Stock Trading Analysis Software of 2026
- Finance Financial ServicesTop 10 Best Technical Stock Analysis Software of 2026
- Finance Financial ServicesTop 10 Best Stock Market Trading Software of 2026
Comparison Table
This comparison table evaluates stock market analysis software used for charting, technical indicators, screening, and trade execution across platforms such as TradingView, TrendSpider, MetaTrader 5, Finviz, and MarketWatch. Readers can compare core capabilities like chart tools, automation and alerting, data and watchlist features, and workflow fit for analysis versus execution so the best match is clear by use case.
TradingView
charting and signalsProvides interactive stock charts, technical indicators, watchlists, and strategy-ready scripting via its charting and analytics platform.
Pine Script editor with publishable custom indicators and strategy backtests
TradingView stands out for combining browser-based charting with a shareable social layer that links ideas, scripts, and market commentary. It supports technical analysis with hundreds of built-in indicators, multi-timeframe layouts, and advanced chart tools like drawing, alerts, and event markers.
Users can extend analysis through Pine Script to build custom indicators and strategies, then publish them for others to use. Portfolio-oriented views and watchlists help track stocks across exchanges while keeping chart and research workflows in one interface.
- +Pine Script enables custom indicators and backtesting strategies directly on charts
- +Real-time charting with flexible drawing tools and multi-timeframe layouts
- +Built-in indicator library covers most mainstream stock technical analysis needs
- +Watchlists, screeners, and alerts support repeatable stock monitoring workflows
- –Pine Script has a learning curve for robust multi-asset logic
- –Strategy backtests can diverge from live execution due to trading assumptions
- –Complex dashboards can feel crowded when combining many symbols and panels
Best for: Stock traders needing fast charting, scripting, and community-shared analysis
More related reading
TrendSpider
AI pattern detectionDelivers automated chart pattern recognition, technical indicators, and backtestable alert workflows for equities and other markets.
AI-assisted trendline and support-resistance detection that updates with chart changes
TrendSpider stands out with automated technical analysis built around drawing detection and recurring chart logic. It offers browser-based charting with indicator strategies, custom watchlists, and backtesting-style insights through strategy alerts. The platform focuses on turning technical signals into actionable workflows using scan filters and notifications.
- +Automatically recognizes support and resistance from drawings for faster chart workflows
- +Indicator strategies and automated alerts reduce manual signal checking
- +Powerful scanning and filtering supports recurring market screening tasks
- –Strategy setup can feel complex for users wanting simple indicator views
- –Advanced customization takes time to learn and maintain across watchlists
- –Charting automation still requires careful validation of signal quality
Best for: Traders needing automated technical analysis, scans, and alert workflows
MetaTrader 5
trading platformOffers customizable technical analysis, market data tools, and automated trading support for equity CFDs and related instruments through brokers.
Strategy Tester with MQL5 backtesting and optimization for indicator-driven trading logic.
MetaTrader 5 stands out for its programmer-driven workflow with a built-in trading terminal, charting suite, and algorithmic execution via MQL5. Stock market analysis is supported through extensive indicators, custom indicator support, and interactive order and strategy testing for strategy validation. The platform’s market depth, multi-asset watchlists, and tight chart-to-trade integration make analysis action-oriented rather than purely informational.
- +MQL5 enables custom indicators, scanners, and automated strategies for deep customization
- +Strategy Tester supports historical backtesting and strategy validation workflows
- +Advanced charting with built-in indicators and visual chart tools speeds analysis
- +Multi-asset market watch and order management integrate analysis with execution
- –Indicator and strategy building requires technical setup and MQL5 knowledge
- –Stock-focused tooling feels lighter than dedicated research platforms
- –Real-world execution quality depends heavily on broker data quality and configuration
Best for: Traders building automated technical analysis and backtesting workflows for stocks.
Finviz
stock screenerRuns fast stock screening with fundamental and technical filters and visualizes results on heatmaps and sortable tables.
Heatmap and screener result grids that connect valuation and technical filters to immediate visuals
Finviz stands out with fast visual stock screening using a dense dashboard of charts, heatmaps, and key fundamentals. The platform supports customizable screeners with filters for valuation, performance, technical indicators, and fundamentals, then displays results in interactive watchlist-style layouts.
Finviz also provides sector and industry views plus news and quote pages that help connect catalysts to price action. Limited workflows, fewer advanced portfolio and backtesting tools, and constrained export options reduce suitability for complex research pipelines.
- +High-speed stock screening with many built-in fundamental and technical filters
- +Clear visual results using charts and heatmaps in a watchlist style grid
- +Sector and industry views make rapid market context checks easy
- +Quote pages combine fundamentals, performance, and news in one place
- –Export and data customization options are limited for deeper workflows
- –Backtesting and portfolio management capabilities are minimal
- –Screen saving and multi-step research organization are constrained
- –Advanced scripting and automated alerts are not a core focus
Best for: Retail investors needing quick visual screeners and market context checks
MarketWatch
market news analysisCombines stock quotes with news-driven analysis, technical levels, and portfolio and watchlist tools for equity research.
Market movers and editorial coverage tightly connected to active stocks and sectors
MarketWatch stands out with a newsroom-first stock market experience that blends market data with frequent analyst and business coverage. It offers real-time quotes, interactive charts, market movers, and watchlists for tracking equities and indexes. Portfolio-focused research is lighter than full analytics platforms, but the combination of headlines, earnings coverage, and fundamentals supports event-driven monitoring.
- +Real-time quotes and responsive interactive charts for mainstream tickers
- +High signal market movers and watchlist views for day-to-day monitoring
- +Extensive editorial coverage tied to equities and macro events
- –Limited advanced screening and quantitative analysis compared with pro tools
- –Analytics depth for portfolio attribution and backtesting is minimal
- –Research quality varies by article, with less structured factor data
Best for: Investors needing news-driven stock monitoring with basic charting
Investing.com
cross-market researchProvides stock quotes with charting, economic and company news, and technical indicators for broad market analysis workflows.
Integrated market news plus economic calendar context on each market view
Investing.com stands out for its wide, cross-asset market coverage inside one place, mixing stock, index, ETF, commodity, FX, and rates data with research-style views. It supports stock market analysis with charting, technical indicators, company and sector pages, economic calendar context, and watchlist-driven monitoring. Screeners, news feeds, and historical data access help connect price action to catalysts like earnings and macro releases.
- +Broad instrument coverage links stocks with indices, FX, and commodities.
- +Technical charting includes common indicators and interactive price exploration.
- +News and event context helps tie market moves to catalysts and data releases.
- +Watchlists support ongoing tracking across multiple markets and tickers.
- –Analysis depth for single stocks is less advanced than dedicated research terminals.
- –Screener and comparison workflows can feel crowded with dense page layouts.
- –Advanced backtesting and strategy modeling are not a core focus.
Best for: Investors needing fast market scanning and chart-led research across many assets
Stock Rover
fundamental researchDelivers fundamental stock analysis, portfolio screening, and data-driven research for equity investors.
Integrated screen-to-portfolio research with fundamental filters and valuation-focused dashboards
Stock Rover distinguishes itself with a screen-to-investment-workflow for equity analysis, using watchlists and fundamental filters that feed deeper research. It combines stock screening, valuation views, and portfolio-level reporting so decisions can stay connected to specific thesis inputs.
The platform is geared toward fundamental investors who want to validate assumptions across metrics like growth, profitability, and valuation without switching tools. It also supports exportable results that integrate into ongoing research and tracking.
- +Fundamental stock screening drives directly into multi-metric analysis views
- +Watchlists and portfolios keep research organized across time
- +Export tools support downstream spreadsheet workflows
- –Advanced analytics and visualizations can feel dense for casual users
- –Coverage and data depth may not match specialized institutional research tools
- –Workflow customization takes time to learn and refine
Best for: Fundamental stock researchers building repeatable screen-to-portfolio workflows
Motley Fool Stock Advisor
editorial stock researchPublishes stock picks and research articles with model portfolio and performance tracking for equity analysis.
Stock Advisor recommendation performance tracking tied to original buy theses and ongoing updates
Motley Fool Stock Advisor stands out with analyst-driven stock recommendations that focus on long-term ideas rather than chart-only signals. The service pairs curated picks with ongoing commentary and performance tracking so users can monitor thesis updates over time.
Core capabilities center on idea generation, watchlist-style follow-through, and educational guidance that connects recommendations to fundamental reasoning. It is best characterized as a decision-support subscription for stock selection, not a full trading platform with advanced market data tooling.
- +Analyst-written pick theses emphasize fundamentals and long-term company quality
- +Built-in performance tracking helps evaluate recommendations against outcomes
- +Frequent updates support monitoring of thesis changes and new buy ideas
- +Educational articles improve user understanding of valuation and risk factors
- –Limited tools for custom screening, technical analysis, and macro scenario modeling
- –Recommendation-first workflow reduces flexibility for users who build portfolios from data
- –Deep diligence tools like earnings modeling and peer comparisons are not the focus
Best for: Investors who prefer curated long-term stock picks and thesis follow-through
Koyfin
terminal-style analyticsSupports multi-asset charting, fundamental and macro dashboards, and custom views for equity and market analysis.
Koyfin Dashboards for linking macro indicators with equity and market performance visuals
Koyfin stands out with a multi-asset research workspace that combines charts, dashboards, and macro-to-equity analysis in one place. It supports interactive technical and fundamental workflows, including custom charting, watchlists, and peer comparisons with economic and market indicators.
The platform is geared toward scenario-driven analysis using time series, factor-style views, and portfolio-style data exploration rather than pure backtesting. Overall, it emphasizes fast visual synthesis of market themes across assets and regions.
- +Interactive dashboards for equities, ETFs, macro, and rates in one workspace
- +Custom charting with flexible comparisons across tickers and time ranges
- +Watchlists and screening workflows that support quick market monitoring
- –Analytics depth can feel limited versus dedicated research or quant platforms
- –Building complex views requires more setup than simpler charting tools
- –Some advanced analysis workflows depend on data availability coverage
Best for: Analysts needing fast visual market and macro research across multiple asset classes
Bloomberg Terminal
enterprise market dataDelivers professional terminal data and analytical screens for equities research, portfolio analytics, and market intelligence.
Bloomberg data terminal functions for real-time market analytics plus company and estimate consensus views
Bloomberg Terminal stands out for its deep, institutional-grade market data with integrated analytics, news, and execution workflows in one interface. Stock analysis benefits from high-fidelity pricing, company fundamentals, analyst estimates, and portfolio risk views that update quickly across asset classes.
Research workflows also connect with industry-specific screens, customizable watchlists, and built-in charting that supports technical and fundamental cross-checks. The system emphasizes speed and breadth for professional users rather than self-serve simplicity for occasional analysis.
- +High-quality market data with tight alignment to news and corporate events
- +Integrated analytics for equities fundamentals, estimates, and valuation comparisons
- +Powerful multi-asset charting and screening across customizable watchlists
- –Complex command structure slows adoption for infrequent analysts
- –Workflow depth can overwhelm research focused on a narrow set of tasks
- –High sophistication increases dependency on specialized training and support
Best for: Institutional analysts needing integrated data, analytics, and fast market surveillance
Conclusion
After evaluating 10 finance financial services, TradingView stands out as our overall top pick — it scored highest across our combined criteria of features, ease of use, and value, which is why it sits at #1 in the rankings above.
Use the comparison table and detailed reviews above to validate the fit against your own requirements before committing to a tool.
How to Choose the Right Stock Market Analysis Software
This buyer's guide explains how to choose stock market analysis software for charting, scanning, fundamentals, macro research, and institutional workflows using TradingView, TrendSpider, MetaTrader 5, Finviz, Stock Rover, Koyfin, and Bloomberg Terminal. It also covers newsroom-driven monitoring with MarketWatch and broad cross-asset exploration with Investing.com. The guide translates tool strengths and real limitations into selection criteria across the full top set.
What Is Stock Market Analysis Software?
Stock market analysis software helps investors and traders process market data into actionable views like technical charts, fundamental dashboards, watchlists, and alert workflows. It solves problems such as tracking symbols across timeframes, turning signals into repeatable scans, and connecting price movement to news or macro context. Tools like TradingView provide interactive charts, built-in indicators, and Pine Script strategy backtests. Tools like Finviz focus on fast screening with heatmaps and filterable results grids.
Key Features to Look For
The right feature set determines whether stock analysis stays manual and fragmented or becomes a repeatable workflow inside a single platform.
Charting depth with multi-timeframe layouts
TradingView delivers real-time charting with multi-timeframe layouts plus flexible drawing tools and event markers. MetaTrader 5 adds advanced chart tools alongside an integrated trading terminal so chart analysis can stay tightly connected to order and strategy testing workflows.
Programmable indicators and strategy testing
TradingView includes a Pine Script editor that enables custom indicators and publishable strategy backtests directly on charts. MetaTrader 5 pairs MQL5 customization with a Strategy Tester that supports historical backtesting and optimization for indicator-driven trading logic.
Automated pattern recognition with alert workflows
TrendSpider uses AI-assisted trendline and support-resistance detection that updates as charts change. It also offers indicator strategies and automated alerts to reduce manual signal checking during recurring scanning tasks.
Fast stock screening with heatmaps and sortable result grids
Finviz emphasizes quick screening with a dense dashboard of heatmaps and sortable tables that connect valuation and technical filters to immediate visuals. This format supports rapid context building through sector and industry views plus quote pages that combine fundamentals, performance, and news.
News and market mover integration for event-driven monitoring
MarketWatch ties real-time quotes and interactive charts to market movers and frequent editorial coverage tied to active stocks and sectors. Investing.com complements chart-led research with integrated company and sector pages plus economic calendar context on market views so catalysts can be checked alongside price action.
Screen-to-portfolio workflows and research organization
Stock Rover builds a screen-to-investment workflow by pushing fundamental filters into multi-metric analysis views and watchlist-style portfolio organization. Koyfin extends this idea into a scenario-driven workspace with interactive dashboards and custom charting that links macro indicators to equity and market performance visuals.
How to Choose the Right Stock Market Analysis Software
Selecting the right tool starts with matching workflow needs like scripting, automation, and research depth to how analysis will actually happen day to day.
Choose the analysis workflow style: charts first, signals first, or thesis first
If the primary need is fast charting plus customization, TradingView supports hundreds of built-in indicators and multi-timeframe layouts, and it enables Pine Script custom indicators and publishable strategy backtests. If the priority is automated signal generation, TrendSpider turns chart logic into scan filters and automated notifications using AI-assisted support-resistance and trendline detection.
Match automation and backtesting to the strategy depth needed
If strategy development and repeatable testing are required inside chart workflows, TradingView’s Pine Script supports custom indicators and strategy backtests. If automated trading logic and deeper programmer-driven testing are required, MetaTrader 5 offers MQL5 customization plus a Strategy Tester for historical backtesting and optimization.
Validate scanning speed and visualization quality for watchlists
If quick screening drives portfolio ideas, Finviz delivers heatmap and screener result grids that connect valuation and technical filters to immediate visuals. For traders who need ongoing monitoring with a newsroom flow, MarketWatch provides market movers and watchlist-style tracking tied to daily coverage.
Ensure fundamentals and organization match the research process
For fundamental investors who want to keep analysis connected to specific thesis inputs, Stock Rover integrates valuation-focused dashboards with watchlists and export tools for downstream spreadsheet workflows. For analysts who must connect macro themes across assets to equity behavior, Koyfin provides Koyfin Dashboards that link macro indicators with equity and market performance visuals.
Decide whether institutional data and analytics complexity is required
For professional users needing integrated market intelligence, Bloomberg Terminal provides Bloomberg data terminal functions for real-time market analytics plus company and estimate consensus views. If cross-asset research across stocks, indices, ETFs, commodities, FX, and rates is needed with built-in news and economic calendar context, Investing.com supports broad market coverage inside one workspace.
Who Needs Stock Market Analysis Software?
Stock market analysis software fits distinct user types based on whether they optimize for chart execution, automated signals, fundamental research, or institutional-grade market surveillance.
Stock traders who need fast charting and shareable technical workflows
TradingView is built for stock traders who need interactive charts, flexible drawing tools, watchlists, alerts, and Pine Script publishable custom indicators and strategy backtests. The platform also supports community publishing so proven ideas can be discovered and reused inside a chart-first workflow.
Traders who want automated technical analysis with scanning and alerts
TrendSpider is designed for traders who rely on recurring scanning and want automated workflows instead of manual signal checks. Its AI-assisted trendline and support-resistance detection updates with chart changes and feeds into indicator strategies and automated alerts.
Traders who build custom indicator logic and want algorithmic backtesting
MetaTrader 5 suits traders who prefer programmer-driven workflows with MQL5 customization. Its Strategy Tester supports historical backtesting and optimization for indicator-driven trading logic while the built-in terminal keeps chart and execution connected.
Fundamental investors who need screen-to-portfolio organization
Stock Rover matches fundamental stock researchers who want repeatable screen-to-portfolio workflows with fundamental filters feeding valuation-focused dashboards. Its watchlists and portfolio-level reporting keep thesis inputs connected to results across time.
Common Mistakes to Avoid
Common missteps come from choosing a tool that does not match the required signal workflow, data context, or research organization style.
Buying charting-only software for strategy development without programmability
TradingView supports strategy-ready scripting through Pine Script so custom indicators and strategy backtests can be created directly on charts. MetaTrader 5 supports strategy validation through MQL5 and its Strategy Tester so indicator-driven trading logic can be tested historically.
Expecting automated signals without validating chart automation quality
TrendSpider’s AI-assisted support-resistance and trendline detection updates with chart changes, which can accelerate workflows but still requires validation of signal quality. Manual validation steps pair well with TradingView’s drawing tools and backtesting so signal assumptions are stress-tested.
Relying on slow or cluttered screening workflows for rapid watchlist building
Finviz is optimized for fast screening using heatmaps and sortable screener result grids. MarketWatch emphasizes market movers and editorial coverage, so it supports event monitoring but it offers limited advanced screening compared with dedicated screener workflows like Finviz.
Separating news, macro, and fundamentals into disconnected tools
Investing.com integrates news and economic calendar context with chart-led research so catalysts can be checked alongside price action. Koyfin links macro indicators to equity and market performance visuals in Koyfin Dashboards so macro-to-equity scenarios stay in one workspace.
How We Selected and Ranked These Tools
We evaluated every tool on three sub-dimensions. Features received a weight of 0.4. Ease of use received a weight of 0.3. Value received a weight of 0.3. The overall rating is computed as overall = 0.40 × features + 0.30 × ease of use + 0.30 × value. TradingView separated itself by scoring strongly on features through its Pine Script editor for custom indicators and publishable strategy backtests directly on charts.
Frequently Asked Questions About Stock Market Analysis Software
Which tool best supports technical charting with custom strategies for stocks?
What software automates trendline and support-resistance detection instead of manual drawing?
Which platform is best for algorithmic backtesting tied to technical indicators for stock trading logic?
Which option is best for fast visual screening across valuation, performance, and technical signals?
Which tool is best for staying focused on market news and earnings-driven catalysts while tracking stocks?
Which software is strongest for linking macro indicators to equity performance across asset classes?
Which tool best supports a screen-to-portfolio workflow for fundamental investors analyzing stocks repeatedly?
Which platform is most suitable for long-term stock thesis monitoring based on analyst-style recommendations?
Which tool best handles professional-grade data depth for stocks, estimates, and portfolio risk surveillance?
How do common workflow problems differ when moving from charting tools to research or execution tools?
Tools reviewed
Primary sources checked during evaluation.
Referenced in the comparison table and product reviews above.
Keep exploring
Comparing two specific tools?
Software Alternatives
See head-to-head software comparisons with feature breakdowns, pricing, and our recommendation for each use case.
Explore software alternatives→In this category
Finance Financial Services alternatives
See side-by-side comparisons of finance financial services tools and pick the right one for your stack.
Compare finance financial services tools→FOR SOFTWARE VENDORS
Not on this list? Let’s fix that.
Our best-of pages are how many teams discover and compare tools in this space. If you think your product belongs in this lineup, we’d like to hear from you—we’ll walk you through fit and what an editorial entry looks like.
Apply for a ListingWHAT THIS INCLUDES
Where buyers compare
Readers come to these pages to shortlist software—your product shows up in that moment, not in a random sidebar.
Editorial write-up
We describe your product in our own words and check the facts before anything goes live.
On-page brand presence
You appear in the roundup the same way as other tools we cover: name, positioning, and a clear next step for readers who want to learn more.
Kept up to date
We refresh lists on a regular rhythm so the category page stays useful as products and pricing change.