
GITNUXSOFTWARE ADVICE
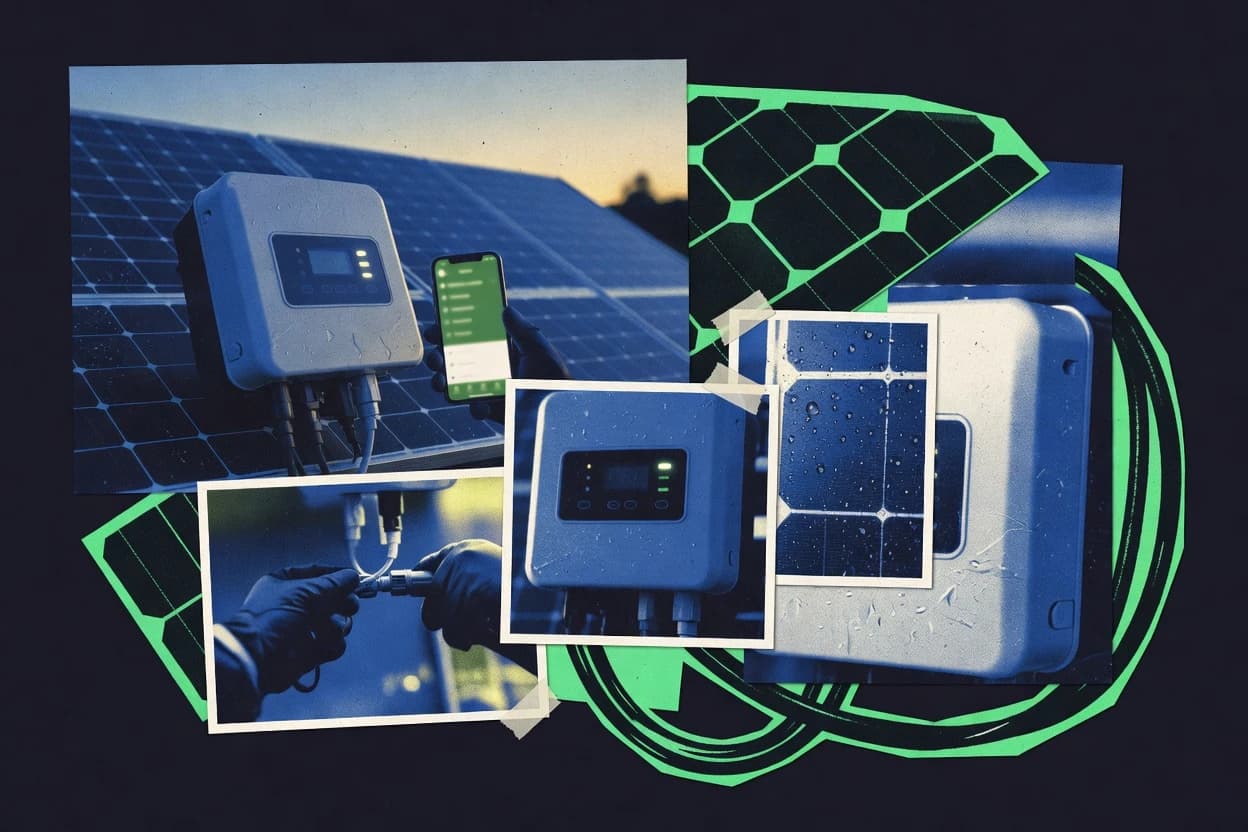
Environment EnergyTop 10 Best Solar Power Monitor Software of 2026
Ranked solar power monitor software tools for system owners, weighing features and tradeoffs like SMA Sunny Portal, SolarEdge, Enphase, OpenEnergyMonitor.

How we ranked these tools
Core product claims cross-referenced against official documentation, changelogs, and independent technical reviews.
Analyzed video reviews and hundreds of written evaluations to capture real-world user experiences with each tool.
AI persona simulations modeled how different user types would experience each tool across common use cases and workflows.
Final rankings reviewed and approved by our editorial team with authority to override AI-generated scores based on domain expertise.
Score: Features 40% · Ease 30% · Value 30%
Gitnux may earn a commission through links on this page — this does not influence rankings. Editorial policy
SMA Sunny Portal is the right pick if you run an SMA-heavy inverter fleet and need reliable cloud monitoring with event context and steady reporting, while Fronius Solar.web suits Fronius-focused sites that want inverter-centric dashboards and routine exports.
Editor’s top 3 picks
Three quick recommendations before you dive into the full comparison below — each one leads on a different dimension.
SMA Sunny Portal
Inverter and system event timelines that connect performance shifts to status changes for faster triage.
Built for fits when managing SMA-heavy fleets and prioritizing reliable monitoring, event context, and routine reporting..
Fronius Solar.web
Editor pickBuilt-in inverter event timelines that tie alarms to performance changes for faster root-cause review.
Built for fits when Fronius-heavy portfolios need reliable inverter-centric monitoring and routine exports..
OpenEnergyMonitor
Editor pickGateway-led architecture that captures local inverter and meter telemetry for configurable dashboards and historical exports.
Built for fits when sites need consistent local telemetry, exports, and custom integrations beyond vendor dashboards..
Comparison Table
SMA Sunny Portal
enterpriseCloud monitoring portal for SMA inverter fleets.
Inverter and system event timelines that connect performance shifts to status changes for faster triage.
SMA Sunny Portal is built around SMA asset connectivity, so monitoring fidelity is strongest when devices and meters are SMA-supported and consistently commissioned. The core experience covers plant-level dashboards, inverter status history, and time-based production views for performance checks and incident triage. Reporting output is oriented toward operational review rather than deep custom SCADA-style visualization.
A tradeoff is that extensibility for non-SMA telemetry and custom data models is limited compared with gateway-first setups that ingest third-party protocols. It fits when system owners need dependable monitoring and event context for SMA fleets and when routine checks and exception handling matter more than bespoke analytics.
For multi-site operators, Sunny Portal’s grouping and history support day-to-day fleet oversight without requiring custom ingestion engineering for each location. Event timelines make it easier to correlate outages with production drops during routine investigations.
- +Strong SMA device integration with consistent inverter telemetry and event history
- +Site and asset organization supports routine review across multiple locations
- +Production and status timelines help correlate events to performance gaps
- +Reporting focuses on operational monitoring outputs for O&M workflows
- –Custom telemetry ingestion for non-SMA sources is limited versus gateway-first monitoring stacks
- –Deep SCADA-style customization and bespoke dashboards require workarounds
Site O&M coordinators
Outage investigation with event correlation
Faster root-cause narrowing
Solar asset managers
Monthly performance and trend review
Repeatable monthly reviews
Show 2 more scenarios
Fleet monitoring leads
Multi-site oversight
Lower administrative overhead
Grouping and asset history enable centralized oversight of SMA systems with consistent visibility.
Commissioning and service teams
Post-install validation workflow
Reduced commissioning rework
Telemetry continuity and event records help validate that monitoring reflects real system behavior.
Best for: Fits when managing SMA-heavy fleets and prioritizing reliable monitoring, event context, and routine reporting.
Fronius Solar.web
SMBWeb-based monitoring for Fronius inverter installations.
Built-in inverter event timelines that tie alarms to performance changes for faster root-cause review.
Solar.web centralizes inverter status, yields, and alarm conditions using Fronius telemetry rather than generic meter readings. Asset organization lets teams view plants and inverters as a hierarchy and drill into performance timelines when events spike. For governance, the tool routes administrative permissions through portal access controls so site-level stakeholders can view without broad changes. Data export supports operational workflows that need periodic snapshots of performance and downtime history.
A tradeoff exists for mixed-vendor fleets because Solar.web is optimized around Fronius inverter data models and event semantics. Solar.web fits best when most monitored assets are Fronius and operations teams want fast incident triage plus routine reporting without building a custom SCADA pipeline. For integration-heavy environments, Solar.web typically complements external monitoring by feeding inverter-centric historical data into downstream processes.
- +Inverter-native monitoring reduces mapping work for Fronius plants
- +Plant and inverter hierarchy supports quick incident triage
- +Event timelines make outage and performance shifts easier to correlate
- +Exports support periodic reviews and offline trend tracking
- –Mixed-vendor fleets require extra normalization effort
- –Automation depends on integration paths that fit Fronius telemetry flows
- –High-cardinality dashboards can become slow at large fleet scales
- –Advanced configuration needs careful rollout discipline across sites
Site operations teams
Triage alarms across multiple inverters
Faster incident resolution
Asset managers
Review plant performance each week
Consistent reporting cadence
Show 2 more scenarios
O&M coordinators
Hand off events to maintenance
Better maintenance targeting
Track inverter alarms and affected performance periods to inform field work scheduling.
Engineering integrators
Feed external analytics pipelines
Reduced custom collection work
Use Solar.web data outputs as an input source for downstream monitoring dashboards.
Best for: Fits when Fronius-heavy portfolios need reliable inverter-centric monitoring and routine exports.
OpenEnergyMonitor
API-firstOpen-source energy monitoring toolkit for solar and home energy flows.
Gateway-led architecture that captures local inverter and meter telemetry for configurable dashboards and historical exports.
OpenEnergyMonitor is differentiated by its split between data acquisition and visualization, with the acquisition side using hardware that can poll or ingest local telemetry and then feed a central monitoring setup. It targets solar monitoring where system owners want more control than proprietary inverter portals, especially when multiple meter points, irradiance sources, or custom measurement layouts are involved. The monitoring outputs are driven by a configurable configuration layer that maps devices to metrics and then applies derived calculations for energy performance reporting.
A key tradeoff is that deeper integrations often require manual device configuration and adapter selection for each inverter or meter type, which can be slower than connecting a single vendor account. It fits best when a site has mixed telemetry sources or when system owners want to standardize data collection across properties for consistent historical monitoring and export.
- +On-prem style gateway supports local telemetry capture and control
- +Adapter-based integrations for meters and inverters reduce vendor lock-in
- +Time-series history enables trend analysis across multiple sites
- +Configurable reporting supports exports for external workflows
- –Device and adapter setup can be time-consuming for complex installs
- –Some inverter-specific telemetry fields depend on compatible protocol support
- –Automation requires familiarity with the platform’s data flows
Solar O&M teams
Monitor fleet sites for downtime signals
Reduced time to detect issues
Energy engineering analysts
Build custom yield and performance reporting
More consistent reporting inputs
Show 2 more scenarios
System integrators
Standardize heterogeneous inverter monitoring
Fewer one-off dashboards
Use adapter-driven device mappings to unify different meters and inverter telemetry sources into one view.
Prosumers with off-grid needs
Track energy flows and usage
Clearer daily energy accounting
Ingest local measurements and monitor energy behavior for improved operational decisions.
Best for: Fits when sites need consistent local telemetry, exports, and custom integrations beyond vendor dashboards.
Power Factors Drive
enterpriseDrive monitors renewable energy assets with performance analytics, alarms, work orders, and fleet reporting.
Operational alerting built around power performance event interpretation from inverter telemetry.
Power Factors Drive focuses on monitoring solar assets with inverter and meter data ingestion workflows designed for owner-grade operational visibility. Core capabilities include fleet-style dashboards, time-series history for performance review, and alerting workflows tied to asset status changes.
The monitoring configuration supports exportable reporting for audits and maintenance review, and it can integrate into existing operations via data handoff patterns used by system administrators. The product’s distinct angle is how it organizes monitoring around power performance signals and operational events rather than only static device health.
- +Asset alerting tied to power performance signals rather than raw telemetry only
- +Time-series retention supports trend review for operational and performance checks
- +Reporting exports support maintenance review workflows without manual rework
- +Configuration is designed around monitoring use cases instead of generic device lists
- –Provisioning new sites requires deliberate configuration of data connections
- –Automation and API surface needs validation for high-frequency polling integrations
- –Role separation and audit controls are not documented with fine-grained governance detail
- –Advanced DER control workflows depend on upstream integrations and mappings
Best for: Fits when portfolio operators need power-focused monitoring plus operational event alerting.
meteocontrol VCOM
vertical specialistVCOM provides cloud monitoring, plant control, reporting, and fault management for photovoltaic systems.
VCOM’s monitoring workspace links telemetry history to actionable alarm states for fleet operations.
meteocontrol VCOM aggregates inverter and sensor telemetry into a centralized monitoring workspace for PV assets managed in meteocontrol environments. It focuses on fleet-level visibility with configuration options for performance views, time-series history, and alerting workflows tied to monitored measurements.
Integration is driven through data ingestion from site hardware and telemetry sources, plus export paths for operational reporting and analysis. Administration is oriented around managing asset onboarding, role-based operational access, and ongoing oversight of alarms and system status.
- +Fleet monitoring with consolidated views across many PV sites
- +Alerting tied to measurable telemetry trends and system status
- +Time-series history supports investigations of performance deviations
- +Operational reporting exports help feed O&M workflows
- –Integration depth depends on the telemetry and gateway path used on-site
- –Asset onboarding requires structured configuration for each telemetry source
- –Advanced analytics require careful selection of the right measurement set
- –User experience for deep drilldowns can feel heavier for ad hoc checks
Best for: Fits when asset managers need centralized monitoring across multiple sites with operational alert workflows.
Raptor Maps
vertical specialistRaptor Maps combines solar asset monitoring, inspection data, anomaly tracking, and maintenance management.
Map-based asset tracking that ties site status, alerts, and production history into a single navigation model.
Raptor Maps targets solar system owners who need fleet-style monitoring without being limited to a single inverter portal. It centers on map-based asset tracking and operational views that connect site status to production trends.
The monitoring workflow supports alerting and exporting time-series data for downstream analysis. Raptor Maps also supports configuration for multiple sites so operators can keep a consistent view across installations.
- +Map-first asset navigation links site health to production history quickly
- +Alerting workflow supports ongoing operations without manual log checking
- +Exports support CSV-based analysis pipelines and reporting handoffs
- +Multi-site configuration keeps dashboards consistent across installations
- –External integrations and automation are less transparent than in API-first competitors
- –Dependency on supported telemetry sources can limit coverage for mixed fleets
- –Granular control like threshold tuning may require more admin attention
- –Operational depth for revenue-grade accounting workflows is not clearly positioned
Best for: Fits when operators manage multiple PV sites and want map-based monitoring plus exports for operations and reporting.
GreenPowerMonitor GPM Horizon
enterpriseGPM Horizon monitors renewable plants with SCADA functions, performance analytics, alarms, and control workflows.
Configurable alarm thresholds tied to site telemetry histories for faster fault triage during recurring issues.
GreenPowerMonitor GPM Horizon focuses on turning inverter and meter telemetry into an operational monitoring workflow for solar sites. It supports multi-site dashboards, historical performance views, and alarming around energy and equipment behavior.
The system’s integration depth is driven by its device communication options and data export for downstream reporting. Admin users get controls for managing monitored assets and tuning alert thresholds across fleet deployments.
- +Multi-site dashboards with consistent views across monitored installations
- +Alerting tied to configurable thresholds for energy and equipment signals
- +Historical time-series views support performance review after incidents
- +Exports for moving monitoring data into external reporting workflows
- –Device onboarding can require more integration work than cloud-only portals
- –API depth and automation coverage are narrower than systems built for SCADA
- –Complex fleets may need careful alert tuning to avoid noisy alarms
- –Some advanced reporting formats require extra configuration in workflows
Best for: Fits when system owners need fleet monitoring with configurable alarms and exports into existing reporting pipelines.
Wattwatchers
API-firstWattwatchers collects high-resolution energy data for solar, batteries, meters, and distributed energy assets.
Operational alerting tied to performance benchmarking that supports recurring O&M review cycles.
Wattwatchers is solar power monitor software for system owners who need inverter-focused visibility plus performance reporting across a portfolio. Its core workflow centers on collecting device telemetry, presenting time-series dashboards, and turning monitoring signals into actionable alerts and performance comparisons.
The software also supports data export for offline analysis and integrates with common monitoring setups without forcing a full SCADA build-out. Compared with simpler portals, Wattwatchers puts more emphasis on operational monitoring and ongoing reporting rather than single-site summaries.
- +Alerting and performance comparisons support quicker outage and underperformance triage
- +Time-series dashboards make trends easier to spot than spreadsheet-only workflows
- +CSV exports support independent analysis in reporting tools
- +Portfolio views help compare multiple installs in one operational workflow
- –Deeper automation depends on setup choices and data source compatibility
- –API extensibility is less direct than systems built for high-throughput integrations
- –Advanced grid-event workflows need additional operational configuration
- –SCADA-style ingestion patterns are limited compared with dedicated integration gateways
Best for: Fits when installers or O&M teams need practical fleet monitoring with exports and alert-driven operations.
3E SynaptiQ
enterpriseSynaptiQ supports renewable asset monitoring, forecasting, inspections, and performance management.
Event and alarm capture tied to operational monitoring workflows, enabling guided fault triage across a fleet.
3E SynaptiQ collects inverter and meter telemetry into a centralized monitoring view for solar power systems under 3E’s ecosystem. It focuses on fleet-style dashboards, event capture, and performance analytics that support operations workflows like fault triage and reporting.
Integration is driven through configuration of monitored assets and data acquisition paths, with an automation surface aimed at keeping telemetry and alarms consistent across sites. Administrators manage monitored site structure and user access so operations teams can monitor and respond without rebuilding dashboards per project.
- +Central dashboards consolidate multi-site inverter telemetry and alarms
- +Operational event history supports faster fault investigation
- +Administration supports separating site viewers from operations users
- +Reporting workflows reduce manual extraction from raw telemetry
- –Deep custom analytics require more platform-specific configuration
- –Asset onboarding is slower than tools built for DIY SCADA-style ingestion
- –Integration patterns can depend on 3E-specific data acquisition components
- –API extensibility is narrower than general-purpose DER aggregation stacks
Best for: Fits when system owners want operational monitoring for multiple sites with strong alarm history and repeatable reporting.
SolarAssistant
SMBSolarAssistant monitors compatible inverters and batteries with live dashboards, history, alerts, and remote access.
Project dashboards that connect installation telemetry to structured reporting exports for routine performance reviews.
SolarAssistant is a solar power monitoring solution built around device telemetry ingestion and project dashboards for system owners who need ongoing performance visibility beyond vendor portals. The product focuses on inverter and meter data collection, historical time-series views, and exportable reporting workflows for operational reviews.
Administration is centered on managing installations under accounts, while alerting and integrations support recurring operations like issue triage and trend checks. SolarAssistant is best evaluated on how well its collection and automation surface fits mixed inverter or metering setups rather than on raw dashboard aesthetics.
- +Centralized dashboards for installations with consistent historical views
- +Time-series reporting supports ongoing performance reviews
- +Export workflows support internal analysis and manual reconciliation
- +Integration options help connect monitoring data to operational routines
- –Automation depends on external workflows rather than an internal rules engine
- –Telemetry setup can require careful mapping for each device type
- –Alarm tuning support is limited for complex multi-sensor fault logic
- –Depth varies across inverter ecosystems, which can reduce data completeness
Best for: Fits when system owners need installation-level monitoring and exportable history for operations.
Conclusion
After evaluating 10 environment energy, SMA Sunny Portal stands out as our overall top pick — it scored highest across our combined criteria of features, ease of use, and value, which is why it sits at #1 in the rankings above.
Use the comparison table and detailed reviews above to validate the fit against your own requirements before committing to a tool.
How to Choose the Right solar power monitor software
Solar power monitor software turns inverter telemetry, meter readings, and site events into readable dashboards, exports, and operational alert histories for PV system owners. This guide covers SMA Sunny Portal, Fronius Solar.web, and OpenEnergyMonitor alongside Power Factors Drive, meteocontrol VCOM, Raptor Maps, GreenPowerMonitor GPM Horizon, Wattwatchers, 3E SynaptiQ, and SolarAssistant.
The tools differ most in how they connect performance changes to status changes, how much configuration the gateway or device onboarding demands, and how consistently they support fleet-level operations across multiple installations.
Solar power monitor software for inverter telemetry, events, and exportable performance monitoring
Solar power monitor software collects inverter and system telemetry, correlates it with alarms or operational events, and presents historical views that support triage, reporting, and recurring performance checks. SMA Sunny Portal is built around inverter and system event timelines that connect performance shifts to status changes for faster fault triage.
Fronius Solar.web uses inverter-native monitoring and plant plus inverter hierarchy to keep incident review focused on Fronius telemetry flows. OpenEnergyMonitor takes a gateway-led approach that captures local inverter and meter telemetry so configurable dashboards and historical exports can extend beyond vendor portals.
Solar monitoring software capabilities that change triage speed and reporting repeatability
Event correlation decides whether underperformance becomes a fast incident or a slow forensic exercise. Tools like SMA Sunny Portal and Fronius Solar.web connect inverter and system alarms to performance shifts inside a timeline so faults and response actions can be traced without cross-referencing multiple screens.
Automation and exportability decide whether operations teams can run recurring checks every week. OpenEnergyMonitor and Power Factors Drive focus on gateway-led ingestion and operational event interpretation so teams can standardize dashboards and exports across sites instead of rebuilding reports from device views.
Event timelines that link alarms to performance changes
SMA Sunny Portal ties inverter and system event timelines to performance shifts for faster triage, with consistent inverter telemetry and event history for routine review across locations. Fronius Solar.web uses inverter-native event timelines that tie alarms to performance changes, keeping incident review centered on Fronius telemetry flows.
Gateway-led local telemetry for custom dashboards and exports
OpenEnergyMonitor captures local inverter and meter telemetry through a gateway-led architecture for configurable dashboards and historical exports beyond vendor portals. GreenPowerMonitor GPM Horizon also supports multi-site dashboards and exports, but its strongest differentiation is configurable alarm thresholds tied to telemetry histories for recurring fault triage.
Operational alerting built around power performance interpretation
Power Factors Drive builds operational alerting around power performance event interpretation from inverter telemetry, which supports trend review through time-series retention. GreenPowerMonitor GPM Horizon focuses alerting on configurable thresholds for energy and equipment signals, which helps system owners tune recurring issues without relying on raw telemetry-only views.
Fleet navigation models for multi-site operations
Raptor Maps uses map-first asset navigation to connect site health to production history and keep alert workflows tied to ongoing operations. meteocontrol VCOM provides a monitoring workspace that links telemetry history to actionable alarm states for fleet operations.
Guided fault triage with centralized multi-site alarm history
3E SynaptiQ captures events and alarms tied to operational monitoring workflows, enabling guided fault triage across a fleet. Wattwatchers supports recurring O&M review cycles by combining operational alerting with performance benchmarking and trend-driven dashboards.
Choose by telemetry path and the workflow that must run every month
Solar monitoring software choices split along telemetry path control. Vendor-native portals like SMA Sunny Portal and Fronius Solar.web reduce mapping work by aligning hierarchy and event history to their inverter ecosystems, while gateway-led systems like OpenEnergyMonitor support local telemetry capture for custom integrations and exports beyond those portals.
Operational cadence also drives selection. If operations must convert alarms into consistent incident narratives quickly, event-timeline correlation is the deciding mechanism. If recurring performance checks must flow into external reporting and O&M cycles, time-series retention, exports, and integration automation need to match the team’s throughput and configuration tolerance.
Select the telemetry control model that matches the installed base
Pick SMA Sunny Portal when SMA-heavy fleets need consistent inverter telemetry plus site and asset organization that supports routine review across multiple locations. Pick OpenEnergyMonitor when sites need local telemetry capture via a gateway so dashboards and historical exports can extend beyond vendor portals.
Match incident workflow to the tool’s event correlation depth
If the workflow requires connecting performance shifts to status changes for faster triage, SMA Sunny Portal provides inverter and system event timelines designed for that connection. If the fleet is Fronius-heavy and incident review must stay focused on Fronius telemetry flows, Fronius Solar.web provides inverter-native monitoring with plant and inverter hierarchy.
Decide whether alerting should be power-event interpreted or threshold tuned
Choose Power Factors Drive when alarms must be tied to power performance event interpretation from inverter telemetry and reviewed through time-series retention for operational and performance checks. Choose GreenPowerMonitor GPM Horizon when configurable alarm thresholds tied to telemetry histories drive recurring fault triage for energy and equipment signals.
Choose a fleet UX model that fits how assets get navigated
Choose Raptor Maps when multi-site navigation should be map-first so operators can link site status, alerts, and production history without manual log checking. Choose meteocontrol VCOM when fleet operations need a monitoring workspace that ties telemetry history to actionable alarm states.
Evaluate onboarding friction against the expected number of telemetry sources
If onboarding complexity must stay low for each installation, SMA Sunny Portal and Fronius Solar.web reduce mapping work by aligning monitoring to inverter-centric hierarchies. If complex installs need adapter-based integrations, OpenEnergyMonitor trades setup time for adapter-based meter and inverter integration paths that reduce vendor lock-in.
Validate how automation will be executed for your reporting loop
Choose Power Factors Drive when automation needs to be validated for high-frequency polling integrations since its automation and API surface requires deliberate validation for polling workloads. Choose SolarAssistant when project dashboards must connect installation telemetry to structured reporting exports, but plan for automation dependence on external workflows rather than an internal rules engine.
Who benefits from solar power monitor software by workflow and fleet type
System owners benefit most when the monitoring workflow matches how incidents get investigated and how performance review gets repeated. Teams managing inverter-rich ecosystems often get faster setup and clearer incident narratives in vendor-aligned portals like SMA Sunny Portal and Fronius Solar.web.
Operations and O&M teams also benefit from software that turns alarms into repeatable procedures. Tools with gateway-led telemetry and export-oriented dashboards like OpenEnergyMonitor fit teams that need custom integrations, while alerting-focused platforms like Power Factors Drive and GreenPowerMonitor GPM Horizon fit teams that run recurring operational checks across many sites.
SMA-heavy asset managers and multi-site operators
SMA Sunny Portal provides inverter and system event timelines that connect performance shifts to status changes, and its site and asset organization supports routine review across multiple locations.
Fronius portfolios that prioritize inverter hierarchy for incident review
Fronius Solar.web reduces normalization work by using inverter-native monitoring plus plant and inverter hierarchy so alarms stay tied to Fronius telemetry flows.
Installations with mixed vendors needing custom exports and dashboarding
OpenEnergyMonitor uses a gateway-led architecture and adapter-based integrations for meters and inverters, which supports custom integrations beyond vendor dashboards.
O&M teams running power-performance driven outage and underperformance triage
Power Factors Drive builds operational alerting around power performance event interpretation, and Wattwatchers adds alerting plus performance benchmarking with time-series dashboards that support recurring review cycles.
Fleet operators that want navigation and operations linked on a map or workspace
Raptor Maps uses map-first asset navigation to tie site status, alerts, and production history together, and meteocontrol VCOM links telemetry history to actionable alarm states in its monitoring workspace.
Common buying pitfalls that cause monitoring gaps or slow triage
Monitoring failures often happen when the purchased tool cannot represent the telemetry flow that already exists on the site. Teams also commonly underestimate how much device onboarding and telemetry mapping effort the chosen architecture requires.
Another frequent issue is selecting a system for its dashboards while ignoring how incident correlation works in daily operations. When event history and performance shifts do not connect inside a timeline, investigation becomes a manual sequence of log checks and exports.
Choosing a vendor-native portal while planning to automate monitoring across mixed inverter brands without extra normalization work.
SMA Sunny Portal and Fronius Solar.web are strongest when inverter telemetry aligns with their ecosystems, and Fronius Solar.web requires extra normalization effort for mixed-vendor fleets.
Assuming gateway-led flexibility comes without setup time for device and adapter configuration.
OpenEnergyMonitor provides adapter-based integrations for meters and inverters, but device and adapter setup can be time-consuming for complex installs.
Treating alerts as equivalent across platforms even when alerts are driven by different interpretations of inverter telemetry.
Power Factors Drive interprets power performance events for operational alerting, while GreenPowerMonitor GPM Horizon ties alerts to configurable thresholds, so both will behave differently under the same site conditions.
Overlooking automation fit for polling and reporting throughput before committing to an integration approach.
Power Factors Drive requires automation and API surface validation for high-frequency polling integrations, while SolarAssistant depends on external workflows rather than an internal rules engine for automation.
Selecting a map or workspace UI without checking how external integrations and automation are exposed.
Raptor Maps provides map-first navigation and operational alert workflows, but external integrations and automation transparency are less than API-first competitors.
How We Selected and Ranked These Tools
We evaluated each solar power monitor software on feature coverage, ease of operation, and value for recurring monitoring work. Features account for 40% of the score, and ease and value each account for 30% of the score.
SMA Sunny Portal set the ranking pace because inverter and system event timelines connect performance shifts to status changes, which directly reduces triage time during incidents. SMA Sunny Portal also scored highly because SMA device integration is consistent and site and asset organization supports routine review across multiple locations.
Frequently Asked Questions About solar power monitor software
How do SMA Sunny Portal and Fronius Solar.web handle inverter event timelines for faster fault triage?
What breaks if an integration requires gateway-led local telemetry collection instead of vendor-portal polling?
How does meteocontrol VCOM support admin controls and role-based operational access across multiple sites?
When do export and reporting workflows matter for IEC-style operations reviews in tools like GreenPowerMonitor GPM Horizon and Wattwatchers?
How do Raptor Maps and SolarAssistant differ in how they present multi-site visibility for system owners?
Which tool is better for powering operations workflows around power performance events rather than only device health?
How do 3E SynaptiQ and SolarAssistant keep monitoring consistent across multiple sites without rebuilding dashboards each project?
What integration and interoperability gap appears when monitoring needs to support mixed inverter and metering setups across a portfolio?
Which tool supports fleet alarm threshold tuning tied to telemetry histories for recurring fault triage?
Tools reviewed
Primary sources checked during evaluation.
Referenced in the comparison table and product reviews above.
- Environment EnergyTop 10 Best Solar Power Software of 2026
- Environment EnergyTop 10 Best Solar Panel Monitoring Software of 2026
- Utilities PowerTop 10 Best Power Usage Monitor Software of 2026
- Environment EnergyTop 10 Best Solar Monitoring Services of 2026
- Finance Financial ServicesTop 10 Best Solar Power Financing Services of 2026
Keep exploring
Comparing two specific tools?
Software Alternatives
See head-to-head software comparisons with feature breakdowns, pricing, and our recommendation for each use case.
Explore software alternatives→In this category
Environment Energy alternatives
See side-by-side comparisons of environment energy tools and pick the right one for your stack.
Compare environment energy tools→