GITNUXSOFTWARE ADVICE
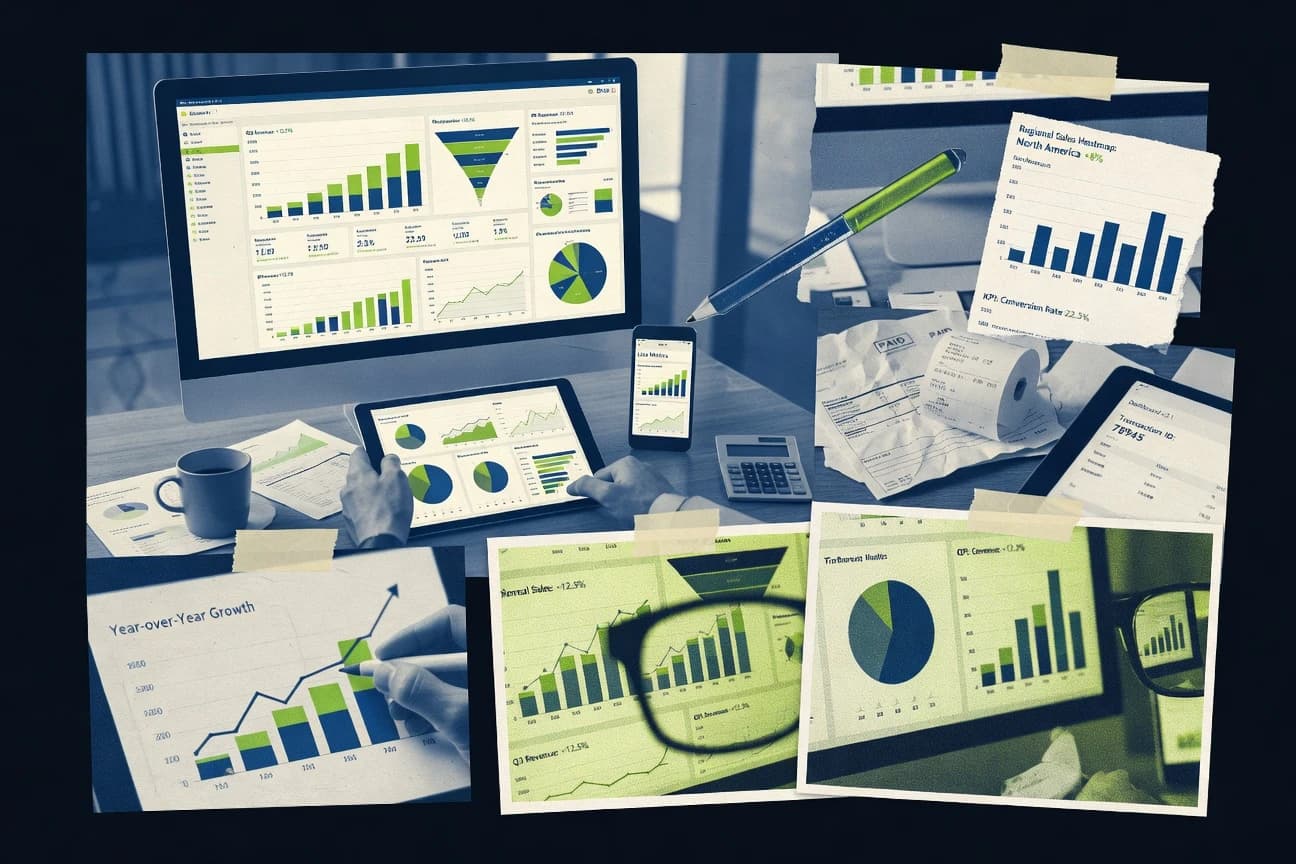
Data Science AnalyticsTop 10 Best Sales Reporting Software of 2026
Discover top 10 sales reporting software to simplify analytics, boost productivity, and make data-driven decisions.

How we ranked these tools
Core product claims cross-referenced against official documentation, changelogs, and independent technical reviews.
Analyzed video reviews and hundreds of written evaluations to capture real-world user experiences with each tool.
AI persona simulations modeled how different user types would experience each tool across common use cases and workflows.
Final rankings reviewed and approved by our editorial team with authority to override AI-generated scores based on domain expertise.
Score: Features 40% · Ease 30% · Value 30%
Gitnux may earn a commission through links on this page — this does not influence rankings. Editorial policy
Editor picks
Three quick recommendations before you dive into the full comparison below — each one leads on a different dimension.
Salesforce Revenue Cloud
Forecasting and pipeline analytics that incorporate CPQ quotes and subscription revenue signals.
Built for enterprise sales teams needing end-to-end revenue reporting across CRM and billing..
Microsoft Power BI
Runner UpDAX measures for custom sales metrics with incremental refresh support
Built for sales teams standardizing dashboards, forecasting, and territory reporting.
Zoho Analytics
Also GreatScheduled dashboard and report delivery with role-based access controls
Built for sales ops teams needing Zoho-connected dashboards, scheduled reporting, and drill-down analytics.
Related reading
Comparison Table
This comparison table reviews sales reporting tools spanning CRM-first platforms like Salesforce Revenue Cloud and HubSpot Sales Hub, plus analytics suites like Microsoft Power BI, Tableau, and Zoho Analytics. You will compare how each tool handles data connection, reporting and dashboards, KPI tracking, and export or sharing for sales performance. The goal is to help you match reporting capabilities to your sales workflow and the systems you already use.
Salesforce Revenue Cloud
enterprise-crmRevenue Cloud provides revenue analytics, forecasting, and sales reporting dashboards connected to CRM data for end-to-end pipeline visibility.
Forecasting and pipeline analytics that incorporate CPQ quotes and subscription revenue signals.
Salesforce Revenue Cloud stands out for tying sales performance reporting directly to CPQ, quote, billing, and subscription outcomes. It supports pipeline and forecast reporting with unified data from CRM and monetization systems, so sales and finance metrics stay aligned. Revenue Cloud also enables dashboards, role-based views, and automated insights through Salesforce Analytics and Einstein-driven prediction surfaces.
- +Unified reporting across CRM, CPQ, billing, and subscription revenue data
- +Strong forecasting and pipeline analytics with drill-down dashboards
- +Einstein analytics supports automated insight discovery for sales metrics
- +Role-based access control supports secure viewing for large sales orgs
- –Complex setup for Revenue Cloud data model and reporting objects
- –Advanced analytics and integrations can require specialist administration
- –Licensing costs can be high for smaller teams with basic reporting needs
Best for: Enterprise sales teams needing end-to-end revenue reporting across CRM and billing.
More related reading
Microsoft Power BI
analytics-platformPower BI delivers interactive sales reporting and forecasting dashboards with broad CRM integrations and strong data modeling capabilities.
DAX measures for custom sales metrics with incremental refresh support
Power BI stands out for turning raw sales data into interactive dashboards with fast self-service publishing to the Power BI Service. It supports data modeling with DAX measures, automated refresh, and robust visual customization for pipeline, forecasting, and quota reporting.
Power BI also integrates tightly with Microsoft ecosystems like Excel, Teams, and Azure, which helps teams collaborate around shared metrics. Governance features like row-level security and audit trails help sales leaders share dashboards while restricting access to sensitive accounts and territories.
- +Strong DAX modeling for precise sales KPIs and forecasting logic
- +Interactive dashboards with cross-filtering and drill-through to deal-level views
- +Works smoothly with Microsoft 365 for sharing and collaboration in Teams
- –DAX and modeling can require training for complex sales scenarios
- –Dashboard design can become time-consuming without a clear standard
- –Performance depends heavily on dataset design and refresh strategy
Best for: Sales teams standardizing dashboards, forecasting, and territory reporting
Tableau
BI-visualizationTableau creates governed, shareable sales reporting visuals and drill-down dashboards across CRM, data warehouse, and operational sources.
Tableau dashboard actions enable interactive drill-through between KPIs, cohorts, and record-level details
Tableau stands out with interactive dashboards and strong visual analytics for sales performance monitoring across regions and funnels. It supports direct connectivity to Salesforce and many other data sources, enabling drill-down from KPIs to underlying records.
Tableau’s calculated fields, parameters, and dashboard actions help sales leaders slice pipeline, forecast, and rep activity in multiple views. Tableau also supports scheduled refresh and shareable dashboard experiences for stakeholders who need self-serve reporting.
- +Interactive dashboards with drill-down lets teams investigate pipeline drivers quickly
- +Strong Salesforce integration supports sales KPIs with governed, reusable views
- +Advanced calculations and parameters enable flexible forecast and funnel analysis
- +Multiple data connectors support cross-source sales reporting beyond CRM data
- –Dashboard building requires skilled users for polished, reliable results
- –Data modeling complexity can slow deployment when requirements change often
- –Governance and permissions can be challenging at large scale
- –Licensing costs rise with user and server needs
Best for: Sales teams needing advanced visual analytics and self-serve drill-down reporting
Zoho Analytics
budget-friendly-biZoho Analytics provides self-service sales reporting with built-in connectors for CRM data and scheduled, shareable dashboards.
Scheduled dashboard and report delivery with role-based access controls
Zoho Analytics stands out with a strong Zoho ecosystem tie-in, especially for teams already using Zoho CRM. It provides a full reporting stack with dashboards, scheduled report delivery, and drill-down analysis for pipeline and revenue KPIs.
Data preparation features like automatic charting, pivot-style exploration, and SQL-style querying support deeper sales reporting without leaving the tool. Collaboration is handled through shared dashboards and role-based access that fits common sales operations workflows.
- +Native Zoho CRM data connections for faster sales KPI reporting
- +Scheduled dashboards deliver pipeline and revenue updates on a set cadence
- +Drill-down charts support root-cause analysis for sales performance drops
- –Dashboard building can feel complex without good data modeling
- –Advanced custom calculations require more training than basic reporting tools
- –Performance tuning for large datasets may demand administrator attention
Best for: Sales ops teams needing Zoho-connected dashboards, scheduled reporting, and drill-down analytics
HubSpot Sales Hub reporting
crm-native-reportingSales Hub reporting in HubSpot tracks pipeline performance, deal stages, and sales activity with standardized dashboards across the CRM workflow.
Deal and pipeline reporting driven by CRM properties and pipeline stages
HubSpot Sales Hub reporting stands out because it ties sales dashboards directly to CRM activity like deals, pipeline stages, and engagement events. Its reporting covers funnel performance, rep productivity, and forecast visibility using deal properties and activity timelines.
You also get automated report building with CRM filters, plus alerts that flag deal and pipeline changes. The reporting value is strongest when your sales process already lives inside HubSpot and you use Sales Hub features consistently.
- +CRM-native dashboards track deals and pipeline stages without complex setup
- +Custom report filters use deal properties, owners, and lifecycle dates
- +Forecast and performance views support rep-level accountability
- +Report subscriptions notify teams when key metrics shift
- –Advanced reporting can feel limited versus dedicated BI tools
- –Data modeling depends on HubSpot properties and consistent CRM hygiene
- –Reporting outcomes require Sales Hub setup, not just importing data
Best for: HubSpot-first sales teams needing CRM-linked dashboards and rep performance reporting
Pipedrive Sales reporting
crm-native-reportingPipedrive reporting summarizes deal pipeline, lead status, and team performance with dashboards tailored to sales workflows.
Revenue and forecasting dashboards based on pipeline stages and expected close dates
Pipedrive Sales reporting stands out for tying pipeline data directly to dashboards built for deal stages, activities, and revenue visibility. It delivers manager-focused views like sales performance by rep, deal progression trends, and forecast tracking across teams.
Reporting integrates tightly with Pipedrive so filters and metrics follow the same fields used in everyday pipeline work. It lacks the deep BI breadth and governance tooling found in dedicated analytics platforms.
- +Pipeline-native dashboards keep reporting aligned with deal stages
- +Sales performance reporting by rep supports quick coaching conversations
- +Forecast and revenue views reflect ongoing pipeline changes
- –Limited customization compared with dedicated BI suites
- –Advanced modeling and data governance features are minimal
- –Reporting depends heavily on fields defined inside Pipedrive
Best for: Sales teams using Pipedrive who need actionable pipeline reporting
SAP BusinessObjects Web Intelligence
enterprise-reportingSAP BusinessObjects Web Intelligence supports sales reporting with report authoring, scheduling, and analytics over enterprise data sources.
Web Intelligence document prompting with reusable parameterized queries
SAP BusinessObjects Web Intelligence stands out for report authoring and governed publishing inside the SAP analytics stack. It supports interactive Web Intelligence document creation with data retrieval from SAP and non-SAP sources using relational schemas.
You can build parameterized reports, schedule deliveries, and distribute results through a BI platform with role-based access. Its strength is structured sales reporting on curated datasets, not self-service dashboards with heavy real-time exploration.
- +Strong SAP integration for sales reporting from enterprise data sources
- +Parameter prompts enable reusable sales document templates for teams
- +Scheduling and managed distribution work well for recurring sales packs
- +Rich calculated fields and document-level formatting for consistent outputs
- –Less intuitive authoring experience than modern drag-and-drop BI tools
- –Interactive drill experience can feel limited for deep exploratory analysis
- –Document-centric workflows can slow fast iteration during sales reviews
- –Licensing and administration complexity rise when expanding users and sources
Best for: Enterprises standardizing sales reports on governed datasets within SAP BI
Qlik Sense
analytics-platformQlik Sense delivers associative analytics for sales reporting dashboards that reveal relationships across customer, product, and pipeline data.
Associative indexing for automatic search across related sales data fields
Qlik Sense stands out for associative analytics that lets sales users explore linked data without fixed drill paths. It delivers interactive dashboards, guided analytics, and self-service visualizations for pipeline, forecasting, and quota reporting.
Strong data modeling features like in-memory processing support fast filtering across large sales datasets. Advanced governance options help manage app security and data access across teams.
- +Associative engine supports flexible sales discovery across multiple dimensions
- +Interactive dashboards update quickly with in-memory analytics
- +Strong data modeling improves reuse of metrics across sales reports
- +Governance controls help secure apps and data for sales teams
- –Designing a clean data model takes specialist effort
- –Complex selections can confuse sales users without training
- –Collaboration and sharing workflows can feel heavy in larger deployments
Best for: Sales analytics teams needing associative exploration and reusable KPI models
Looker
semantic-biLooker enables sales reporting with semantic modeling, governed metrics, and dashboards that align teams on consistent KPIs.
LookML semantic modeling for governed metrics and dimensions
Looker stands out with LookML, a modeling language that centralizes metrics and governance for consistent sales reporting across teams. It connects to multiple data sources, builds explore-based dashboards, and supports scheduled delivery for recurring sales KPIs.
Its strengths show up when sales, RevOps, and analytics teams need shared definitions for pipeline, forecasting, and performance reporting. Visualizations are powerful but the modeling workflow typically requires more analytics setup than template-first reporting tools.
- +LookML enforces consistent sales metrics across dashboards and reports
- +Explore-based querying lets sales teams slice pipeline data without custom SQL
- +Scheduled reports and subscriptions support recurring KPI delivery
- –LookML modeling adds setup overhead compared with drag-and-drop tools
- –Admin and developer skills are often required for governance and performance tuning
- –Advanced customization can increase iteration time for business report changes
Best for: RevOps and analytics teams standardizing sales metrics with governed semantic modeling
Google Sheets and Data Studio (Looker Studio)
lightweight-biLooker Studio builds lightweight sales reporting dashboards from connected data sources and spreadsheet-based datasets.
Looker Studio interactive dashboard filters and drill-down built on live data connections
Google Sheets and Looker Studio stand out because they combine spreadsheet-based modeling with dashboard-grade reporting in one Google-centric workflow. Sheets supports formulas, pivot tables, and data import so sales teams can clean and shape pipeline and quota data without a dedicated ETL tool.
Looker Studio connects to Sheets and other data sources, then delivers interactive charts, filters, and shareable dashboards for sales performance reviews. The pairing is strong for lightweight analytics and cross-team visibility, but it can strain under complex governance and large-scale data transformations.
- +Sheets formulas and pivot tables support fast sales metric modeling
- +Looker Studio dashboards add interactive filters and drill-down views
- +Built-in sharing and permissions integrate with Google Workspace accounts
- –Large datasets can slow Sheets calculations and dashboard refreshes
- –Advanced semantic modeling needs extra setup and design discipline
- –Governance and audit workflows are weaker than dedicated BI platforms
Best for: Sales teams using Google data to build interactive dashboards quickly
Conclusion
After evaluating 10 data science analytics, Salesforce Revenue Cloud stands out as our overall top pick — it scored highest across our combined criteria of features, ease of use, and value, which is why it sits at #1 in the rankings above.
Use the comparison table and detailed reviews above to validate the fit against your own requirements before committing to a tool.
How to Choose the Right Sales Reporting Software
This buyer's guide helps you choose sales reporting software by mapping reporting needs to concrete capabilities in Salesforce Revenue Cloud, Microsoft Power BI, Tableau, Zoho Analytics, and the other tools in this guide. You will also learn what to look for in data modeling, drill-down, governance, and scheduling using Qlik Sense, Looker, and SAP BusinessObjects Web Intelligence. The guide finishes with common implementation mistakes that slow reporting programs across Salesforce, Microsoft, and Google-centric deployments.
What Is Sales Reporting Software?
Sales reporting software turns CRM activity, pipeline stages, and forecasting signals into dashboards, scheduled reports, and drill-down views that sales leaders and RevOps teams can use to run pipeline and performance reviews. It solves problems like inconsistent KPI definitions, slow insight discovery, and reporting that cannot trace metrics back to deals or records. Tools like Tableau and Microsoft Power BI focus on interactive analysis over connected data sources. Salesforce Revenue Cloud extends sales reporting into end-to-end revenue outcomes by connecting CRM reporting to CPQ quotes, billing, and subscription revenue signals.
Key Features to Look For
Sales reporting tools differ most in how they model sales metrics, connect to source systems, and deliver governed, actionable views to different stakeholders.
End-to-end revenue reporting tied to monetization systems
If you need pipeline and forecasting that incorporate CPQ quotes and subscription revenue signals, Salesforce Revenue Cloud connects reporting across CRM and monetization systems for end-to-end pipeline visibility. This matters when sales performance reporting must align with finance outcomes tied to billing and subscription changes.
Semantic KPI definitions and governed metrics
Looker uses LookML to centralize metrics and enforce consistent KPI logic across dashboards and reports. This feature reduces metric drift across teams by making pipeline and forecasting metrics reusable with governed dimensions.
Custom metric modeling with precision measures
Microsoft Power BI supports DAX measures for custom sales KPIs and forecasting logic, which is critical for organizations with specialized quota formulas. Power BI also uses incremental refresh support so reporting can stay responsive as new sales data arrives.
Interactive drill-through from KPIs to record-level detail
Tableau provides dashboard actions that enable interactive drill-through between KPIs, cohorts, and record-level details for fast root-cause investigation. Qlik Sense supports associative analytics that lets users explore relationships across customer, product, and pipeline data without fixed drill paths.
Role-based access and governed publishing
Zoho Analytics includes role-based access for shared dashboards and scheduled deliveries, which helps sales ops control who can view sensitive territories and accounts. Salesforce Revenue Cloud also supports role-based access control for secure viewing in large sales organizations.
Scheduled reporting and automated delivery for recurring KPI reviews
Zoho Analytics emphasizes scheduled dashboard and report delivery to keep pipeline and revenue updates on a consistent cadence. Looker supports scheduled reports and subscriptions for recurring KPI delivery, while SAP BusinessObjects Web Intelligence supports scheduled deliveries and managed distribution for recurring sales packs.
How to Choose the Right Sales Reporting Software
Pick the tool that matches your source systems, your metric governance needs, and how your teams actually consume sales performance updates.
Start with the reporting outputs you must produce
If your leadership reviews depend on forecasts that incorporate CPQ quotes and subscription revenue signals, choose Salesforce Revenue Cloud because it ties sales performance reporting to CPQ, quote, billing, and subscription outcomes. If your organization needs interactive self-serve analysis across regions and funnels with record-level drill-through, choose Tableau because it enables drill-through between KPIs and underlying details. If you need lightweight dashboards that connect directly to spreadsheet-modeled data, choose Google Sheets and Looker Studio because they deliver interactive charts, filters, and shareable dashboards on connected data.
Match your data modeling approach to your team’s skills
If your team can build metric logic using DAX and maintain refresh strategy, Microsoft Power BI fits because it supports DAX measures and incremental refresh support for forecasting logic. If you want governed metric definitions built once and reused across teams, Looker fits because LookML centralizes metrics and dimensions. If you need associative exploration where users discover relationships across multiple dimensions, Qlik Sense fits because its associative engine supports flexible sales discovery and fast in-memory filtering.
Validate how drill-down and exploration work for deal reviews
If your sales leaders must jump from KPIs to record-level details during live pipeline reviews, Tableau fits because dashboard actions enable interactive drill-through to record-level details. If users need flexible exploration without fixed drill paths, Qlik Sense fits because associative indexing supports automatic search across related sales data fields. If your reporting workflow is structured around reusable documents and parameters, SAP BusinessObjects Web Intelligence fits because Web Intelligence supports document prompting with parameterized queries.
Confirm how the tool handles governance, permissions, and distribution
If your org requires governed publishing and role-based access for dashboards and deliveries, Salesforce Revenue Cloud and Zoho Analytics both support role-based access control for secure viewing. If you operate with a shared definition layer across multiple teams, Looker fits because LookML enforces consistent metrics and dimensions. If your distribution model centers on scheduled recurring report packs, SAP BusinessObjects Web Intelligence fits because it supports scheduling and managed distribution.
Choose based on how your sales process lives in the source CRM
If your sales process is already HubSpot-first and you want reporting driven by deals, pipeline stages, and engagement timelines, HubSpot Sales Hub reporting fits because it builds standardized dashboards using CRM filters and sends alerts when deal and pipeline changes. If your sales process is already inside Pipedrive and you want reporting aligned with deal stages and expected close dates, Pipedrive Sales reporting fits because it delivers manager-focused pipeline and forecast dashboards from Pipedrive fields. If you run sales reporting from SAP enterprise data sources with controlled datasets, SAP BusinessObjects Web Intelligence fits because it retrieves from SAP and non-SAP sources using relational schemas.
Who Needs Sales Reporting Software?
Sales reporting software benefits different teams based on where their pipeline truth lives and how they run performance reviews.
Enterprise sales teams that need end-to-end revenue reporting across CRM and monetization
Salesforce Revenue Cloud fits this segment because it unifies reporting across CRM, CPQ, billing, and subscription outcomes while incorporating CPQ quotes and subscription revenue signals into forecasting and pipeline analytics.
Sales teams standardizing forecasting, territory reporting, and KPI logic in Microsoft environments
Microsoft Power BI fits this segment because it connects well with Microsoft 365 tools for sharing in Teams and supports DAX measures plus incremental refresh support for custom forecasting logic.
Sales analytics teams that need associative exploration and reusable KPI models
Qlik Sense fits this segment because its associative engine supports flexible discovery across linked customer, product, and pipeline data and its governance options help secure apps and data across teams.
RevOps and analytics teams that must standardize metrics and governance across departments
Looker fits this segment because LookML enforces consistent sales metrics and dimensions across explore-based dashboards and scheduled report delivery.
Common Mistakes to Avoid
These pitfalls appear repeatedly across the tools because sales reporting success depends on setup discipline, data modeling, and refresh design.
Building reports without a clear data model for metrics and refresh behavior
Power BI can require training and careful dataset design because DAX modeling and refresh strategy strongly affect performance. Tableau and Zoho Analytics can also slow down deployment when dashboard design or custom calculations depend on complex data modeling.
Expecting real-time updates without engineered refresh pipelines
Tableau real-time behavior depends on refresh schedules and data pipelines because updates rely on scheduled refresh and governed data flows. Google Sheets and Looker Studio can strain with large datasets because Sheets calculations and dashboard refreshes can slow under heavier transformations.
Using a CRM-native reporting tool for cross-system analytics you did not integrate
HubSpot Sales Hub reporting delivers value when sales execution lives inside HubSpot because reporting depends on deal properties and consistent CRM hygiene. Pipedrive Sales reporting similarly depends on the fields defined inside Pipedrive, so reporting depth stays limited if you need broader data integration.
Skipping governance controls for shared dashboards and scheduled deliveries
Sales dashboards become risky without role-based access controls because large teams need secure viewing for territories and accounts. Zoho Analytics and Salesforce Revenue Cloud both include role-based access controls, and Looker centralizes governed metrics with LookML to prevent inconsistent KPI definitions.
How We Selected and Ranked These Tools
We evaluated each sales reporting tool on overall capability, feature depth, ease of use for day-to-day reporting, and value for teams that need recurring pipeline and performance insights. We also separated tools by how effectively they turn sales signals into usable outputs like drill-through dashboards and scheduled KPI delivery. Salesforce Revenue Cloud stood out because it ties forecasting and pipeline analytics to CPQ quotes and subscription revenue signals while also connecting reporting to CRM, quote, billing, and subscription outcomes. Lower-ranked tools in this set were more constrained to document workflows like SAP BusinessObjects Web Intelligence or lightweight workflows like Google Sheets and Looker Studio when deeper governance and scalable data modeling are required.
Frequently Asked Questions About Sales Reporting Software
Which sales reporting tool connects pipeline and forecast reporting to quote, billing, and subscription outcomes?
What tool is best for building interactive sales dashboards with fast self-service publishing and strong governance?
How do Tableau and Looker differ for drill-down reporting and governed metric definitions?
Which option supports associative exploration when sales users need to slice pipeline data without fixed drill paths?
What tool is strongest for scheduling and distributing sales reports while staying inside a curated enterprise analytics workflow?
Which sales reporting software is the most direct fit for HubSpot-first teams that want rep and funnel reporting tied to CRM activity?
How can sales ops teams handle drill-down reporting and recurring delivery when they already run Zoho CRM?
Which tool is best for manager-focused pipeline visibility that mirrors the fields used in daily sales operations?
What is a practical way to combine spreadsheet modeling with interactive sales dashboards for cross-team visibility?
Why do some sales reporting projects get stuck on data prep, and which tools offer features to reduce that friction?
Tools reviewed
Primary sources checked during evaluation.
Referenced in the comparison table and product reviews above.
Keep exploring
Comparing two specific tools?
Software Alternatives
See head-to-head software comparisons with feature breakdowns, pricing, and our recommendation for each use case.
Explore software alternatives→In this category
Data Science Analytics alternatives
See side-by-side comparisons of data science analytics tools and pick the right one for your stack.
Compare data science analytics tools→FOR SOFTWARE VENDORS
Not on this list? Let’s fix that.
Our best-of pages are how many teams discover and compare tools in this space. If you think your product belongs in this lineup, we’d like to hear from you—we’ll walk you through fit and what an editorial entry looks like.
Apply for a ListingWHAT THIS INCLUDES
Where buyers compare
Readers come to these pages to shortlist software—your product shows up in that moment, not in a random sidebar.
Editorial write-up
We describe your product in our own words and check the facts before anything goes live.
On-page brand presence
You appear in the roundup the same way as other tools we cover: name, positioning, and a clear next step for readers who want to learn more.
Kept up to date
We refresh lists on a regular rhythm so the category page stays useful as products and pricing change.