GITNUXSOFTWARE ADVICE
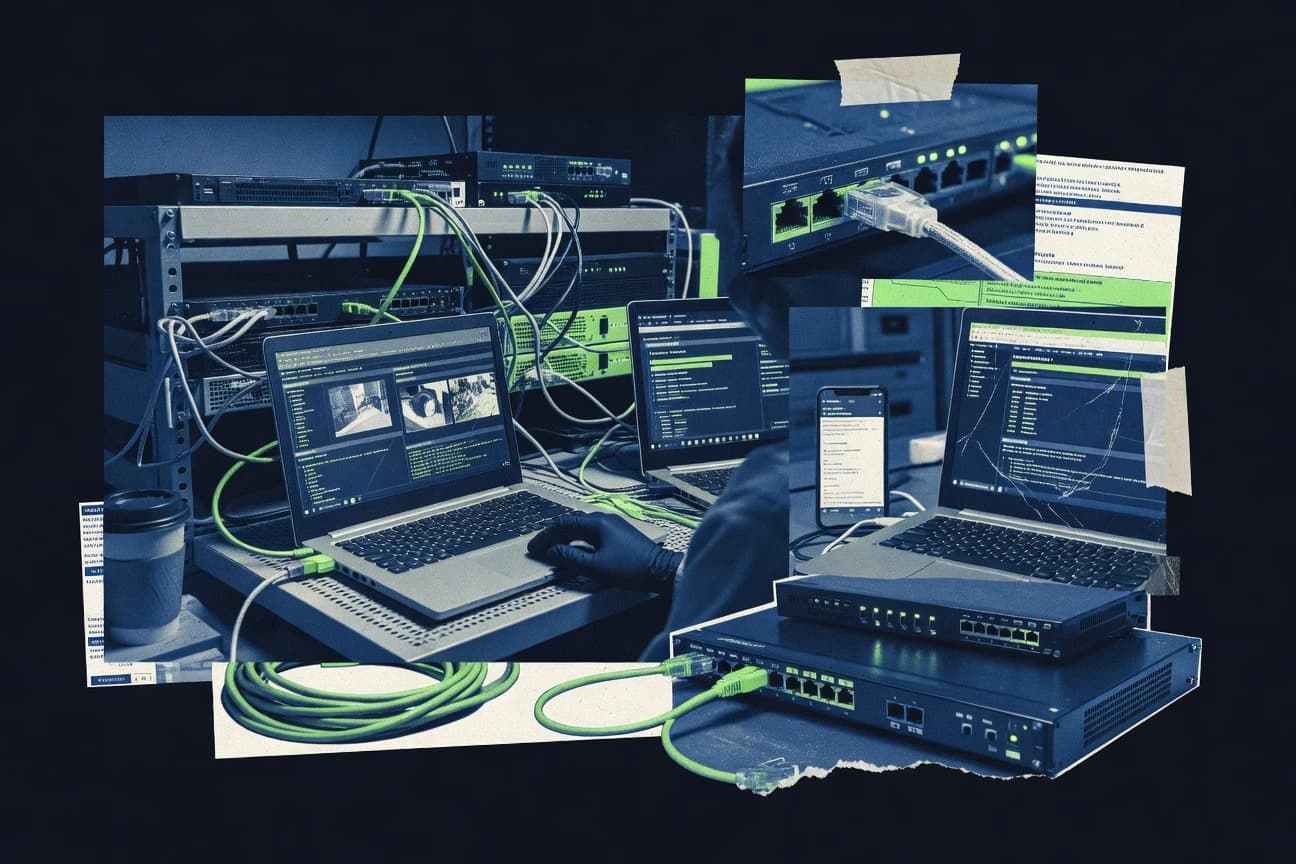
Technology Digital MediaTop 10 Best Network Spy Software of 2026
Explore top 10 network spy software for monitoring, insights, and better security.

How we ranked these tools
Core product claims cross-referenced against official documentation, changelogs, and independent technical reviews.
Analyzed video reviews and hundreds of written evaluations to capture real-world user experiences with each tool.
AI persona simulations modeled how different user types would experience each tool across common use cases and workflows.
Final rankings reviewed and approved by our editorial team with authority to override AI-generated scores based on domain expertise.
Score: Features 40% · Ease 30% · Value 30%
Gitnux may earn a commission through links on this page — this does not influence rankings. Editorial policy
Editor picks
Three quick recommendations before you dive into the full comparison below — each one leads on a different dimension.
Wireshark
Display filter engine with protocol-aware field selectors and fast packet re-filtering
Built for security analysts and network engineers investigating traffic at packet level.
Suricata
Runner UpSignature-driven detection with comprehensive deep packet inspection across many protocols
Built for security teams needing high-fidelity IDS monitoring with customizable rules.
Zeek
Also GreatScriptable event framework with protocol analyzers that emit normalized JSON-like logs
Built for security teams needing customizable IDS-style network visibility with log-centric workflows.
Related reading
Comparison Table
This comparison table reviews network spy and traffic analysis tools used for deep packet inspection, protocol logging, and intrusion detection. It contrasts Wireshark, Suricata, Zeek, Security Onion, pfSense, and other utilities by coverage, deployment model, rule or signature support, and typical workflows for monitoring live traffic and analyzing packet captures. Readers can use the results to match tool capabilities to operational needs such as packet forensics, threat detection pipelines, and network visibility.
Wireshark
packet analysisCaptures and analyzes network traffic in real time and from capture files to inspect protocols, reconstruct sessions, and troubleshoot communications.
Display filter engine with protocol-aware field selectors and fast packet re-filtering
Wireshark stands out for deep packet inspection with a fast, interactive packet list and protocol tree. It captures network traffic, decodes hundreds of protocols, and supports powerful display filters to pinpoint suspicious flows. It also enables packet-level analysis for troubleshooting and security investigations by exporting sessions and statistics like conversations and endpoints.
- +Built-in protocol dissectors for extensive traffic decoding and analysis
- +Display filters rapidly isolate streams, hosts, and protocol fields
- +Rich statistics for conversations, endpoints, and protocol breakdowns
- +PCAP capture and export for repeatable investigations and sharing
- +Scriptable dissectors and capture filters for specialized workflows
- –Learning display filters and protocol structure takes real practice
- –Large captures can slow down machines without capture or filter tuning
- –Network spying requires careful configuration and strict permission handling
Best for: Security analysts and network engineers investigating traffic at packet level
More related reading
Suricata
network IDSInspects network traffic with IDS and IPS rules to detect suspicious activity and produce detailed alerts for network monitoring.
Signature-driven detection with comprehensive deep packet inspection across many protocols
Suricata stands out as an open-source network intrusion detection and network security monitoring engine with mature protocol parsing. It performs deep packet inspection using rule-driven detection for signatures, traffic classification, and anomaly-style checks.
It also exports rich telemetry like alerts and flow records, which enables continuous monitoring workflows in SIEM and data pipelines. The tool runs as a high-performance sensor on mirrored, tapped, or SPAN traffic to observe real network behavior.
- +Deep protocol parsing supports strong signature-based detection
- +Scalable packet processing with flow and alert outputs for downstream analysis
- +Rule customization enables tailored detections for specific environments
- +Integrates well with SIEM pipelines through standard alert and flow formats
- –Initial tuning of rules and thresholds can be time-consuming
- –Operational complexity rises when deploying and maintaining sensors at scale
- –Accurate deployments require careful placement and traffic visibility
Best for: Security teams needing high-fidelity IDS monitoring with customizable rules
Zeek
network monitoringPerforms passive network monitoring by logging application-level events and traffic metadata for threat detection and forensics.
Scriptable event framework with protocol analyzers that emit normalized JSON-like logs
Zeek stands out for deep, scriptable network traffic analysis using a mature event-driven framework. It captures and parses protocol activity into rich logs for intrusion detection workflows, not just packet inspection. Core capabilities include customizable detection logic, normalized protocol analyzers, and structured output that feeds dashboards, SIEM tools, and incident investigations.
- +Event-driven Zeek scripts turn raw traffic into actionable, structured security logs
- +Protocol analyzers normalize traffic for consistent detection and investigation
- +Flexible logging pipelines support SIEM ingestion and forensic workflows
- +Detections can be extended without modifying the core sensor
- –Initial setup and tuning require strong familiarity with network traffic and Zeek scripting
- –High log volumes can increase storage and processing overhead in active environments
- –Performance tuning often becomes necessary for high-throughput links
- –Out-of-the-box detections may not cover every niche protocol or policy
Best for: Security teams needing customizable IDS-style network visibility with log-centric workflows
Security Onion
SIEM stackDeploys an integrated network security monitoring stack that combines Suricata, Zeek, and Elasticsearch-style storage for investigation and alerting.
Elastic-based analyst search tied to Zeek and Suricata detections with evidence-grade PCAP capture
Security Onion distinguishes itself with a full open-source network detection and response stack that combines packet capture, log enrichment, and analyst-facing dashboards. It supports Zeek for deep network telemetry, Suricata for signature and rule-based detection, and integrates search and alerting via Elasticsearch and Kibana.
For investigation workflows, it includes streamlined alert triage and can record PCAP evidence tied to detections. Deployment as a dedicated monitoring sensor makes it suitable for continuous monitoring of VLANs and routed networks.
- +Prebuilt detection stack with Zeek and Suricata for full network visibility
- +Strong investigation workflow using Elasticsearch and Kibana search
- +PCAP capture is integrated for evidence collection tied to alerts
- –Sensor tuning and rules management require ongoing operational effort
- –Resource demands scale quickly with traffic volume and indexing
- –Platform depth can slow setup for teams without Linux and SIEM experience
Best for: Security teams running dedicated network monitoring sensors and detection triage
pfSense
network firewallProvides firewall and routing with traffic visibility features like packet capture and logging to support network inspection workflows.
Packet capture on interfaces with flexible filters for rapid traffic investigation
pfSense stands out by combining a full open network firewall and routing stack with deep visibility through built-in services. Core capabilities include stateful firewalling, VPN termination for remote access and site-to-site tunnels, and granular traffic rules that support inspection and logging. Packet capture tools and dashboard-backed monitoring help operators investigate suspicious flows across interfaces and segments.
- +Stateful firewall and rule ordering support precise traffic control
- +Built-in VPN termination enables monitored encrypted tunnels
- +Logging and packet capture support targeted network investigation
- –Operational complexity rises with advanced rule sets and integrations
- –Threat hunting workflows depend on external tooling for automation
- –Web UI configuration can be slow for large, frequent policy changes
Best for: Organizations needing on-prem network spying via firewall logs and packet capture
OPNsense
network firewallDelivers firewall, routing, and traffic analysis capabilities with packet capture and logging tools for network inspection use cases.
Suricata IDS and alerting integrated into OPNsense firewall event workflows
OPNsense stands out with its firewall-first design that pairs network traffic visibility with active policy enforcement. It offers packet logging, traffic graphs, and intrusion detection through Suricata integrations for ongoing inspection.
Administrators can build VLAN segmentation and routing rules that support monitoring goals alongside containment actions. Its security monitoring workflow centers on collecting, analyzing, and reacting to traffic events across interfaces and networks.
- +Suricata integration enables deep packet inspection and IDS alerting
- +NetFlow IPFIX exports and traffic graphs support ongoing monitoring baselines
- +Fine-grained firewall rules align monitoring with enforcement actions
- +VLAN and routing features support clean segmentation for observation
- –Initial setup and tuning for detection rules requires hands-on expertise
- –Web interface remains dense for operators focused only on spying
- –Alert triage needs extra configuration across feeds and interfaces
Best for: Teams needing on-edge network inspection with firewall enforcement
tshark
CLI packet analysisRuns command-line packet capture and protocol dissection for automated network spying tasks, scripting, and batch analysis.
Readable field extraction via display filters with structured output for automation
tshark is the command-line network protocol analyzer that shares Wireshark’s parsing engine for deep packet inspection. It captures live traffic or processes existing capture files to extract fields, generate statistics, and build protocol-aware summaries.
Strong scripting support enables automated filtering, targeted extraction, and batch analysis across large trace sets. It is most effective for forensic-style visibility into traffic patterns rather than hands-off endpoint monitoring.
- +Protocol dissection with extensive Wireshark-style decoders
- +Flexible capture and offline analysis for pcaps and live interfaces
- +Scripting-friendly output formats for automation and field extraction
- –Command-line workflows slow down ad hoc investigations
- –Requires correct filters and permissions for accurate capture coverage
- –Not built for continuous monitoring dashboards or alerting
Best for: Security teams needing automated packet extraction and offline traffic forensics
PRTG Network Monitor
network monitoringMonitors network availability and performance with device and traffic sensors that help identify unusual behavior across hosts and links.
Sensor-based monitoring with configurable alert thresholds and multiple notification methods
PRTG Network Monitor stands out with its device- and sensor-based monitoring model that turns discovered infrastructure into hundreds of measurable checks. Core capabilities include SNMP and WMI polling, flow and traffic monitoring, threshold and alerting, and event correlation that can notify teams via multiple channels.
The platform also supports custom sensors and packet-based monitoring for deeper visibility into services and application behavior. Configuration and operation center on monitoring objects, probe locations, and rules that govern alert severity and routing.
- +Sensor-driven monitoring quickly maps devices into actionable checks
- +Strong SNMP and WMI support covers diverse Windows and network equipment
- +Flexible alerting with schedules, thresholds, and notification routing
- +Packet and service monitoring enables visibility beyond basic ping checks
- –Large sensor counts can make configuration and troubleshooting harder
- –Learning sensor types, limits, and monitoring settings takes time
- –Visualizations and reporting can feel heavy without careful tuning
Best for: Teams needing sensor-based monitoring across mixed networks with detailed alerting
SolarWinds Network Performance Monitor
enterprise monitoringTracks network performance and flow-related metrics to surface latency, utilization, and anomalies for operational visibility.
Integrated NetFlow and SNMP performance correlation for bandwidth and path troubleshooting
SolarWinds Network Performance Monitor distinguishes itself with deep SNMP and flow-based monitoring tied to actionable performance diagnostics. It collects interface, application, and network path metrics and surfaces bottlenecks through alerting, dashboards, and baselines.
Network discovery and topology mapping support operational visibility across distributed networks. The solution also offers reporting and root-cause-oriented analysis for sustained performance troubleshooting.
- +Strong SNMP polling with interface-centric performance baselines
- +Topology mapping and dependency views help trace performance impacts
- +Alerting and dashboards support ongoing monitoring and escalation
- –Initial setup and tuning for accurate thresholds can be time-consuming
- –Advanced customization can require admin-level configuration discipline
- –Alert noise risk increases without careful baseline and suppression tuning
Best for: Network teams needing SNMP-driven performance visibility and troubleshooting at scale
ManageEngine OpManager
network monitoringMonitors network devices and services with performance thresholds and diagnostics to support investigation of connectivity issues.
Dependency mapping that links monitored device status to service impact.
ManageEngine OpManager stands out with broad network monitoring coverage across SNMP, ICMP, and agent-based device discovery. It delivers infrastructure visibility through device and interface health monitoring, configurable alerting, and performance trending for long-term capacity insights.
The tool supports dependency-aware views that connect device status to services, which helps teams prioritize fixes. Network Spy-style needs are covered through continuous discovery, topology-oriented reporting, and alert-driven investigation.
- +Strong device and interface monitoring using SNMP and ICMP
- +Performance trending supports proactive capacity planning from historical data
- +Configurable alert rules improve investigation speed during outages
- +Dependency and service views help connect device faults to impact
- –Initial discovery tuning takes effort for large, segmented networks
- –Dashboards can feel crowded without careful tuning and role design
- –Advanced automation workflows require deeper configuration knowledge
Best for: Network and NOC teams needing continuous monitoring with service impact visibility
Conclusion
After evaluating 10 technology digital media, Wireshark stands out as our overall top pick — it scored highest across our combined criteria of features, ease of use, and value, which is why it sits at #1 in the rankings above.
Use the comparison table and detailed reviews above to validate the fit against your own requirements before committing to a tool.
How to Choose the Right Network Spy Software
This buyer’s guide covers the practical differences between packet capture tools like Wireshark and tshark, protocol and session monitoring platforms like Zeek, and IDS and sensor stacks like Suricata and Security Onion. It also covers firewall and edge visibility options like pfSense and OPNsense, plus monitoring suites that support network spy-style investigation with performance and dependency views like SolarWinds Network Performance Monitor and ManageEngine OpManager. Coverage also includes monitoring-centric approaches with thresholds and alerts like PRTG Network Monitor.
What Is Network Spy Software?
Network Spy Software captures network behavior and security-relevant signals so teams can investigate traffic patterns, troubleshoot communications, and detect suspicious activity. Some tools focus on packet-level inspection such as Wireshark and tshark that decode protocols and extract fields from live traffic or capture files. Other tools log application-level and session metadata for intrusion-detection workflows such as Zeek, or run rule-driven deep packet inspection with alert and flow outputs such as Suricata. Teams also deploy integrated stacks like Security Onion to combine Zeek and Suricata visibility with analyst search and evidence-grade PCAP tied to detections.
Key Features to Look For
The right tool depends on whether the investigation starts from packets, protocol-aware sessions, IDS alerts, or network performance symptoms.
Protocol-aware packet inspection and fast re-filtering
Wireshark excels at deep packet inspection with an interactive packet list and protocol tree that help analysts move from suspicious packets to the exact protocol fields involved. tshark supports the same protocol decoders in a command-line workflow so field extraction and batch processing stay consistent across investigations.
Display filters and field-based isolation for investigations
Wireshark’s display filter engine uses protocol-aware field selectors to quickly isolate streams, hosts, and protocol-specific conditions. tshark mirrors this approach in automation-friendly output so scripts can re-filter traces using the same display filter logic.
Signature-driven IDS detection with deep packet inspection
Suricata focuses on signature-driven detection with comprehensive deep packet inspection across many protocols. Security Onion packages Suricata alongside Zeek and connects detection outcomes to analyst search so teams can pivot from alerts to enriched telemetry and captured evidence.
Event-driven network telemetry with structured, normalized logs
Zeek transforms traffic into structured logs through an event-driven framework and protocol analyzers that emit normalized JSON-like records. This design supports log-centric security workflows and SIEM ingestion pipelines where consistent fields matter for detection and investigation.
Evidence capture tied to detections and analyst search workflows
Security Onion integrates Elastic-based analyst search with Zeek and Suricata detections and includes PCAP capture tied to alerts for evidence-grade investigation. This combination reduces the need to correlate alerts with separate capture tools during triage.
Edge and policy-plane visibility using firewall and IDS integration
pfSense provides packet capture on interfaces with flexible filters so investigations can start directly from the monitored segment. OPNsense integrates Suricata IDS and alerting into firewall event workflows so monitoring results connect to the same edge system that enforces network containment actions.
Performance and dependency signals that support operational investigation
SolarWinds Network Performance Monitor correlates NetFlow and SNMP performance metrics to pinpoint bandwidth and path bottlenecks tied to operational baselines. ManageEngine OpManager adds dependency mapping that links monitored device status to service impact so connectivity investigations can prioritize the systems that matter.
Sensor-based availability monitoring with alert thresholds
PRTG Network Monitor builds monitoring from discovered infrastructure using SNMP and WMI polling with configurable alert thresholds and notification routing. It also supports packet and service monitoring so teams can investigate beyond basic ping checks when unusual behavior appears.
How to Choose the Right Network Spy Software
Choose the tool that matches the investigation entry point and output format needed for triage and follow-up actions.
Start from the investigation entry point
If investigations begin with packet anatomy, select Wireshark for interactive protocol trees and fast display filter re-filtering. If investigations begin with automated extraction at scale, select tshark to run protocol dissection with scriptable field extraction over live interfaces or capture files.
Decide between packet forensics and IDS-style detection workflows
If the goal is deep packet inspection that produces IDS and IPS style alerts, Suricata and Security Onion fit because Suricata generates alerts and flow records. If the goal is log-centric detections built from application-level and session events, Zeek is the better fit because it emits structured logs from an event-driven framework.
Match the deployment model to where visibility exists
For teams deploying a dedicated monitoring sensor, Security Onion is designed to run a Zeek and Suricata detection stack with Elastic-based search and integrated PCAP evidence. For teams that want spying at the policy edge, pfSense and OPNsense provide packet capture and traffic logging, with OPNsense adding Suricata IDS and alerting inside firewall workflows.
Plan for storage, tuning, and operational overhead
If log volume is a concern, Zeek can increase storage and processing overhead because high-throughput environments generate high log volumes. If detection accuracy depends on rule behavior, Suricata and Security Onion require rule and threshold tuning to avoid time-consuming operational complexity and ensure accurate deployments.
Ensure output format fits investigation and escalation paths
If analyst search and evidence linking are required, Security Onion connects Zeek and Suricata results to Elastic-based search and PCAP capture tied to alerts. If the goal is operational visibility for performance incidents, SolarWinds Network Performance Monitor and ManageEngine OpManager provide SNMP and NetFlow monitoring with topology, baselines, and dependency mapping that support escalation decisions.
Who Needs Network Spy Software?
Different Network Spy Software tools target different roles based on where suspicious behavior is discovered and how investigation outputs are consumed.
Security analysts and network engineers doing packet-level traffic investigations
Wireshark is built for protocol-aware packet inspection with deep decoding and display filters that isolate suspicious flows by protocol fields. tshark supports the same parsing engine in automated batch workflows for offline traffic forensics.
Security teams building IDS monitoring with customizable detection rules
Suricata is a signature-driven IDS engine that performs deep packet inspection and produces alerts and flow records for downstream monitoring pipelines. Security Onion adds an integrated analyst workflow by combining Suricata detections, Zeek telemetry, and Elastic-based search with PCAP evidence tied to alerts.
Security teams that want application-level visibility through structured logs
Zeek focuses on passive network monitoring that logs application-level events and traffic metadata into normalized structured records. This log-centric model suits workflows that feed dashboards and incident investigations.
Teams performing on-edge network inspection and enforcement using firewall event workflows
pfSense supports on-prem network spying using packet capture on interfaces with flexible filters plus logging to investigate suspicious flows across segments. OPNsense integrates Suricata IDS and alerting into firewall event workflows so monitoring and containment actions align on the same edge system.
Network teams focused on performance symptoms and path bottlenecks
SolarWinds Network Performance Monitor combines NetFlow and SNMP performance correlation to surface latency, utilization, and anomaly indicators tied to bandwidth and path troubleshooting. ManageEngine OpManager adds dependency mapping that links monitored device status to service impact for faster fault prioritization during connectivity incidents.
NOC and infrastructure teams needing sensor-based monitoring with threshold alerts across mixed networks
PRTG Network Monitor builds monitoring from discovered infrastructure using SNMP and WMI polling with configurable thresholds and multi-channel notification routing. It also supports packet and service monitoring so teams can investigate unusual behavior with more than availability-only checks.
Common Mistakes to Avoid
Several recurring pitfalls appear across packet inspection, IDS sensors, and firewall-integrated visibility tools.
Choosing a packet tool for continuous monitoring without planning for workflow and performance
Wireshark and tshark are strongest for packet-level inspection, but large captures can slow machines when capture or filter tuning is missing. tshark also does not target continuous monitoring dashboards or alerting, so it should be paired with operational alerting workflows rather than treated as an always-on monitoring solution.
Deploying IDS rules without tuning detection thresholds for the actual traffic you see
Suricata requires initial tuning of rules and thresholds, and inaccurate tuning increases operational complexity at deployment scale. Security Onion also needs ongoing sensor tuning and rules management, especially when indexing and search workloads must stay responsive.
Assuming Zeek will be low-overhead in high-throughput environments
Zeek can generate high log volumes that increase storage and processing overhead when links carry significant traffic. Performance tuning becomes necessary for high-throughput links so log pipelines can remain stable during sustained monitoring.
Treating firewall-based visibility as a complete IDS replacement
pfSense and OPNsense provide packet capture and logging, but threat hunting workflows still depend on external automation when advanced analysis and correlation are needed. OPNsense integrates Suricata IDS and alerting inside firewall event workflows, so it can cover IDS needs more directly than pfSense when Suricata integration is required.
How We Selected and Ranked These Tools
We evaluated every tool on three sub-dimensions with weights of 0.4 for features, 0.3 for ease of use, and 0.3 for value. The overall rating equals 0.40 × features plus 0.30 × ease of use plus 0.30 × value. Wireshark separated itself on features strength because the display filter engine with protocol-aware field selectors enables fast packet re-filtering and deep protocol field isolation during investigations. Tools lower in rank generally had narrower investigation workflows, heavier operational tuning requirements, or less cohesive output formats for tying captures and alerts together.
Frequently Asked Questions About Network Spy Software
Which tool is best for packet-level inspection when network spying needs to identify the exact protocol fields in traffic?
What’s the difference between signature-based detection and event-logging approaches for network spying?
Which network spy stack is most suitable for continuous detection triage with evidence-grade captures?
How do Zeek and Suricata typically fit together in a monitoring workflow?
Which option is better for on-edge network spying that pairs monitoring with enforced traffic policy?
Which tools work best on mirrored, tapped, or SPAN traffic without changing endpoint configurations?
Which tool supports automation when large capture sets must be processed repeatedly for field extraction and reporting?
Which network spying approach helps correlate device availability signals with service impact for operations teams?
Which tool is best suited for network performance spying via SNMP and flow correlation instead of deep protocol parsing?
Tools reviewed
Primary sources checked during evaluation.
Referenced in the comparison table and product reviews above.
Keep exploring
Comparing two specific tools?
Software Alternatives
See head-to-head software comparisons with feature breakdowns, pricing, and our recommendation for each use case.
Explore software alternatives→In this category
Technology Digital Media alternatives
See side-by-side comparisons of technology digital media tools and pick the right one for your stack.
Compare technology digital media tools→FOR SOFTWARE VENDORS
Not on this list? Let’s fix that.
Our best-of pages are how many teams discover and compare tools in this space. If you think your product belongs in this lineup, we’d like to hear from you—we’ll walk you through fit and what an editorial entry looks like.
Apply for a ListingWHAT THIS INCLUDES
Where buyers compare
Readers come to these pages to shortlist software—your product shows up in that moment, not in a random sidebar.
Editorial write-up
We describe your product in our own words and check the facts before anything goes live.
On-page brand presence
You appear in the roundup the same way as other tools we cover: name, positioning, and a clear next step for readers who want to learn more.
Kept up to date
We refresh lists on a regular rhythm so the category page stays useful as products and pricing change.