GITNUXSOFTWARE ADVICE
Telecommunications ConnectivityTop 10 Best Home Network Troubleshooting Software of 2026
Compare the top 10 Home Network Troubleshooting Software tools for fast diagnosis and fixes. Explore picks with Wireshark, Nmap, and PingPlotter.

How we ranked these tools
Core product claims cross-referenced against official documentation, changelogs, and independent technical reviews.
Analyzed video reviews and hundreds of written evaluations to capture real-world user experiences with each tool.
AI persona simulations modeled how different user types would experience each tool across common use cases and workflows.
Final rankings reviewed and approved by our editorial team with authority to override AI-generated scores based on domain expertise.
Score: Features 40% · Ease 30% · Value 30%
Gitnux may earn a commission through links on this page — this does not influence rankings. Editorial policy
Editor’s top 3 picks
Three quick recommendations before you dive into the full comparison below — each one leads on a different dimension.
Wireshark
Display filters with protocol-aware fields for pinpointing retransmits, resets, and name resolution failures
Built for home users and techs diagnosing Wi-Fi, router, and device connectivity issues.
Nmap
Editor pickNmap Scripting Engine running NSE probes for service discovery and diagnostics
Built for home power users diagnosing device exposure and firewall behavior.
PingPlotter
Editor pickReal-time hop chart with packet loss and latency per router hop
Built for home users troubleshooting intermittent latency, jitter, and packet loss on specific paths.
Related reading
Comparison Table
This comparison table evaluates home network troubleshooting tools used for diagnosing latency, packet loss, routing changes, and DNS or device connectivity issues across Wi‑Fi and wired setups. It groups tools such as Wireshark, Nmap, PingPlotter, MTR, and GlassWire by core capabilities, like traffic inspection, reachability testing, and hop-by-hop path analysis, so readers can match each tool to a specific symptom. The table also highlights practical differences in data output and usability to speed up troubleshooting workflows.
Wireshark
packet captureDeep packet capture and protocol dissection for diagnosing LAN, DNS, DHCP, and routing issues using detailed traffic analysis.
Display filters with protocol-aware fields for pinpointing retransmits, resets, and name resolution failures
Wireshark stands out by turning raw network traffic into a searchable, protocol-aware timeline for home debugging. It captures packets on a specific interface and applies display filters that isolate DNS, DHCP, TCP resets, and retransmissions.
Flow reconstruction and protocol dissection make it easier to pinpoint causes of slow browsing, failing logins, or unstable connectivity. The tool also supports offline analysis using saved captures for repeatable troubleshooting between devices.
- +Protocol dissectors highlight DNS, DHCP, TCP, and TLS details in captured packets
- +Advanced display filters isolate specific hosts, ports, and behaviors quickly
- +Follow TCP stream reconstructs conversations for rapid root-cause identification
- +Export and save captures supports offline analysis and documentation
- –Interface selection and capture setup can confuse non-technical home users
- –High traffic volumes make capture management and filtering more difficult
- –Traffic interpretation requires network knowledge to avoid false conclusions
Best for: Home users and techs diagnosing Wi-Fi, router, and device connectivity issues
More related reading
Nmap
network scanningNetwork scanning and host discovery to identify open services, firewall behavior, and connectivity gaps in a home network.
Nmap Scripting Engine running NSE probes for service discovery and diagnostics
Nmap stands out by turning home network troubleshooting into repeatable port and service discovery scans. It can map open ports, detect services, and infer operating systems using crafted probes. Scripting and automation features support recurring checks for devices, firewall rules, and exposure from the local network.
- +Fast port scanning with configurable timing and parallelism
- +Service detection fingerprints protocols on discovered open ports
- +OS detection helps identify devices behind unknown identities
- +NSE scripts add targeted checks like http-title and vuln checks
- –High verbosity can overwhelm results for nontechnical home users
- –Aggressive timing can trigger local firewall alerts or rate limiting
- –Interpretation of OS and service guesses can be inaccurate
- –Some NSE scripts can be risky to run on fragile routers
Best for: Home power users diagnosing device exposure and firewall behavior
PingPlotter
latency tracingContinuous ping and traceroute visualization to pinpoint where latency or packet loss occurs between the client and destination.
Real-time hop chart with packet loss and latency per router hop
PingPlotter specializes in continuous path tracing using live ICMP latency graphs, not one-time diagnostics. It displays hop-by-hop results so home users can pinpoint whether packet loss and delay occur on the router, ISP handoff, or farther nodes.
The tool supports exporting and saving test sessions for later review and comparison across multiple runs. Annotations and interface details make it practical to track intermittent issues that change over time.
- +Live hop-by-hop latency and loss graphs reveal where problems start along the path.
- +Continuous tracking helps catch intermittent spikes that short tests miss.
- +Session saving and export support sharing results with support or for later comparison.
- –ICMP-focused results may not match issues affecting TCP or DNS traffic.
- –Hop-level interpretation can overwhelm users without basic networking familiarity.
- –Heavy real-time graphs can be distracting during multi-device troubleshooting.
Best for: Home users troubleshooting intermittent latency, jitter, and packet loss on specific paths
MTR
path diagnosticsPath diagnostics that combine traceroute and ping to reveal where loss and latency build up across hops.
Automated diagnostic workflow that collects step results for isolation of common home network failures
MTR focuses on automated home network troubleshooting using scripted diagnostics and guided collection of evidence for common failure causes. It can evaluate routing and path health by running network checks and surfacing pass or fail signals from each step.
Outputs are designed to support faster problem isolation across DNS, connectivity, and reachability checks. It is best used as a repeatable troubleshooting runbook rather than an interactive monitoring dashboard.
- +Scripted diagnostics for consistent, repeatable troubleshooting runs
- +Step-by-step checks help isolate DNS and reachability issues
- +Evidence-focused output supports faster root-cause narrowing
- +Works well for documenting problems across multiple attempts
- –Less suited for continuous monitoring and alerting
- –Troubleshooting results still require user interpretation
- –Limited visualization compared to full network management tools
- –Automation depends on the correctness of environment assumptions
Best for: Home users needing repeatable network fault isolation for support tickets
GlassWire
traffic monitoringVisual bandwidth monitoring and connection tracking to surface unexpected traffic and isolate connectivity causes.
Connection history timeline with per-app breakdown and new connection alerts
GlassWire stands out with network traffic visibility built around easy-to-read charts and timeline views for home troubleshooting. It tracks inbound and outbound connections per app and highlights sudden network activity changes over time.
The app can alert users when specific apps start using the network and when unknown activity appears. It also supports DNS resolution and lets users inspect connection details to pinpoint where traffic originates.
- +Timeline charts make network spikes easy to trace
- +Per-app connection tracking clarifies which program sent traffic
- +Custom alerts notify on new or unusual outbound activity
- +Connection details include IP, port, and protocol
- –Focused primarily on the local machine, not full router-level topology
- –Deep device-to-device analysis requires manual interpretation
- –Large home networks can produce noisy alert volume
- –Geolocation and threat labeling are limited compared with dedicated security suites
Best for: Home users diagnosing PC network issues without complex networking tools
Fing
network discoveryDevice discovery and network scanning to identify connected clients, router issues, and potential configuration problems.
New device and change alerts built on recurring network discovery scans
Fing stands out by turning passive device discovery into a fast, action-oriented home network troubleshooting view. It scans local networks to list devices, capture device details, and highlight unexpected or unknown items.
The tool supports connectivity checks to validate reachability and pinpoint common issues like offline devices or misconfigured hosts. Fing also surfaces changes over time so troubleshooting can start from what recently changed rather than from guesswork.
- +Quick device discovery with clear labeling for local network troubleshooting
- +Identifies unknown or suspicious devices using availability and fingerprint details
- +Tracks new or changed devices to focus troubleshooting on recent events
- +Connectivity checks help confirm whether specific hosts respond
- –Depth of troubleshooting depends on device responsiveness and local network visibility
- –Limited diagnostics for router-level issues beyond reachability and inventory
Best for: Home users needing fast visibility into devices and changes for troubleshooting
PRTG Network Monitor
monitoring suiteDevice and network monitoring sensors that track reachability, bandwidth, and service responsiveness for troubleshooting.
Auto-discovery plus sensor-based monitoring with threshold alerting and network maps
PRTG Network Monitor stands out for turning a small home network into a measurable monitoring lab with one dashboard. It uses device discovery plus sensor-based monitoring for ping, SNMP, and port checks to pinpoint where latency or outages start.
Alerting can trigger notifications based on thresholds, so issues get surfaced before a full failure impacts streaming or work. Network maps and graphs help correlate device health with router and ISP behavior during troubleshooting.
- +Sensor-based monitoring covers ping, SNMP, and port status for fast isolation.
- +Auto-discovery rapidly builds a live home device inventory.
- +Threshold alerts notify promptly when latency or connectivity degrades.
- +Dashboards and graphs show trends for diagnosing intermittent issues.
- –Configuration requires careful sensor and alert tuning to reduce noise.
- –Home setups with many devices can lead to heavy sensor counts.
- –SNMP monitoring depends on correct configuration on each device.
- –Alert routing can feel complex compared with simple home tools.
Best for: Home power users needing detailed network visibility and actionable alerts
LibreNMS
SNMP monitoringSNMP-based monitoring and alerting that helps troubleshoot router, switch, and WAN health with time-series visibility.
Port and device alerting with detailed interface counters and state changes
LibreNMS stands out for deep SNMP-driven monitoring that maps real network health into actionable device and interface metrics. It collects status, traffic, and errors across routers, switches, and firewalls using SNMP and standard device telemetry.
Dashboards highlight top talkers, port-level anomalies, and health state changes that help isolate failure points. Alerting routes issues to notification channels to speed up troubleshooting and reduce repeat incidents.
- +SNMP polling provides detailed per-interface status, counters, and error visibility
- +Graphing and dashboards highlight top bandwidth users and abnormal traffic patterns
- +Device and port health state changes support quick root-cause isolation
- +Alerting sends actionable notifications for outages and threshold breaches
- –Requires careful SNMP configuration for reliable data collection
- –Complex environments can need tuning for polling intervals and thresholds
- –Web UI performance can degrade with very large device fleets
- –Troubleshooting complex baselines may require custom thresholds and dashboards
Best for: Home enthusiasts needing actionable SNMP monitoring and alert-driven troubleshooting
Zabbix
monitoring platformAgent and agentless monitoring with triggers and dashboards to troubleshoot connectivity and service outages.
Event-driven trigger logic with history-based graphs and automated alert actions
Zabbix stands out with server-based monitoring that turns home network problems into time-series data with automated alerting. It collects device and service metrics via SNMP and agent checks, then correlates thresholds, availability, and response timing.
Dashboards and screens support fast triage for routers, switches, Wi-Fi controllers, and critical hosts by tracking history and loss trends. Map views help visualize connectivity paths so failures can be traced across segments quickly.
- +SNMP polling and agent checks cover routers, switches, and endpoints
- +Alerting supports event correlation and suppression to reduce alert noise
- +Historical graphs expose packet loss and latency trends over time
- +Dashboards and map views speed troubleshooting across network segments
- –Setup and tuning require strong understanding of monitoring concepts
- –Alert tuning can become complex for dynamic home networks
- –UI can feel heavy with large numbers of monitored devices
- –Automated root-cause analysis requires careful trigger design
Best for: Power users and enthusiasts troubleshooting multi-device home networks
Prometheus
metrics monitoringMetrics collection and alerting to monitor network and service health using exporters and time-series queries.
PromQL for deep, label-based time-series queries across multiple monitored devices
Prometheus stands out for collecting time-series metrics with a pull-based data model using an HTTP endpoint. It excels at monitoring home network components like routers, switches, and servers via exporters.
It helps troubleshoot intermittent issues using long-term metric storage, alerting rules, and query-driven dashboards. Visual answers come from integrating with Grafana for panels and from alert notifications for fast investigation.
- +Pull-based scraping works reliably with standard exporter HTTP endpoints
- +Powerful PromQL enables precise queries on latency, errors, and utilization
- +Alerting rules support routing by labels for targeted responses
- +Long-term metrics storage supports trend and baseline comparisons
- –Requires deploying exporters for most home network devices
- –Setup and tuning can feel complex for non-technical troubleshooting
- –Not an end-to-end network diagnostics tool by itself
- –Grafana integration is needed for most useful visualization workflows
Best for: Home users monitoring network health with metrics dashboards and alerts
How to Choose the Right Home Network Troubleshooting Software
This buyer’s guide covers how to choose home network troubleshooting software across deep packet inspection, path tracing, device discovery, and monitoring dashboards. It references Wireshark, Nmap, PingPlotter, MTR, GlassWire, Fing, PRTG Network Monitor, LibreNMS, Zabbix, and Prometheus. Each tool maps to concrete troubleshooting workflows for Wi-Fi, routing, DNS, device changes, and service reachability.
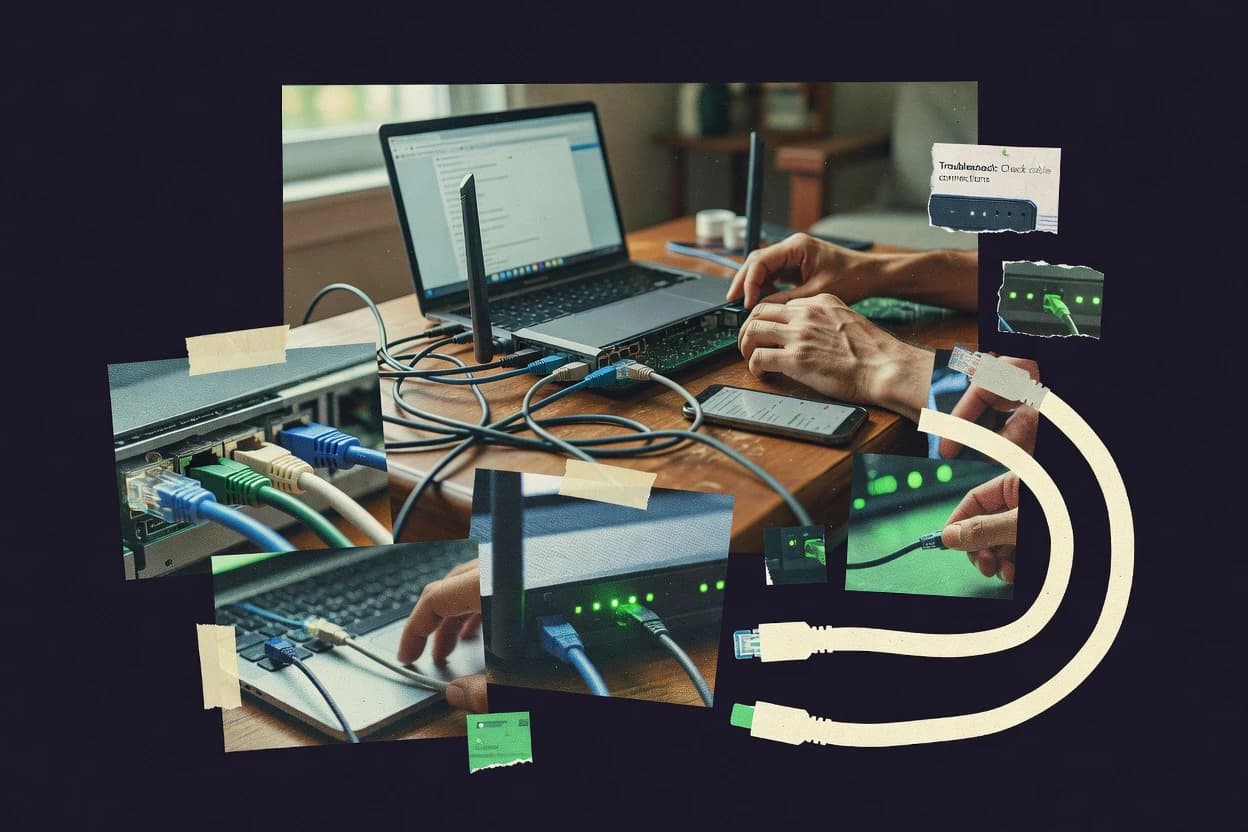
What Is Home Network Troubleshooting Software?
Home network troubleshooting software helps identify why devices on a LAN have issues like slow browsing, failed connections, intermittent latency, missing DNS resolution, or unexpected traffic. These tools either inspect network traffic directly, map the path between hops, discover devices and changes, or monitor reachability and service responsiveness over time. Wireshark and Nmap focus on protocol-aware packet and service discovery evidence. PingPlotter and MTR focus on pinpointing where latency or loss starts using hop-by-hop and repeatable diagnostic runs.
Key Features to Look For
The fastest diagnosis comes from matching tool output to the specific failure mode seen on the home network.
Protocol-aware packet timelines with display filters
Wireshark turns raw traffic into a searchable protocol-aware timeline with display filters that isolate DNS, DHCP, TCP resets, and retransmissions. This matters because slow browsing, failing logins, and unstable connectivity often show up as name resolution failures and session resets inside captured packets.
Service discovery and host exposure scanning with scripting
Nmap identifies open ports, detects services, and runs OS detection using crafted probes. NSE scripting supports targeted checks like http-title and other diagnostics, which helps when the problem is device exposure or a firewall behavior mismatch.
Real-time hop-by-hop latency and packet loss visualization
PingPlotter provides a live traceroute chart that shows packet loss and latency per router hop. This matters for intermittent jitter and packet loss because short one-time tests can miss spikes that only appear on specific hops.
Repeatable guided diagnostic workflows for common failures
MTR focuses on automated path diagnostics that combine traceroute and ping and produce step-oriented evidence for isolation. This matters for support tickets because consistent step results document where DNS and reachability checks fail across attempts.
Connection history tracking tied to apps on the local device
GlassWire tracks inbound and outbound connections per app and highlights sudden network activity changes over time. This matters when the primary issue is a PC-side connectivity problem because connection details show IP, port, and protocol for suspicious or unexpected activity.
Device inventory with new device and change alerts
Fing runs recurring network discovery scans to list devices and trigger alerts for new or changed items. This matters because many home troubleshooting starts after a recent change like adding a device, and Fing helps confirm whether the network inventory matches expectations.
SNMP-based monitoring with per-interface counters and state changes
LibreNMS uses SNMP polling to surface router, switch, firewall, and per-interface health with time-series visibility. This matters when issues correlate to interface errors or anomalies because dashboards and alerting route notifications based on port and device health state changes.
Sensor-based reachability and service monitoring with network maps
PRTG Network Monitor uses device discovery plus sensor-based monitoring for ping, SNMP, and port checks. This matters when faster isolation is needed across router, access point, and endpoint behavior because dashboards and network maps correlate health trends with the exact devices impacted.
Event-driven alerting with triggers and history-based graphs
Zabbix supports SNMP polling and agent checks and correlates thresholds with availability and response timing. This matters for multi-device troubleshooting because history-based graphs expose packet loss and latency trends and trigger logic can target service reachability like DNS and HTTP.
Long-term time-series metrics and query-driven investigation
Prometheus collects time-series metrics using pull-based scraping and supports deep label-based time-series queries with PromQL. This matters for intermittent problems because long-term metrics storage enables baseline comparisons and alert rules provide label-based routing for targeted investigation.
How to Choose the Right Home Network Troubleshooting Software
Selection should start with the failure pattern and then match it to the tool class that produces evidence for that pattern.
Match the tool to the symptom type
Use Wireshark when the symptom looks like a protocol failure such as DNS issues, DHCP problems, TCP resets, retransmissions, or TLS connection negotiation failures. Use PingPlotter or MTR when the symptom is intermittent latency, jitter, or packet loss because both focus on hop behavior and path evidence rather than device-only inventory.
Choose the right evidence level: packets, paths, or devices
Wireshark produces protocol-aware packet evidence via display filters and TCP stream reconstruction, which helps pinpoint root causes inside a conversation. Fing and Nmap shift evidence to devices and exposure by discovering connected clients and scanning open services, which helps when the main question is who is present or what ports are reachable.
Plan for intermittent issues and repeatable runs
Use PingPlotter when intermittent spikes must be captured in real time with a hop-level loss and latency chart. Use MTR when the goal is a repeatable diagnostic runbook that collects step results for DNS and reachability isolation that can be compared across attempts.
Add monitoring only when ongoing visibility is needed
Use GlassWire when troubleshooting centers on unexpected activity from a specific app on the local PC and when connection history timelines help show sudden changes. Use PRTG Network Monitor, LibreNMS, Zabbix, or Prometheus when ongoing monitoring with threshold alerts and time-series trends is required for multiple devices.
Use the most actionable alerting model for the network size
Use LibreNMS for SNMP-driven per-interface alerting with detailed interface counters and health state changes. Use Zabbix for event-driven trigger logic with history-based graphs that correlate service reachability like DNS and HTTP. Use Prometheus for query-driven investigations across many metrics when integrating dashboards and alerts with Grafana workflows is already part of the troubleshooting process.
Who Needs Home Network Troubleshooting Software?
Different home networks need different kinds of evidence, so the right tool choice depends on where problems show up first.
Home users and techs diagnosing Wi-Fi, router, and device connectivity issues
Wireshark fits this segment because protocol dissectors and display filters isolate DNS, DHCP, TCP resets, and retransmissions from captured traffic. Nmap also fits when exposure or open services must be identified quickly with service detection and NSE scripting probes.
Home users troubleshooting intermittent latency, jitter, and packet loss on specific routes
PingPlotter fits this segment because it provides a real-time hop chart with packet loss and latency per router hop. MTR fits when a repeatable diagnostic workflow is needed to isolate reachability and DNS failures with step outputs suitable for sharing evidence.
Home users diagnosing PC network issues caused by unexpected local app behavior
GlassWire fits because it tracks inbound and outbound connections per app and highlights sudden network activity changes with connection details including IP, port, and protocol. Fing fits when the PC issue coincides with unexpected device changes on the LAN and confirming new or changed devices becomes the first troubleshooting step.
Home enthusiasts needing actionable SNMP monitoring and alert-driven troubleshooting across routers and switches
LibreNMS fits because SNMP polling creates dashboards with port-level anomalies, error visibility, and alerting routed on health state changes. PRTG Network Monitor fits because auto-discovery plus sensor-based monitoring for ping, SNMP, and port checks supports threshold alerts and network maps.
Common Mistakes to Avoid
Home network troubleshooting breaks down when the tool output does not align with the symptom and when results are interpreted without the right context.
Using packet-level tooling without planning capture setup
Wireshark can confuse non-technical home users because interface selection and capture setup can be difficult before evidence appears. PingPlotter avoids capture setup complexity by focusing on continuous hop graphs, which makes it more practical for intermittent path issues.
Running aggressive scans without controlling scope
Nmap can overwhelm or confuse nontechnical users due to high verbosity, and aggressive timing can trigger local firewall alerts or rate limiting. Fing and GlassWire reduce that risk by operating on device discovery changes and per-app connection timelines rather than scanning ports.
Assuming ICMP results represent every traffic problem
PingPlotter’s ICMP-focused results can miss issues that primarily affect TCP or DNS traffic. Wireshark helps bridge that gap by capturing DNS resolution and TCP behavior in protocol-aware packet evidence.
Treating monitoring dashboards as a substitute for troubleshooting evidence
LibreNMS, Zabbix, and Prometheus excel at monitoring but still require investigation because alerting highlights symptoms like threshold breaches, not exact root causes. Wireshark or MTR provides the deeper evidence for where failures happen, including per-hop behavior and protocol-specific packet details.
How We Selected and Ranked These Tools
we evaluated every tool on three sub-dimensions. Features account for 0.4 of the overall score. Ease of use accounts for 0.3 of the overall score. Value accounts for 0.3 of the overall score, and the overall rating is the weighted average computed as overall = 0.40 × features + 0.30 × ease of use + 0.30 × value. Wireshark separated from lower-ranked tools with the feature dimension by combining protocol-aware display filters with TCP stream reconstruction, which turns packet captures into quickly searchable protocol evidence for DNS, DHCP, TLS, retransmissions, and TCP resets.
Frequently Asked Questions About Home Network Troubleshooting Software
Which tool best captures and pinpoints DNS and TCP problems during slow browsing?
What software can discover exposed ports and services on a home network repeatedly?
Which tool is designed for intermittent latency and jitter troubleshooting with hop-by-hop visibility?
Which option produces repeatable diagnostic evidence for support tickets at home?
Which tool helps track which apps are generating new inbound and outbound connections on a PC?
How can device discovery identify unknown or newly added devices on the LAN?
What monitoring approach works best for alerting on router and device failures before streaming or work breaks?
Which tool is strongest for SNMP-driven interface-level anomaly detection on switches and routers?
What tool stores long-term network behavior history and supports automated alerting for multi-device homes?
How can metrics and dashboards be used together to investigate intermittent home network issues over time?
Conclusion
After evaluating 10 telecommunications connectivity, Wireshark stands out as our overall top pick — it scored highest across our combined criteria of features, ease of use, and value, which is why it sits at #1 in the rankings above.
Use the comparison table and detailed reviews above to validate the fit against your own requirements before committing to a tool.
Tools reviewed
Primary sources checked during evaluation.
Referenced in the comparison table and product reviews above.
Keep exploring
Comparing two specific tools?
Software Alternatives
See head-to-head software comparisons with feature breakdowns, pricing, and our recommendation for each use case.
Explore software alternatives→In this category
Telecommunications Connectivity alternatives
See side-by-side comparisons of telecommunications connectivity tools and pick the right one for your stack.
Compare telecommunications connectivity tools→FOR SOFTWARE VENDORS
Not on this list? Let’s fix that.
Our best-of pages are how many teams discover and compare tools in this space. If you think your product belongs in this lineup, we’d like to hear from you—we’ll walk you through fit and what an editorial entry looks like.
Apply for a ListingWHAT THIS INCLUDES
Where buyers compare
Readers come to these pages to shortlist software—your product shows up in that moment, not in a random sidebar.
Editorial write-up
We describe your product in our own words and check the facts before anything goes live.
On-page brand presence
You appear in the roundup the same way as other tools we cover: name, positioning, and a clear next step for readers who want to learn more.
Kept up to date
We refresh lists on a regular rhythm so the category page stays useful as products and pricing change.