GITNUXSOFTWARE ADVICE
Science ResearchTop 10 Best Graphing Software of 2026
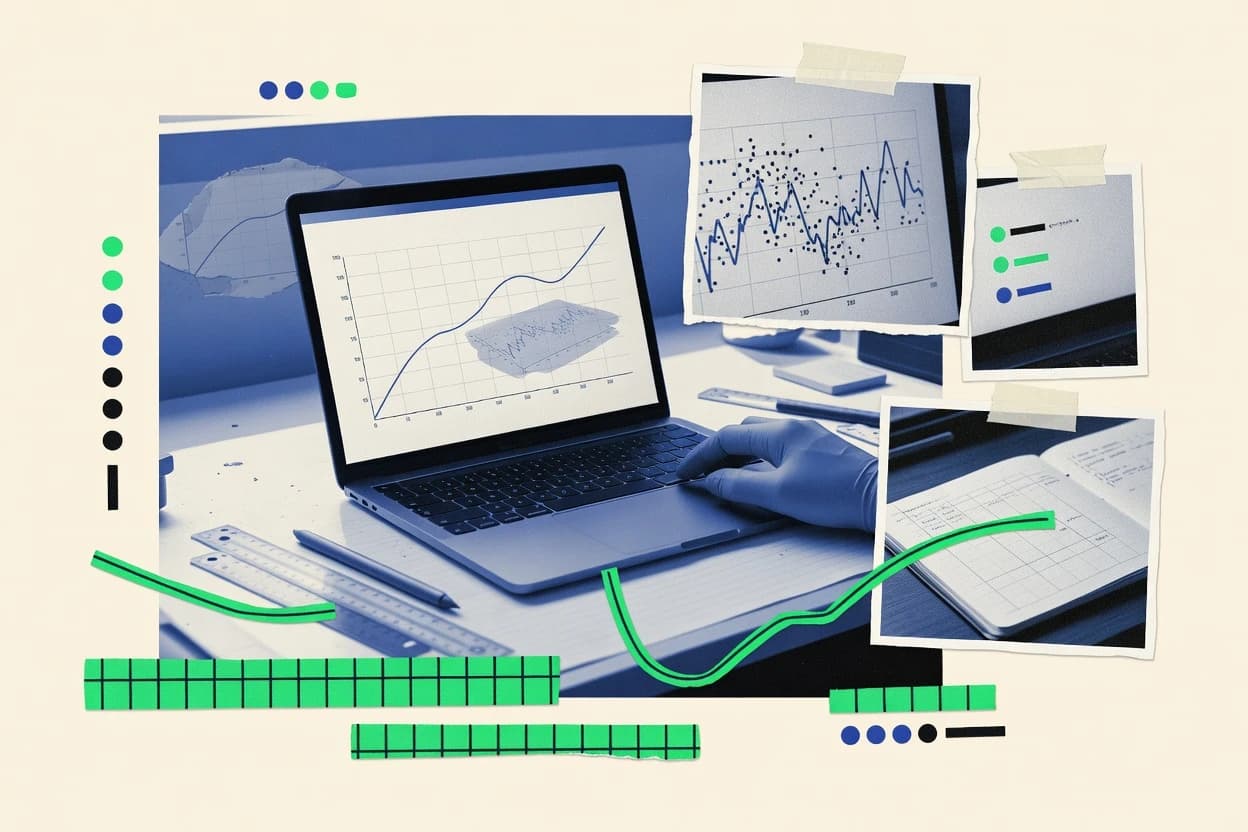
Top 10 Graphing Software picks ranked and compared for data visualization. Explore MATLAB, Matplotlib, Plotly and more options.

How we ranked these tools
Core product claims cross-referenced against official documentation, changelogs, and independent technical reviews.
Analyzed video reviews and hundreds of written evaluations to capture real-world user experiences with each tool.
AI persona simulations modeled how different user types would experience each tool across common use cases and workflows.
Final rankings reviewed and approved by our editorial team with authority to override AI-generated scores based on domain expertise.
Score: Features 40% · Ease 30% · Value 30%
Gitnux may earn a commission through links on this page — this does not influence rankings. Editorial policy
Editor’s top 3 picks
Three quick recommendations before you dive into the full comparison below — each one leads on a different dimension.
MATLAB
Graphics handles with property-based customization of every chart element
Built for teams needing programmatic scientific plotting and analysis-driven visualization.
Python Matplotlib
Editor pickObject-oriented Figure and Axes API with fine layout control
Built for researchers and engineers generating repeatable charts from Python data.
Python Plotly
Editor pickplotly.graph_objects and Plotly Express figures with interactive hover, zoom, and pan
Built for data teams needing interactive charts in Python notebooks or web pages.
Related reading
Comparison Table
This comparison table evaluates graphing and visualization tools used for scientific and engineering plots, from MATLAB and GNU Octave to Python libraries like Matplotlib, Plotly, and Seaborn. Readers can scan key differences in workflow, styling control, interactivity, and output formats to match each tool to specific plotting needs.
MATLAB
scientific computingInteractive scientific plotting and graph customization in MATLAB for research workflows and figure export.
Graphics handles with property-based customization of every chart element
MATLAB stands out for graphing that stays tightly coupled to computation, analysis, and custom scripting. High-quality 2D and 3D plotting covers time series, surface and contour visualization, and publication-oriented formatting.
Interactive figure tools support exploration with zooming, data tips, legends, and linked views across multiple axes. The same environment enables exporting figures for reports and automated generation of plots from scripts.
- +Scriptable figure creation with full access to plotting parameters
- +Strong 2D and 3D visualization for functions, signals, and matrices
- +Publication-ready styling with precise control of axes, labels, and typography
- +Interactive figure tools support zooming, data tips, and linked annotations
- +Integrates plotting directly with MATLAB computations and data processing
- –Figure customization can require detailed MATLAB graphics knowledge
- –Large interactive figures can become slow with heavy datasets
- –Some web-style interactive sharing workflows need extra tooling
Best for: Teams needing programmatic scientific plotting and analysis-driven visualization
Python Matplotlib
code-driven chartsScriptable plotting library that produces highly configurable graphs for data science and scientific research.
Object-oriented Figure and Axes API with fine layout control
Matplotlib stands out for turning Python code directly into publication-ready plots with fine-grained control. It supports common chart types like line, scatter, bar, histogram, and box plots through a consistent pyplot and object-oriented API.
Rendering pipelines allow saved images in multiple formats and interactive exploration via backends for common environments. Extensive styling and annotation utilities make it suitable for generating consistent figures across scripts and projects.
- +High control over axes, ticks, labels, and figure layout
- +Wide chart coverage including histograms and statistical plots
- +Backend support for both static exports and interactive viewing
- +Reusable styling via themes and rcParams settings
- –Workflow can get verbose for complex figure arrangements
- –Interactive dashboards require extra libraries beyond Matplotlib
- –Large datasets can slow down without careful downsampling
- –Manual tuning is often needed for multi-plot alignment
Best for: Researchers and engineers generating repeatable charts from Python data
Python Plotly
interactive dashboardsInteractive charting tools that support publication and dashboards with exportable figures.
plotly.graph_objects and Plotly Express figures with interactive hover, zoom, and pan
Python Plotly stands out for producing interactive, browser-ready charts directly from Python code. It supports scatter, line, bar, heatmap, and 3D graph types with consistent styling controls.
Layout and theming options let figures share axes, grids, and hover behavior across dashboards. Export tooling supports static images and web embedding for reports and presentations.
- +Interactive hover and zoom built into every Plotly figure
- +Broad chart coverage includes heatmaps and 3D plots
- +Unified Python API for consistent styling and layout control
- –Large datasets can slow rendering and interactivity
- –Complex dashboards require careful layout management
- –Embedding can increase output size for high-fidelity charts
Best for: Data teams needing interactive charts in Python notebooks or web pages
Python Seaborn
statistical plotsHigh-level statistical plotting built on Matplotlib that standardizes styling for research graphics.
FacetGrid for automated faceting across multiple variables in a single command
Python Seaborn stands out by providing high-level statistical plotting built on top of Matplotlib. It generates publication-style charts with automatic styling, readable defaults, and concise APIs.
Core capabilities include categorical plots like bar, box, violin, and strip, plus regression and distribution visuals such as lmplot, regplot, and pairplot. It also supports multi-figure layouts through FacetGrid and integrates directly with pandas DataFrame structures.
- +Statistical plot functions like regplot and lmplot simplify modeling visuals
- +FacetGrid enables faceted small multiples from DataFrame columns
- +Pairplot and distribution plots speed up exploratory correlation checks
- –Customization often requires manual Matplotlib calls for fine control
- –Very complex layouts need lower-level Matplotlib workarounds
- –Long formulas for wide DataFrames can create cluttered plots
Best for: Data analysts needing concise, statistical-ready charts from pandas data
GNU Octave
open-source numericsOpen-source numerical computing with plotting commands for 2D and 3D scientific graphs.
MATLAB-compatible plotting API and batch scripts for generating figures from computations
GNU Octave stands out as a MATLAB-compatible environment for numerical computation and plotting. It supports interactive plotting, matrix operations, and script-based workflows for repeatable graph generation.
Built-in functions cover common 2D and 3D chart types, including axes customization, legends, and exported figures. When used with signal, control, and statistics toolboxes, it covers many analysis-to-visualization pipelines without switching tools.
- +MATLAB-compatible syntax lowers migration friction for existing numerical code
- +Interactive plotting with scriptable commands enables repeatable figure generation
- +Rich 2D and 3D graphing with axes control, labels, and legends
- +Vectorized matrix operations accelerate data prep before plotting
- +Supports exporting figures for documentation and reporting workflows
- –Graph styling automation can feel less flexible than GUI-centric tools
- –Large interactive datasets may redraw slowly in some setups
- –Tooling ecosystem relies on external packages for advanced visualization needs
Best for: Engineers and researchers plotting numerical results from MATLAB-style scripts
R ggplot2
grammar of graphicsGrammar of graphics system in R that generates layered, publication-focused scientific plots.
Facet-based small multiples using facet_grid and facet_wrap
R ggplot2 stands out for producing consistent statistical graphics using a declarative layered syntax. It supports common plot types like scatter, line, bar, histogram, boxplot, and faceting with a grammar of graphics.
Themes and scales let teams tune typography, colors, legends, and axis formatting across many charts. Integration with the tidyverse workflow makes data reshaping and plotting pipelines efficient for scripted reporting.
- +Layered grammar enables fine control over plot components
- +Faceting creates small multiples from a single data set
- +Theming and scale functions standardize styling across charts
- +Tight fit with tidyverse data pipelines using dplyr and tidyr
- –Fine-grained interactivity requires additional packages outside ggplot2
- –Complex annotations can become verbose in layered code
- –Rendering large data sets can slow due to repeated layer computation
- –GUI-based chart editing is not provided within ggplot2 itself
Best for: Analytics teams generating publication-ready statistical plots via R code
R Shiny
interactive visualization appsFramework for building interactive scientific visualization apps with R-powered reactive graphs.
Reactive programming with renderPlot and reactive expressions for live chart updates
R Shiny delivers interactive, web-based graphing built from R scripts. It supports reactive plots, dynamic filtering, and user-driven updates through Shiny apps.
Visualization output integrates with popular R plotting libraries like ggplot2 and interactive chart packages. Deployment options enable sharing dashboards to internal teams or public users without reworking the underlying analytics code.
- +Reactive plotting updates graphs instantly from user inputs
- +Deep R integration enables use of ggplot2 and established data tooling
- +Modular UI components speed dashboard assembly
- +Accessible interactivity via sliders, selectors, and tables
- –Graph performance can degrade with large datasets
- –Complex dashboards require careful reactive dependency design
- –Front-end customization can be limited versus full UI frameworks
- –Maintaining app state across sessions can be nontrivial
Best for: Data teams building interactive R-based dashboards for internal decision workflows
Python Bokeh
browser visualizationWeb-ready interactive plotting for scientific data that supports streaming and browser-based rendering.
Bokeh server document updates for real-time streaming and interactive widgets
Python Bokeh focuses on interactive, browser-based data visualization generated from Python code. It supports high-level plotting and lower-level control with document and model building blocks.
Charts can include pan, zoom, hover tooltips, and linked selections that update across multiple views. Export options include embedding in web pages and saving standalone HTML with the JavaScript runtime bundled.
- +Rich interactivity with pan zoom, hover tools, and linked selections
- +Full Python-first API builds HTML and JavaScript visualization documents
- +Supports server-side dashboards with streaming and interactive widgets
- +Multiple renderers enable notebook output, web embedding, and static HTML
- –Complex custom layouts require deeper knowledge of Bokeh models
- –Large datasets can strain browser performance without downsampling
- –Complex responsive behavior takes manual configuration
- –Non-Python workflows require extra export or integration steps
Best for: Python teams building interactive plots and lightweight web visual analytics
LabPlot
open-source plottingFree and open-source scientific plotting tool supporting multi-curve graphs, fitting, and data import.
Integrated curve fitting inside the plotting workspace
LabPlot stands out by focusing on fast scientific plotting workflows for data analysis and visualization. It supports multi-panel plots, curve fitting, and data import for common lab formats.
Interactive tools like point selection, editing, and region-based operations help refine figures and measurements. Export options cover publication-ready output through vector and raster formats.
- +Scientific plotting workflow with editing and point-level interaction
- +Curve fitting tools for common modeling and parameter estimation
- +Multi-panel plots for comparing datasets in one figure
- +Publication export supports vector and raster outputs
- –Workflow can feel less scripted than notebook-style tools
- –Advanced chart customization requires deeper feature discovery
- –Large interactive datasets may need careful performance tuning
Best for: Researchers needing repeatable scientific plots with built-in analysis tools
Plotting in Jupyter Notebook with Plotly
notebook visualizationNotebook-based research environment that renders interactive scientific plots created with common plotting libraries.
Hover-driven interactivity with zoom and pan for plotly figures in Jupyter
Plotting in Jupyter Notebook with Plotly centers interactive charts inside the notebook workflow. It supports plot types like scatter, line, bar, heatmap, and 3D surfaces with hover tooltips and zoom.
It integrates cleanly with Python data handling in notebooks, enabling quick iteration from data wrangling to visualization. It also enables export of static images and shareable interactive outputs for downstream review.
- +Interactive hover tooltips improve inspection of dense datasets
- +Notebook-first workflow speeds the loop from data to visuals
- +Wide chart coverage includes 3D and heatmaps
- +Exportable static images support reports and slides
- +Works directly with pandas data frames
- –Large interactive plots can feel slow in-browser
- –Complex dashboards need extra layout and callback design
- –Theme and styling across many charts can be time-consuming
- –Sharing requires handling HTML outputs carefully
Best for: Data analysts building interactive notebook visualizations for exploration and sharing
How to Choose the Right Graphing Software
This buyer's guide explains how to choose graphing software for scientific plotting, statistical graphics, and interactive dashboards. It covers MATLAB, Python Matplotlib, Python Plotly, Python Seaborn, GNU Octave, R ggplot2, R Shiny, Python Bokeh, LabPlot, and Plotting in Jupyter Notebook with Plotly. Each section maps concrete capabilities like property-based chart customization and reactive rendering to the workflows that need them.
What Is Graphing Software?
Graphing software turns data into visual charts like line plots, scatter plots, histograms, heatmaps, and 3D surfaces. It solves problems like communicating analysis results, inspecting patterns with zoom and hover, and generating consistent figures for reports and documentation. Tools like MATLAB combine plotting with computation and scripted figure export, while Python Plotly focuses on interactive hover, zoom, and pan that works well in notebooks and web contexts. Many teams also use R ggplot2 and Python Seaborn for publication-style statistical plots generated from layered or high-level APIs.
Key Features to Look For
The right feature set determines whether a tool supports fast iteration, reproducible figures, and the kind of interactivity needed for real decision workflows.
Property-based control of every chart element
MATLAB exposes graphics handles with property-based customization for axes, labels, and figure elements, which enables publication-ready control. Python Matplotlib also provides a Figure and Axes object model for fine-grained layout and styling across complex plots.
Object-oriented layout control for repeatable figure construction
Python Matplotlib’s object-oriented Figure and Axes API supports consistent alignment of ticks, labels, and subplots across scripts. MATLAB delivers similar repeatability by linking plotting parameters directly to computations and scripted workflows.
Interactive hover, zoom, and pan built into the plotting model
Python Plotly integrates interactive hover, zoom, and pan across Plotly Express and plotly.graph_objects figures. Plotting in Jupyter Notebook with Plotly keeps the same interactive inspection workflow inside notebook output for fast exploration.
Faceted small multiples from a single data set
R ggplot2 supports facet-based small multiples using facet_grid and facet_wrap, which standardizes comparisons across categories. Python Seaborn provides FacetGrid to generate multiple panels from pandas DataFrame columns with concise commands.
Reactive rendering for live, user-driven chart updates
R Shiny uses reactive programming with renderPlot and reactive expressions to update graphs instantly from user inputs. This matches interactive analysis workflows where sliders, selectors, and tables drive the plot state.
Streaming and linked selections for browser-based interactivity
Python Bokeh supports interactive pan, zoom, hover tools, and linked selections that update across multiple views. Bokeh server document updates enable real-time streaming and interactive widgets without changing the Python-first development flow.
How to Choose the Right Graphing Software
A practical way to pick the right tool is to match plotting control needs and interactivity requirements to the execution environment that already exists in the team workflow.
Start with the environment that drives the data work
If plotting must stay tightly coupled to computation and scripted figure generation, MATLAB fits because it integrates interactive exploration with automated plot creation from scripts. If data work happens in Python notebooks or Python scripts, Python Matplotlib provides configurable static and interactive backends, while Python Plotly supports browser-ready interactive charts from Python code.
Decide whether charts are for static publication or interactive exploration
For publication-oriented scientific figures with precise control over typography and axes styling, MATLAB and Python Matplotlib excel because they support detailed control over chart element properties. For interactive inspection where hover tooltips and zoom help users explore dense points, Python Plotly and Plotting in Jupyter Notebook with Plotly provide built-in hover, zoom, and pan.
Choose the modeling and statistical workflow style
For layered statistical graphics with a grammar of graphics approach, R ggplot2 supports faceting and theming through declarative layers. For concise statistical plot functions built on top of Matplotlib that integrate directly with pandas DataFrames, Python Seaborn offers regression visuals like regplot and lmplot and FacetGrid for small multiples.
Plan for dashboard or app interactivity requirements
If the requirement is reactive dashboards built in R with live updates from user inputs, R Shiny delivers reactive plot updates with renderPlot and reactive expressions. If the requirement is Python-first web visual analytics with pan, zoom, hover, and linked selections, Python Bokeh supports browser-based interactivity and can stream updates through Bokeh server documents.
Validate workflow fit for lab and analysis tooling
For scientific plotting with built-in curve fitting and point-level editing inside the plotting workspace, LabPlot provides integrated curve fitting plus multi-panel plotting and publication export. For MATLAB-style numerical computing pipelines and script-based repeatable graph generation, GNU Octave provides MATLAB-compatible plotting commands and batch scripts.
Who Needs Graphing Software?
Graphing software fits teams that need reliable chart creation, consistent styling across many figures, and either interactive inspection or interactive app behavior.
Teams needing programmatic scientific plotting tied to computation
MATLAB suits teams that want interactive figure tools plus scripted figure export from the same environment because graphics handles enable property-based customization of every chart element. GNU Octave also supports MATLAB-compatible plotting commands and batch scripts for repeatable scientific figure generation.
Researchers and engineers generating repeatable charts from Python data
Python Matplotlib is the right match for engineers and researchers who need reusable styling and fine-grained control over axes, ticks, and figure layout through the object-oriented Figure and Axes API. Python Plotly is a better fit when the same Python workflow must produce interactive hover, zoom, and pan for notebooks or web embedding.
Data analysts producing statistical graphics from pandas or R pipelines
Python Seaborn fits analysts who want concise statistical plot functions like regplot and lmplot tied to pandas DataFrames and standardized publication-style defaults. R ggplot2 fits analytics teams that prefer declarative, layered grammar of graphics and consistent faceting with facet_grid or facet_wrap.
Data teams building interactive dashboards and web-based analytics
R Shiny fits teams building interactive R-based dashboards where renderPlot and reactive expressions drive live plot updates from UI inputs. Python Bokeh fits Python teams that want browser-ready interactivity with pan, zoom, hover, linked selections, and optional real-time streaming through Bokeh server document updates.
Common Mistakes to Avoid
Common selection errors usually happen when teams choose tools that match chart aesthetics but not the workflow required for interaction, reproducibility, or layout complexity.
Picking a plotting library without a plan for complex layout control
Python Matplotlib can become verbose for complex figure arrangements even though it delivers high control through Figure and Axes objects, so teams should plan figure structure early. MATLAB provides property-based customization via graphics handles, which reduces rework when fine control of axes, labels, and typography is required.
Assuming interactive dashboards will perform well with large datasets out of the box
Python Plotly can slow down when datasets are large because it builds interactive rendering for hover and zoom. R Shiny and Python Bokeh can also experience performance degradation with large datasets due to reactive updates and browser rendering limits.
Relying on high-level statistical defaults when deeper annotations are required
Python Seaborn produces publication-style charts quickly, but complex customization often needs manual Matplotlib calls for fine control. R ggplot2 supports complex annotations through layered code, but verbose layer construction can slow down workflows when annotations get complicated.
Choosing notebook interactivity for production app workflows without app-specific tooling
Plotting in Jupyter Notebook with Plotly is optimized for notebook exploration and export of static images and shareable outputs, but complex app behavior requires additional layout and callback design. R Shiny and Python Bokeh provide app-first or server-capable interactivity through reactive rendering and Bokeh server document updates.
How We Selected and Ranked These Tools
We evaluated every tool on three sub-dimensions. Features carry weight 0.4, ease of use carries weight 0.3, and value carries weight 0.3. The overall rating is calculated as overall = 0.40 × features + 0.30 × ease of use + 0.30 × value. MATLAB separated itself from lower-ranked tools on the features dimension because its graphics handles enable property-based customization of every chart element while staying integrated with computations and automated figure generation from scripts.
Frequently Asked Questions About Graphing Software
Which graphing tool is best for computation-linked plotting without switching environments?
What is the main difference between Matplotlib and Seaborn for producing publication-ready plots?
Which tool should be chosen for interactive browser-ready charts from Python?
Which options support dashboard-style interactivity with consistent axes and shared styling?
Which tool is better for declarative statistical graphics with layered syntax in R?
Which graphing software is suited for scientific workflows like curve fitting and multi-panel lab figures?
How do Jupyter Notebook workflows differ when using Plotly versus Matplotlib?
Which tool set handles 3D visualization and surfaces more directly from code?
What integration path works best for teams already using pandas or tidyverse data pipelines?
Conclusion
After evaluating 10 science research, MATLAB stands out as our overall top pick — it scored highest across our combined criteria of features, ease of use, and value, which is why it sits at #1 in the rankings above.
Use the comparison table and detailed reviews above to validate the fit against your own requirements before committing to a tool.
Tools reviewed
Primary sources checked during evaluation.
Referenced in the comparison table and product reviews above.
Keep exploring
Comparing two specific tools?
Software Alternatives
See head-to-head software comparisons with feature breakdowns, pricing, and our recommendation for each use case.
Explore software alternatives→In this category
Science Research alternatives
See side-by-side comparisons of science research tools and pick the right one for your stack.
Compare science research tools→FOR SOFTWARE VENDORS
Not on this list? Let’s fix that.
Our best-of pages are how many teams discover and compare tools in this space. If you think your product belongs in this lineup, we’d like to hear from you—we’ll walk you through fit and what an editorial entry looks like.
Apply for a ListingWHAT THIS INCLUDES
Where buyers compare
Readers come to these pages to shortlist software—your product shows up in that moment, not in a random sidebar.
Editorial write-up
We describe your product in our own words and check the facts before anything goes live.
On-page brand presence
You appear in the roundup the same way as other tools we cover: name, positioning, and a clear next step for readers who want to learn more.
Kept up to date
We refresh lists on a regular rhythm so the category page stays useful as products and pricing change.