GITNUXSOFTWARE ADVICE
Technology Digital MediaTop 10 Best Graphics Card Monitoring Software of 2026
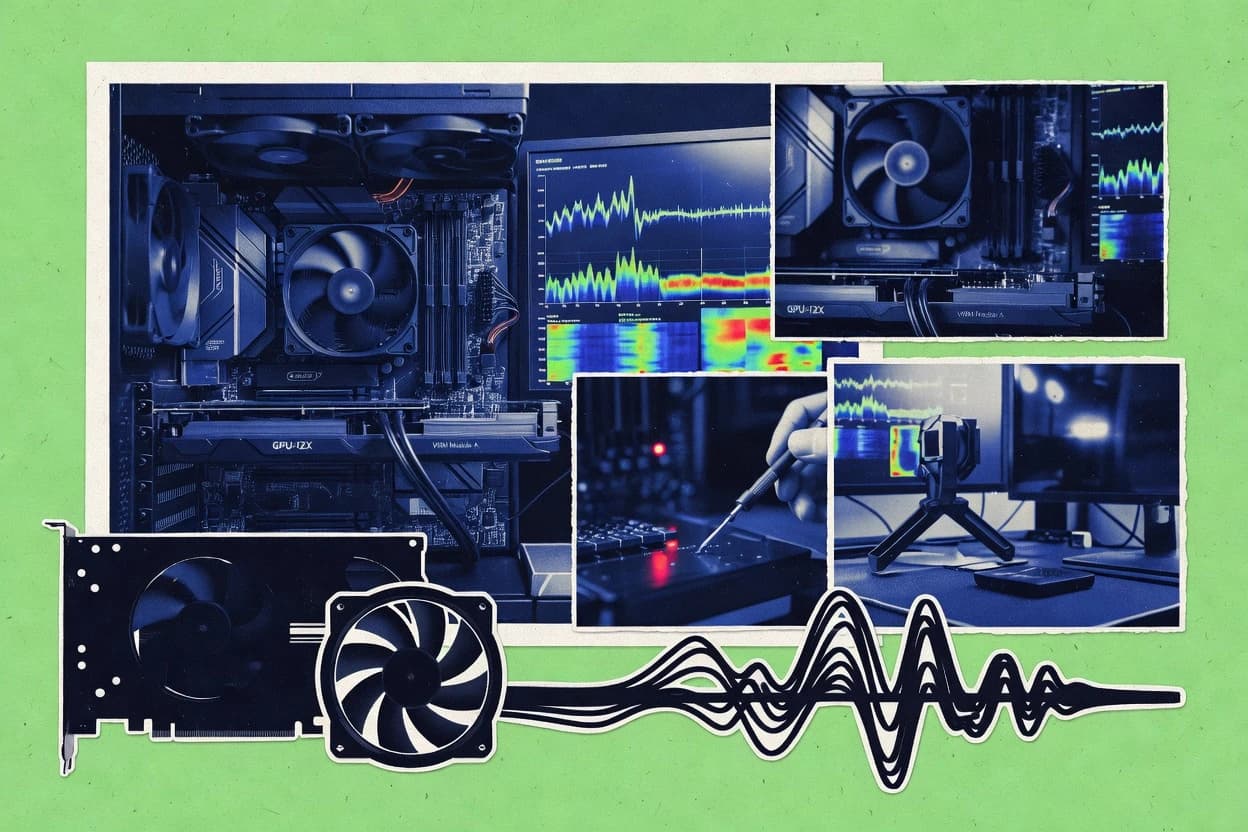
Explore the Top 10 Graphics Card Monitoring Software ranking with GPU telemetry tools, compare picks like nvidia-smi exporter and Datadog.

How we ranked these tools
Core product claims cross-referenced against official documentation, changelogs, and independent technical reviews.
Analyzed video reviews and hundreds of written evaluations to capture real-world user experiences with each tool.
AI persona simulations modeled how different user types would experience each tool across common use cases and workflows.
Final rankings reviewed and approved by our editorial team with authority to override AI-generated scores based on domain expertise.
Score: Features 40% · Ease 30% · Value 30%
Gitnux may earn a commission through links on this page — this does not influence rankings. Editorial policy
Editor’s top 3 picks
Three quick recommendations before you dive into the full comparison below — each one leads on a different dimension.
NVIDIA System Management Interface
Programmatic NVSMI telemetry and control interface for querying GPU metrics
Built for engineering teams automating NVIDIA GPU monitoring and health checks.
nvidia-smi exporter
nvidia-smi driven metric exporter that transforms GPU stats into Prometheus time series
Built for prometheus users needing Nvidia GPU monitoring without heavy GPU management tooling.
Datadog
Metric alerts correlated with distributed traces for root-cause analysis
Built for teams needing correlated GPU monitoring with application traces and logs.
Related reading
Comparison Table
This comparison table evaluates graphics card monitoring options, including NVIDIA System Management Interface and the nvidia-smi exporter, alongside observability stacks such as Prometheus, Grafana, and Datadog. It compares how each tool collects GPU telemetry, how dashboards and alerting are configured, and how well the setup fits local use versus centralized monitoring.
| # | Tool | Category | Overall | Features | Ease of Use | Value |
|---|---|---|---|---|---|---|
| 1 | NVIDIA System Management Interface The NVIDIA System Management Interface provides command line monitoring and GPU health telemetry for supported NVIDIA data center and workstation GPUs. | vendor CLI | 9.4/10 | 9.3/10 | 9.3/10 | 9.5/10 |
| 2 | nvidia-smi exporter The nvidia-smi exporter exposes NVIDIA GPU metrics to Prometheus by polling nvidia-smi and serving them on an HTTP metrics endpoint. | Prometheus exporter | 9.0/10 | 9.0/10 | 8.9/10 | 9.2/10 |
| 3 | Datadog Datadog collects and visualizes GPU and host metrics from supported GPU integrations using agents that emit metrics into Datadog dashboards and alerts. | observability | 8.7/10 | 8.5/10 | 9.0/10 | 8.8/10 |
| 4 | Grafana Grafana builds dashboards for GPU performance metrics by consuming time series data from Prometheus or other monitoring backends. | dashboarding | 8.4/10 | 8.8/10 | 8.2/10 | 8.2/10 |
| 5 | Prometheus Prometheus stores GPU metrics over time and supports alerting rules for GPU utilization, memory, and health signals provided by GPU exporters. | metrics time series | 8.1/10 | 8.2/10 | 7.9/10 | 8.3/10 |
| 6 | Radeon GPU Profiler Radeon GPU Profiler targets AMD GPU profiling and performance analysis workflows with telemetry and trace-based views for supported Radeon products. | AMD profiling | 7.9/10 | 7.8/10 | 8.0/10 | 7.8/10 |
| 7 | Open Hardware Monitor Open Hardware Monitor reads hardware sensor data from supported systems and can expose temperatures and fan related signals for parts used in GPU rigs. | hardware sensors | 7.5/10 | 7.6/10 | 7.5/10 | 7.5/10 |
| 8 | MSI Afterburner MSI Afterburner monitors GPU core clock, memory clock, temperatures, and power and can log telemetry to disk for later review. | desktop monitoring | 7.2/10 | 7.3/10 | 7.0/10 | 7.4/10 |
| 9 | GPU-Z GPU-Z reports GPU identification and key runtime parameters and is used alongside logging or sampling tools for GPU monitoring workflows. | GPU inspection | 7.0/10 | 7.0/10 | 6.8/10 | 7.1/10 |
| 10 | OpenTelemetry Collector The OpenTelemetry Collector routes telemetry data from GPU metric sources into monitoring backends so GPU metrics can power dashboards and alerts. | telemetry pipeline | 6.7/10 | 7.0/10 | 6.4/10 | 6.5/10 |
The NVIDIA System Management Interface provides command line monitoring and GPU health telemetry for supported NVIDIA data center and workstation GPUs.
The nvidia-smi exporter exposes NVIDIA GPU metrics to Prometheus by polling nvidia-smi and serving them on an HTTP metrics endpoint.
Datadog collects and visualizes GPU and host metrics from supported GPU integrations using agents that emit metrics into Datadog dashboards and alerts.
Grafana builds dashboards for GPU performance metrics by consuming time series data from Prometheus or other monitoring backends.
Prometheus stores GPU metrics over time and supports alerting rules for GPU utilization, memory, and health signals provided by GPU exporters.
Radeon GPU Profiler targets AMD GPU profiling and performance analysis workflows with telemetry and trace-based views for supported Radeon products.
Open Hardware Monitor reads hardware sensor data from supported systems and can expose temperatures and fan related signals for parts used in GPU rigs.
MSI Afterburner monitors GPU core clock, memory clock, temperatures, and power and can log telemetry to disk for later review.
GPU-Z reports GPU identification and key runtime parameters and is used alongside logging or sampling tools for GPU monitoring workflows.
The OpenTelemetry Collector routes telemetry data from GPU metric sources into monitoring backends so GPU metrics can power dashboards and alerts.
NVIDIA System Management Interface
vendor CLIThe NVIDIA System Management Interface provides command line monitoring and GPU health telemetry for supported NVIDIA data center and workstation GPUs.
Programmatic NVSMI telemetry and control interface for querying GPU metrics
NVIDIA System Management Interface stands out for exposing low-level GPU telemetry and control through a developer-focused management interface for NVIDIA hardware. It delivers real-time monitoring data such as utilization, temperatures, fan behavior, power draw, and memory status. It also supports structured querying and automation so monitoring can be integrated into scripts and dashboards. Access to GPU health and configuration parameters enables operational workflows beyond basic status displays.
Pros
- Provides detailed GPU telemetry including power, thermals, and utilization
- Supports programmatic querying for monitoring automation and integrations
- Enables GPU health and configuration inspection for operational troubleshooting
- Works with NVIDIA devices using a standardized management interface
Cons
- Relies on NVIDIA hardware and drivers for full functionality
- Requires engineering effort to build UI dashboards from raw telemetry
- Management actions can be risky without careful permissions and validation
- Monitoring workflows are more developer-centric than end-user friendly
Best For
Engineering teams automating NVIDIA GPU monitoring and health checks
More related reading
nvidia-smi exporter
Prometheus exporterThe nvidia-smi exporter exposes NVIDIA GPU metrics to Prometheus by polling nvidia-smi and serving them on an HTTP metrics endpoint.
nvidia-smi driven metric exporter that transforms GPU stats into Prometheus time series
nvidia-smi exporter specializes in converting Nvidia GPU telemetry from the nvidia-smi command into Prometheus-compatible metrics. It exposes common device signals like GPU utilization, memory usage, temperature, and power draw for monitoring and alerting workflows. The exporter works well in containerized and Kubernetes environments because it is designed to run as a metrics endpoint backed by periodic nvidia-smi polling. Metric labels map GPU identity to help multi-GPU hosts separate time series by device.
Pros
- Direct nvidia-smi sampling produces reliable, vendor-native GPU metrics
- Prometheus metrics format supports dashboards and alert rules
- Per-GPU labels separate time series on multi-GPU systems
- Lightweight exporter model minimizes overhead beyond GPU polling
Cons
- Metrics granularity depends on nvidia-smi refresh behavior
- Requires Nvidia drivers and accessible nvidia-smi on the host
- Limited to Nvidia hardware and nvidia-smi accessible data
- Polling cadence can add delay versus event-driven telemetry
Best For
Prometheus users needing Nvidia GPU monitoring without heavy GPU management tooling
Datadog
observabilityDatadog collects and visualizes GPU and host metrics from supported GPU integrations using agents that emit metrics into Datadog dashboards and alerts.
Metric alerts correlated with distributed traces for root-cause analysis
Datadog stands out with unified observability that ties GPU and host metrics to traces and logs. It supports infrastructure monitoring that can surface graphics card health signals like utilization and memory through agent-collected metrics. Dashboards and monitors enable alerting on GPU hotspots, then correlate those events with application performance using its trace analytics. This makes GPU monitoring actionable for operations and developers who already rely on Datadog for end-to-end visibility.
Pros
- GPU and host metrics can be correlated with traces and logs
- Custom dashboards and monitors for GPU utilization and error conditions
- Powerful alerting with anomaly detection and event-driven workflows
- Centralized observability across servers, containers, and services
Cons
- GPU metric collection depends on correct agent configuration and exporters
- High-cardinality GPU labeling can increase ingestion and dashboard complexity
- Deep GPU-specific details may require additional vendor instrumentation
Best For
Teams needing correlated GPU monitoring with application traces and logs
Grafana
dashboardingGrafana builds dashboards for GPU performance metrics by consuming time series data from Prometheus or other monitoring backends.
Dashboard templating variables combined with Explore for rapid per-GPU investigation
Grafana stands out with highly customizable dashboards built from modular panels and reusable variables. It can visualize GPU metrics from NVIDIA and AMD stacks when data is exposed through Prometheus, InfluxDB, or other supported data sources. Alerting can trigger on threshold breaches and rate changes using the same metric queries used for visualization. Explore mode and templated dashboards make it practical to drill into per-host or per-GPU trends across environments.
Pros
- Highly customizable dashboard panels with flexible graph, table, and heatmap layouts
- Works with many metric backends like Prometheus and InfluxDB for GPU telemetry
- Rule-based alerting on the same GPU queries powering dashboards
- Templating variables enable easy per-host and per-GPU filtering
Cons
- Requires a separate metrics pipeline to collect GPU signals
- More tuning is needed for accurate GPU-specific metrics and label mapping
- Dashboard performance can degrade with high-cardinality GPU label sets
Best For
Teams needing GPU dashboards and alerting driven by external time-series metrics
Prometheus
metrics time seriesPrometheus stores GPU metrics over time and supports alerting rules for GPU utilization, memory, and health signals provided by GPU exporters.
PromQL for GPU metric queries and label-driven aggregations
Prometheus stands out with its pull-based metrics collection model and strong time-series foundation. It works for GPU monitoring by scraping exporters that expose metrics like utilization and memory. Queries with PromQL enable detailed aggregation across multiple GPUs and hosts. Alerting rules evaluate metric thresholds and fire notifications when conditions hold for configured durations.
Pros
- Pull-based scraping with configurable intervals for predictable GPU metric collection
- PromQL supports flexible aggregations across GPUs, hosts, and labels
- Alerting rules evaluate time-series conditions with hold durations
- Long-term metric storage enables historical GPU performance analysis
- Visualization via Grafana dashboards using Prometheus query endpoints
Cons
- Prometheus does not read GPU sensors directly without exporter integration
- High cardinality labels can bloat storage and slow queries
- Alerting configuration complexity grows with large GPU fleets
- Raw alert delivery lacks built-in incident workflows without external tooling
Best For
Teams building GPU observability with metrics pipelines and dashboarding
Radeon GPU Profiler
AMD profilingRadeon GPU Profiler targets AMD GPU profiling and performance analysis workflows with telemetry and trace-based views for supported Radeon products.
GPU queue and dispatch timeline analysis driven by hardware performance counters
Radeon GPU Profiler focuses on capturing and analyzing GPU execution timelines for AMD Radeon workloads. It generates detailed performance markers and counters tied to rendering and compute work submission. The tool helps isolate stalls, low utilization periods, and thread-level bottlenecks across GPU queues. Its workflow supports both interactive inspection and offline investigation of captured profiling data.
Pros
- GPU timeline view with queue and dispatch-level context
- Performance counter collection for diagnosing stalls and utilization drops
- Correlates GPU events with application execution phases
- Supports offline analysis via saved profiling captures
Cons
- Best results require AMD Radeon hardware and compatible drivers
- Advanced counter interpretation can be time-consuming
- UI navigation can feel dense during deep counter comparisons
- Limited guidance for cross-tool workflow automation
Best For
Performance engineers profiling Radeon rendering and compute bottlenecks with detailed timelines
Open Hardware Monitor
hardware sensorsOpen Hardware Monitor reads hardware sensor data from supported systems and can expose temperatures and fan related signals for parts used in GPU rigs.
Live sensor aggregation across GPU and motherboard using an extensible plugin-friendly design
Open Hardware Monitor is a lightweight desktop monitor that reads GPU and other hardware sensors using OS-level access. It displays live values for graphics cards such as temperatures, fan speeds, and utilization with a straightforward sensor list view. The tool can also expose sensor readings to plugins and scripting workflows through its published architecture. Limited device coverage and limited control options keep it focused on monitoring rather than tuning.
Pros
- Real-time GPU sensor readings for temperature and fan RPM
- Works across multiple hardware components beyond the graphics card
- Configurable sensor display with a clear live update model
Cons
- No built-in GPU overclocking or fan curve control
- Sensor availability varies by GPU model and driver support
- UI remains basic and lacks advanced historical dashboards
Best For
Local GPU monitoring for troubleshooting and lightweight hardware visibility
MSI Afterburner
desktop monitoringMSI Afterburner monitors GPU core clock, memory clock, temperatures, and power and can log telemetry to disk for later review.
Customizable fan curve editor with manual and automatic GPU temperature management
MSI Afterburner stands out with tight integration for MSI graphics cards and broad third-party GPU support via common monitoring hooks. It delivers real-time GPU core clocks, temperatures, fan speeds, and utilization across supported NVIDIA and AMD devices. It also supports on-screen display and logging so performance changes can be reviewed during benchmarks or long gaming sessions. Hardware control features include overclocking and fan curve tuning through a desktop interface and profiles.
Pros
- Real-time GPU metrics including clocks, temps, utilization, and fan speed
- On-screen display for live monitoring during games
- Profile system simplifies saving and switching overclock settings
- Fan curve editing enables targeted thermal control
Cons
- Overclocking and control options can be risky without prior tuning
- Sensor availability varies by GPU model and driver
- Logging and graphs can feel basic compared with specialized tools
- The UI can be dense for quick readouts
Best For
Enthusiasts needing local GPU monitoring with fan and clock control profiles
GPU-Z
GPU inspectionGPU-Z reports GPU identification and key runtime parameters and is used alongside logging or sampling tools for GPU monitoring workflows.
Sensor monitoring with GPU clocks, load, temperatures, and fan RPM in one view
GPU-Z stands out for delivering a compact, hardware-focused snapshot of GPU details with minimal setup. It shows core graphics adapter data like GPU model, BIOS version, driver version, and memory configuration. The tool includes real-time monitoring graphs for key sensors such as GPU load, clock speeds, temperatures, and fan RPM. It also exports captured sensor readouts for troubleshooting and comparison across systems.
Pros
- Fast hardware identification with detailed GPU and BIOS information
- Real-time sensor monitoring with clear graphs for key values
- Shows clocks, load, temperatures, and fan RPM simultaneously
- Snapshot and save captured data for support and comparisons
Cons
- Focused on GPU sensors, with limited broader system telemetry
- Monitoring charts can be less configurable than full dashboard tools
- No built-in alerting or automated threshold notifications
- Graph-based view can be harder for long-term logging needs
Best For
Tech support and enthusiasts needing quick, accurate GPU sensor snapshots
OpenTelemetry Collector
telemetry pipelineThe OpenTelemetry Collector routes telemetry data from GPU metric sources into monitoring backends so GPU metrics can power dashboards and alerts.
Built-in processors and exporters for transforming and routing GPU metrics with consistent labeling
OpenTelemetry Collector stands out by acting as a protocol-agnostic telemetry pipeline that converts signals across multiple formats for storage and monitoring backends. It can ingest metrics from GPU telemetry sources and route them through processors like batch, memory limiting, and attribute manipulation. With exporters, it can forward GPU metrics to Prometheus-compatible endpoints or observability platforms that support OpenTelemetry. For graphics card monitoring, it shines when normalizing vendor-specific GPU signals into consistent time-series metrics and traces.
Pros
- Protocol translation enables unified GPU telemetry ingestion across multiple sources
- Processors like batch and memory_limiter stabilize GPU metric streams during spikes
- Attribute and metric transformations standardize GPU labels for dashboards
- Exporters send metrics to Prometheus endpoints and observability backends
Cons
- Collector does not read GPU hardware directly without a metrics receiver
- Dashboards and alerts require separate setup in the destination tooling
- Configuration complexity increases when mapping vendor metrics into common schemas
Best For
Teams standardizing GPU metrics pipelines across heterogeneous systems and backends
How to Choose the Right Graphics Card Monitoring Software
This buyer’s guide explains how to select Graphics Card Monitoring Software across NVIDIA and AMD environments using tools such as NVIDIA System Management Interface, nvidia-smi exporter, Datadog, and Grafana. It also covers profiling-focused options like Radeon GPU Profiler and lightweight sensor viewers like Open Hardware Monitor, GPU-Z, and MSI Afterburner. The guide focuses on concrete monitoring capabilities, data pipelines, and operational workflows supported by these specific tools.
What Is Graphics Card Monitoring Software?
Graphics Card Monitoring Software tracks GPU telemetry such as utilization, temperature, fan behavior, and power draw, then presents that data in dashboards, alerts, logs, or captured snapshots. It solves problems like identifying thermal throttling, isolating utilization drops, and correlating GPU load with application performance. Tools like NVIDIA System Management Interface provide developer-focused GPU health telemetry and structured querying for NVIDIA hardware. Toolchains like Prometheus plus Grafana typically pair GPU metric exporters with time-series dashboards for alerting and investigation.
Key Features to Look For
These features matter because they determine whether GPU signals can be used for troubleshooting, alerting, or performance analysis with the least operational friction.
Programmatic low-level GPU telemetry access
NVIDIA System Management Interface exposes structured, developer-oriented GPU metrics such as utilization, thermals, fan behavior, power draw, and memory status through a command-line management interface. This enables automation workflows and health checks that go beyond a simple desktop readout.
Prometheus-ready metrics export driven by vendor tooling
nvidia-smi exporter polls NVIDIA GPU metrics using nvidia-smi and serves Prometheus-compatible time-series on an HTTP endpoint. This supports monitoring and alerting workflows that depend on predictable labeled metrics per GPU on multi-GPU hosts.
Correlated GPU alerts with traces and logs
Datadog ties GPU and host metrics into a unified observability workflow where metric monitors can be correlated with distributed traces and logs. This helps root-cause GPU-related incidents by linking GPU utilization or hotspots to application-level events.
Templated dashboards and per-GPU exploration
Grafana builds GPU dashboards using modular panels from Prometheus or InfluxDB and uses templating variables combined with Explore for rapid per-host and per-GPU investigation. This makes it practical to drill into specific GPU devices across environments using the same dashboard queries.
PromQL time-series queries and label-driven aggregations
Prometheus stores GPU metric histories and uses PromQL for aggregating GPU utilization, memory, and health signals across GPUs and hosts. Alerting rules evaluate time-series conditions with hold durations, which is useful for avoiding noisy alerts during short spikes.
Queue and dispatch-level GPU profiling for bottleneck isolation
Radeon GPU Profiler provides timeline views with queue and dispatch-level context tied to AMD Radeon performance counters. This supports performance engineering workflows that need to isolate stalls and low-utilization periods across GPU queues rather than only watching high-level utilization.
How to Choose the Right Graphics Card Monitoring Software
The best choice matches the intended workflow to the correct telemetry source, visualization or profiling layer, and automation or alerting requirements.
Match the tool to the GPU telemetry source available
Choose NVIDIA System Management Interface when NVIDIA hardware access and programmatic telemetry are required for GPU health checks and operational troubleshooting. Choose nvidia-smi exporter when Prometheus time-series metrics must be produced by polling nvidia-smi on the host for GPU utilization, memory, temperature, and power.
Decide whether the goal is monitoring, dashboarding, or profiling
Choose Datadog or Grafana for ongoing monitoring and alerting workflows built around GPU utilization and related signals. Choose Radeon GPU Profiler when the need is queue and dispatch timeline analysis driven by hardware performance counters for performance bottleneck isolation.
Build the metrics pipeline explicitly around exporters and backends
For metrics-driven monitoring, use Prometheus as the time-series store and evaluate GPU alerting rules using PromQL queries. Use Grafana to render those same PromQL-backed metrics into dashboards with templating variables for per-GPU filtering and Explore for investigation.
Use a telemetry normalization layer when mixing sources and backends
Choose OpenTelemetry Collector when GPU metric streams need normalization and routing across multiple formats and destination backends. Use its processors such as batch and memory_limiter and its attribute or metric transformation capabilities to standardize labels before exporting to Prometheus-compatible endpoints.
Pick a local sensor view tool for fast troubleshooting and validation
Choose Open Hardware Monitor for lightweight, real-time GPU and motherboard sensor aggregation such as temperatures and fan RPM. Choose GPU-Z for fast GPU identification plus real-time sensor monitoring graphs and captured snapshots, and choose MSI Afterburner for live clocks, temperatures, and fan curve tuning with profiles for local experiments.
Who Needs Graphics Card Monitoring Software?
Graphics Card Monitoring Software helps specific teams and individuals depending on whether monitoring must be automated, integrated into observability, or used for deep GPU profiling and local troubleshooting.
Engineering teams automating NVIDIA GPU monitoring and health checks
NVIDIA System Management Interface fits this audience because it provides structured, programmatic NVSMI telemetry and control for low-level GPU metrics like power draw, thermals, and utilization. It also exposes GPU health and configuration parameters that support operational troubleshooting.
Prometheus users standardizing GPU metric ingestion for NVIDIA fleets
nvidia-smi exporter fits this audience because it converts nvidia-smi GPU telemetry into Prometheus metrics with per-GPU labels for time-series separation. Prometheus then evaluates utilization, memory, and health alerting rules using PromQL across labeled devices.
Operations and engineering teams needing correlated GPU incidents across traces and logs
Datadog fits this audience because it supports GPU and host metric collection and enables metric alerts correlated with distributed traces for root-cause analysis. This helps connect GPU hotspots and utilization patterns to application performance events.
Performance engineers diagnosing AMD rendering or compute bottlenecks
Radeon GPU Profiler fits this audience because it provides queue and dispatch timeline analysis driven by AMD Radeon performance counters. It supports isolating stalls and low-utilization periods using detailed GPU execution timelines for offline investigation.
Common Mistakes to Avoid
Common failures come from choosing the wrong layer for the job or underestimating how telemetry sources and labeling affect monitoring usability.
Selecting a dashboard tool without a working GPU metrics pipeline
Grafana can only visualize GPU signals if a separate metrics pipeline exposes GPU telemetry through a supported backend like Prometheus or InfluxDB. Prometheus also cannot read GPU sensors directly without exporter integration, so nvidia-smi exporter is needed for NVIDIA metrics in Prometheus workflows.
Assuming a local sensor viewer can deliver alerting at scale
Open Hardware Monitor and GPU-Z focus on sensor readings and graphs for visibility and troubleshooting rather than automated threshold notifications. MSI Afterburner supports local logging and overlays but does not provide the centralized, label-driven alerting workflow used by Prometheus and Grafana.
Building heterogeneous telemetry pipelines without normalization
OpenTelemetry Collector exists to standardize labels and normalize vendor-specific GPU signals across formats, which prevents inconsistent time series naming when multiple sources feed dashboards. Without this, Grafana and Prometheus queries become harder to maintain because label mapping and attribute naming drift across sources.
Using monitoring telemetry when deep bottleneck isolation is required
GPU utilization and temperature dashboards can show symptoms but cannot replace queue and dispatch analysis when the goal is stall and bottleneck isolation. Radeon GPU Profiler provides queue and dispatch timeline views driven by hardware performance counters that monitoring-focused tools do not provide.
How We Selected and Ranked These Tools
We evaluated every tool on three sub-dimensions with explicit weights. Features account for 0.40 of the final score, ease of use accounts for 0.30, and value accounts for 0.30, so overall equals 0.40 times features plus 0.30 times ease of use plus 0.30 times value. NVIDIA System Management Interface separated itself from lower-ranked tools by combining high feature depth with strong ease of automation, because its programmatic NVSMI telemetry and control interface supports structured querying for utilization, thermals, fan behavior, power draw, and health configuration inspection. This combination directly improved operational usefulness for engineering teams that must integrate GPU monitoring into scripts and troubleshooting workflows.
Frequently Asked Questions About Graphics Card Monitoring Software
Which tool is best for programmatic NVIDIA GPU monitoring and health checks?
NVIDIA System Management Interface is designed for structured querying and automation of low-level GPU telemetry and health-related parameters. It exposes real-time utilization, temperatures, fan behavior, power draw, and memory status through a developer-focused management interface.
How do teams convert NVIDIA GPU telemetry into Prometheus alerts?
nvidia-smi exporter turns periodic nvidia-smi polling output into Prometheus-compatible metrics with per-GPU labels. Prometheus then scrapes the exporter endpoint and applies PromQL-based alert rules on utilization, temperature, memory usage, and power draw.
What setup is used for GPU monitoring dashboards with drill-down by host and GPU?
Grafana builds dashboards from metrics stored in Prometheus or InfluxDB and uses templated variables to switch per-host or per-GPU views. Explore mode supports ad hoc investigation using the same metric queries that power alerting.
Which solution links GPU metrics to application traces and logs for root-cause analysis?
Datadog connects GPU and host metrics with traces and logs so GPU hotspots can be correlated with application performance events. Its monitors can trigger on utilization or memory signals and then use trace analytics to pinpoint the impact path.
Which tool suits AMD GPU performance profiling down to GPU execution timelines?
Radeon GPU Profiler targets Radeon workloads by capturing detailed execution timelines and performance markers. It helps identify stalls and low-utilization periods across GPU queues through hardware performance counter-driven profiling.
What option works for local sensor visibility when a server-side monitoring stack is not available?
Open Hardware Monitor provides lightweight desktop monitoring by reading GPU sensor values via OS-level access. It also supports plugins and scripting-friendly sensor exposure, but its device coverage and control features remain limited.
Which software is better for enthusiasts who want monitoring plus fan curve and overclock control?
MSI Afterburner focuses on local monitoring with strong control features like overclocking and fan curve tuning. It shows GPU core clocks, temperatures, fan speeds, and utilization and includes on-screen display and logging for benchmark comparisons.
What tool is best for capturing a quick, shareable GPU status snapshot for troubleshooting?
GPU-Z is built for compact hardware-focused snapshots that include GPU model, BIOS version, driver version, and memory configuration. It also displays real-time sensor graphs for GPU load, clock speeds, temperatures, and fan RPM and can export captured readouts for comparison.
How do organizations standardize heterogeneous GPU telemetry pipelines across vendors and monitoring backends?
OpenTelemetry Collector normalizes telemetry by ingesting signals from GPU telemetry sources and routing them through processors that add or transform attributes. It can forward metrics to Prometheus-compatible endpoints or observability platforms using OpenTelemetry exporters, which reduces vendor-specific differences.
What common monitoring issue happens when GPU metrics do not align across tools, and how can it be diagnosed?
Prometheus aggregations depend on consistent metric labels from sources like nvidia-smi exporter, and misalignment can show up as mixed time series across GPUs. Grafana dashboards can quickly reveal label issues, while OpenTelemetry Collector can standardize attributes before metrics reach Prometheus and dashboards.
Conclusion
After evaluating 10 technology digital media, NVIDIA System Management Interface stands out as our overall top pick — it scored highest across our combined criteria of features, ease of use, and value, which is why it sits at #1 in the rankings above.
Use the comparison table and detailed reviews above to validate the fit against your own requirements before committing to a tool.
Tools reviewed
Referenced in the comparison table and product reviews above.
Keep exploring
Comparing two specific tools?
Software Alternatives
See head-to-head software comparisons with feature breakdowns, pricing, and our recommendation for each use case.
Explore software alternatives→In this category
Technology Digital Media alternatives
See side-by-side comparisons of technology digital media tools and pick the right one for your stack.
Compare technology digital media tools→FOR SOFTWARE VENDORS
Not on this list? Let’s fix that.
Our best-of pages are how many teams discover and compare tools in this space. If you think your product belongs in this lineup, we’d like to hear from you—we’ll walk you through fit and what an editorial entry looks like.
Apply for a ListingWHAT THIS INCLUDES
Where buyers compare
Readers come to these pages to shortlist software—your product shows up in that moment, not in a random sidebar.
Editorial write-up
We describe your product in our own words and check the facts before anything goes live.
On-page brand presence
You appear in the roundup the same way as other tools we cover: name, positioning, and a clear next step for readers who want to learn more.
Kept up to date
We refresh lists on a regular rhythm so the category page stays useful as products and pricing change.