GITNUXSOFTWARE ADVICE
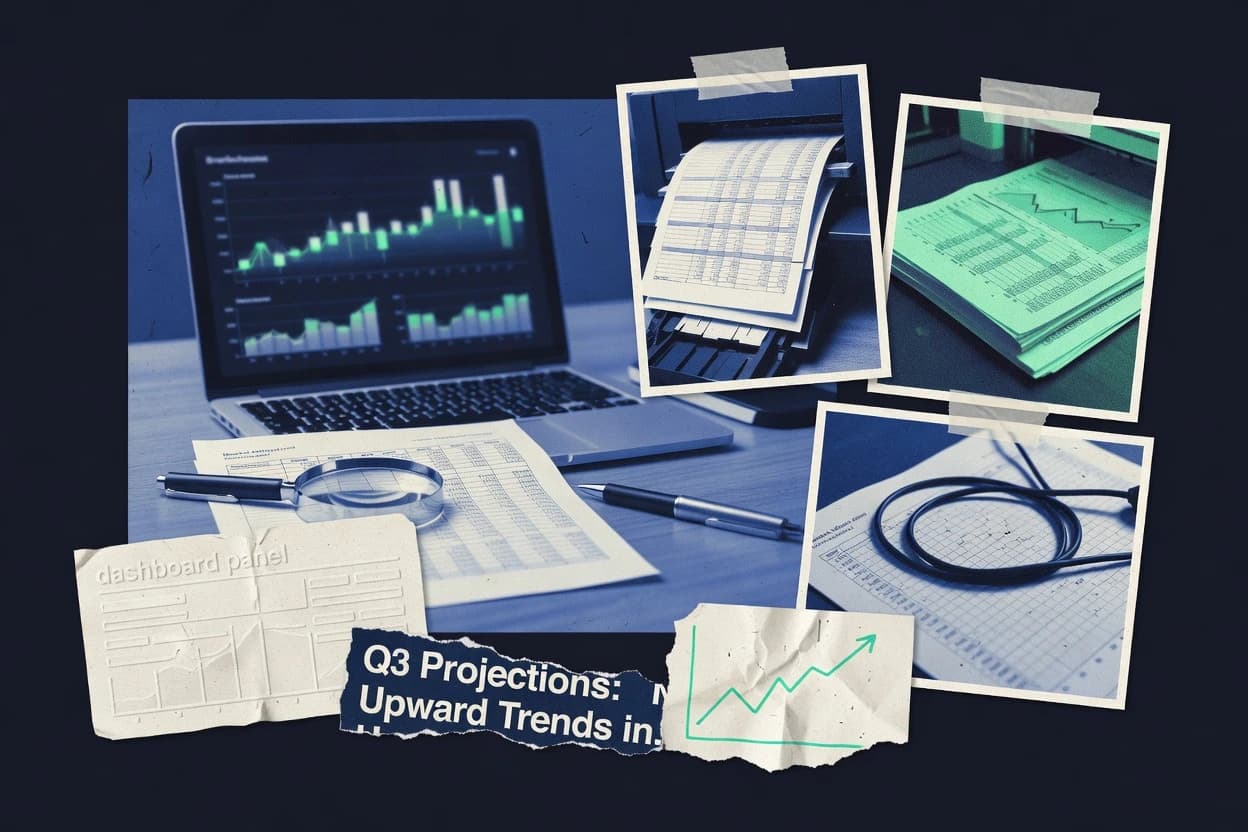
Data Science AnalyticsTop 10 Best Financial Data Software of 2026
Compare the top Financial Data Software tools with a ranked shortlist, including Databricks SQL, Snowflake, and Amazon Redshift. Explore picks.

How we ranked these tools
Core product claims cross-referenced against official documentation, changelogs, and independent technical reviews.
Analyzed video reviews and hundreds of written evaluations to capture real-world user experiences with each tool.
AI persona simulations modeled how different user types would experience each tool across common use cases and workflows.
Final rankings reviewed and approved by our editorial team with authority to override AI-generated scores based on domain expertise.
Score: Features 40% · Ease 30% · Value 30%
Gitnux may earn a commission through links on this page — this does not influence rankings. Editorial policy
Editor’s top 3 picks
Three quick recommendations before you dive into the full comparison below — each one leads on a different dimension.
Databricks SQL
Row-level security enforced in SQL queries across Databricks datasets
Built for financial analysts needing governed SQL dashboards on governed data lakes.
Snowflake
Editor pickTime Travel for point-in-time restores and repeatable financial analyses
Built for financial teams building governed analytics with scalable SQL workloads.
Amazon Redshift
Editor pickConcurrency scaling for bursty workloads without resizing the cluster
Built for financial teams running SQL analytics on large AWS data warehouses.
Related reading
- Data Science AnalyticsTop 10 Best Financial Data Analytics Software of 2026
- Data Science AnalyticsTop 10 Best Financial Data Quality Software of 2026
- Data Science AnalyticsTop 10 Best Dynamic Financial Analysis Software of 2026
- Finance Financial ServicesTop 10 Best Big Data Analytics Financial Services of 2026
Comparison Table
This comparison table maps major financial data software tools, including Databricks SQL, Snowflake, Amazon Redshift, Google BigQuery, and Microsoft Power BI, across key capabilities used in analytics and reporting. Each row highlights how platforms handle data warehousing, query performance, governance, and integration paths so teams can align tool choice with specific financial workloads. Readers can use the table to contrast strengths, limitations, and deployment patterns across cloud-native and BI-focused options.
Databricks SQL
lakehouse analyticsEnterprise analytics platform that runs SQL, notebooks, and dashboards over financial data using Delta Lake tables and managed compute.
Row-level security enforced in SQL queries across Databricks datasets
Databricks SQL stands out for running fast analytics directly on Databricks’ unified data platform without separate BI extracts. It supports interactive dashboards, ad hoc queries, and governed SQL access with row-level security for sensitive financial datasets.
Built-in connectors and support for Delta Lake improve reliability for time-series and historical reporting workloads. It also integrates with Databricks workflows so metrics can be refreshed from curated pipelines rather than manual exports.
- +Optimized execution over Delta Lake for consistent financial reporting latency
- +Row-level security for governed access to customer and transaction data
- +Interactive dashboards with drilldown for faster variance analysis
- +Seamless SQL and notebook integration for shared metric definitions
- +Time-series friendly querying for balances, rates, and cash flow views
- –Advanced governance setup requires SQL and platform configuration skills
- –Large dashboard performance depends on data modeling and partitioning choices
- –Some BI workflows need external scheduling for non-Databricks consumers
Best for: Financial analysts needing governed SQL dashboards on governed data lakes
More related reading
Snowflake
cloud data warehouseCloud data platform that delivers scalable storage and query execution for structured and semi-structured financial datasets with built-in data sharing.
Time Travel for point-in-time restores and repeatable financial analyses
Snowflake stands out for separating compute from storage, enabling elastic performance for analyst workloads and heavy batch processing. It supports governed data sharing across organizations and environments, which fits financial data governance and collaboration needs.
Built-in features like secure data access, automatic clustering, and time-travel support auditability and reliable backtesting workflows. Its SQL-based ecosystem integrates with BI tools and ETL pipelines for end-to-end financial analytics delivery.
- +Elastic warehouses scale query performance without changing physical storage
- +Time Travel enables repeatable backtests and point-in-time reconciliation
- +Secure data sharing reduces data duplication between trading and risk teams
- +Row-level security controls access by portfolio, desk, or regulatory regime
- +Automatic clustering improves performance for semi-structured and large tables
- –High workload concurrency can require careful warehouse sizing and governance
- –Optimizing for performance often demands warehouse and clustering tuning
- –Large-scale data sharing setup can add operational overhead
Best for: Financial teams building governed analytics with scalable SQL workloads
Amazon Redshift
managed warehouseFully managed cloud data warehouse for high-performance analytics on financial data with concurrency scaling and materialized views.
Concurrency scaling for bursty workloads without resizing the cluster
Amazon Redshift stands out for fast analytical SQL on columnar storage managed on AWS infrastructure. It powers financial reporting and risk analytics by supporting data warehousing, materialized views, and workload management.
Integration with AWS services enables ingest pipelines and governed access across large financial datasets. Concurrency scaling helps handle bursty analyst and ETL query traffic without redesigning the warehouse.
- +Columnar storage accelerates large-scale analytical queries
- +Workload management prioritizes mixed BI and ETL query patterns
- +Materialized views speed repeated financial aggregations
- +Concurrency scaling handles spikes in analyst query traffic
- +Cluster and node management simplifies elastic capacity planning
- –Schema changes can require careful planning to avoid downtime
- –Complex optimization can be time-consuming for non-experts
- –Real-time streaming analytics require additional AWS ingestion components
- –Cross-region governance and auditing needs deliberate setup
- –High cardinality joins can still cause performance bottlenecks
Best for: Financial teams running SQL analytics on large AWS data warehouses
Google BigQuery
serverless warehouseServerless analytics database that supports fast SQL queries over large financial datasets and integrates with data governance features.
Materialized views accelerate repeated financial reporting queries
Google BigQuery stands out for running analytics on petabyte-scale datasets with SQL-based workflows and fast, parallel execution. It supports large-scale financial data modeling through BigQuery SQL, scheduled queries, and materialized views for repeated reporting workloads.
Built-in connectors and integrations cover common finance pipelines from data sources into a governed analytics warehouse. Strong access controls, auditing, and encryption help teams manage sensitive transaction and risk datasets.
- +SQL engine runs complex joins and aggregations on massive datasets quickly
- +Materialized views accelerate recurring dashboards and reporting queries
- +Partitioning and clustering reduce scan volume for time-based financial data
- +Fine-grained IAM and audit logs support secure analytics governance
- +ML and analytics integrations support forecasting and anomaly workflows
- –High query concurrency can complicate performance tuning for teams
- –Cost optimization requires disciplined partitioning and clustering design
- –Cross-region data management adds complexity for distributed stakeholders
Best for: Financial analytics teams managing large transaction datasets with SQL governance
Microsoft Power BI
BI and reportingSelf-service analytics and reporting tool that connects to financial data sources and publishes interactive dashboards with row-level security.
DAX calculation engine for financial measures and time intelligence
Microsoft Power BI stands out for tight Microsoft ecosystem integration with Excel, Azure, and Teams, plus strong governance via Microsoft Entra. It delivers end to end financial reporting with Power Query data shaping, DAX measures, and interactive dashboards for drill through analysis.
Paginated reports support pixel accurate statement style outputs, while dataset sharing and workspace roles help control access to curated financial models. Real time dashboards connect through streaming datasets and DirectQuery, enabling frequent updates for operational finance views.
- +DAX measures enable robust financial calculations like rolling totals and cohort metrics
- +Power Query streamlines ETL with reusable transformations and schema handling
- +Paginated reports fit statement layouts and regulatory style print outputs
- +DirectQuery supports near live visuals without loading full datasets
- –Model complexity rises quickly with many interdependent financial measures
- –Performance tuning can be required for large models and high concurrency
- –Paginated reports add separate authoring steps from standard dashboards
- –Custom visuals may lag core features and require compatibility checks
Best for: Financial teams building governed dashboards and self service analysis in Microsoft stack
Qlik Sense
analytics platformInteractive analytics and guided dashboards that explore financial metrics with associative modeling and governed data access.
Associative analytics with global selections across measures, dimensions, and financial drill insights
Qlik Sense stands out for its associative data model that explores relationships between financial metrics without predefined drill paths. It delivers interactive dashboards, governed data discovery, and self-service analytics built on a single in-memory engine.
Financial reporting workflows benefit from reusable visualizations, alerting, and interactive filters that support what-if and variance analysis. Integrated connectors and data load scripting help standardize financial transformations before dashboards consume curated datasets.
- +Associative data model finds relationships across KPIs without manual drill hierarchies
- +Interactive dashboards support governed self-service exploration for financial users
- +Robust data load scripting enables repeatable financial transformations
- +Strong filtering and selections for rapid variance and trend analysis
- –Set analysis expressions can be difficult for complex financial calculations
- –Performance tuning is required for very large financial models and extracts
- –Dashboard governance requires careful model design and permissions planning
- –Advanced calculation logic may require scripting and developer assistance
Best for: Finance teams needing governed self-service analytics with associative KPI exploration
Tableau
visual analyticsData visualization and analytics platform that builds financial dashboards and drill-down views with governed datasets and sharing controls.
Row-level security that restricts views by user, group, and data attributes
Tableau stands out with interactive visual analytics that lets users explore financial metrics through drill-down dashboards. It connects to common enterprise data sources and supports governed datasets for consistent reporting across teams.
The platform delivers strong time-series exploration with calculated fields, parameters, and reusable dashboard components. Tableau also supports sharing via interactive views and embedded analytics for finance workflows.
- +Fast interactive dashboards for drill-through from KPI to underlying transactions
- +Strong calculated fields and parameters for scenario analysis
- +Broad connector support for SQL databases and cloud data warehouses
- +Row-level security enables controlled finance reporting
- –Dashboard authoring can become complex for large, highly customized models
- –Performance tuning is required for very large extracts and complex joins
- –Governance overhead increases when many teams publish dashboards
Best for: Finance teams building governed, interactive KPI dashboards without heavy engineering
Apache Superset
open-source BIOpen-source BI web application that enables SQL-based exploration and dashboards over financial datasets with role-based access.
Cross-filtered dashboards with interactive drill-down built on saved SQL queries
Apache Superset stands out for combining SQL exploration with a broad visualization layer in a single web interface. It supports Ad hoc querying, saved dashboards, and interactive filters backed by multiple data sources.
Semantic layers via native chart definitions and SQL Lab help teams iterate on financial reporting logic. Scheduled refresh and alerting support recurring monitoring use cases for metrics like cash flow, margins, and KPIs.
- +SQL Lab enables direct ad hoc analysis and reusable query history
- +Dashboard cross-filtering supports fast drill-down across financial KPIs
- +Native time-series charts fit forecasting, trends, and variance views
- +Multi-source connectivity supports mixing warehouse, lake, and operational datasets
- +Dashboard templating standardizes executive reporting across departments
- –Complex permission setups can be difficult for large financial orgs
- –Large dashboards may require tuning for responsiveness with many visuals
- –Some advanced modeling workflows require external data preparation
- –Custom metric definitions can become fragmented across datasets and charts
- –Maintaining consistent chart semantics needs governance and documentation
Best for: Teams publishing KPI dashboards and interactive financial reporting from SQL sources
Looker
semantic BISemantic modeling and analytics layer that standardizes financial metrics via LookML and serves dashboards from a governed data model.
LookML semantic layer for reusable, governed measures, dimensions, and reporting logic
Looker stands out for semantic modeling that standardizes financial definitions across teams and dashboards. It delivers SQL-based data exploration through LookML, which supports governed metrics, dimensions, and drill-down reporting.
Visualization and dashboarding are paired with permissions and row-level controls for secure access to financial datasets. Scheduled data refresh and embedded analytics support recurring reporting workflows across finance and operations.
- +LookML semantic layer enforces consistent financial metrics across dashboards
- +SQL-based exploration enables flexible ad hoc analysis
- +Row-level security supports governed views for sensitive financial data
- +Embedded dashboards fit operational reporting inside other applications
- –LookML requires modeling expertise and ongoing governance
- –Performance can depend heavily on underlying database design
- –Complex permissions and modeling may slow early implementation
- –Advanced analytics workflows can be limited without extra tooling
Best for: Finance teams standardizing metrics and delivering governed BI at scale
SAS Viya
analytics suiteAnalytics suite for financial data science workloads including data preparation, modeling, and governed analytics in SAS environments.
Model management with scoring and deployment integrated into a governed SAS analytics lifecycle
SAS Viya stands out for enterprise-grade analytics built on SAS’ governed data and model lifecycle capabilities. For financial data work, it supports large-scale ETL, advanced analytics, and rules-driven decisioning across risk, fraud, and forecasting workflows.
It integrates business intelligence, interactive analytics, and model management so governance and auditability travel with the analytics. It also provides analytic and visualization interfaces that connect directly to managed data sources for repeatable financial reporting.
- +Strong governance for models, data lineage, and audit-ready documentation
- +Scales analytics for large financial datasets with SAS performance features
- +End-to-end lifecycle tools for building, validating, and deploying models
- +Broad analytics library for forecasting, risk scoring, and anomaly detection
- +Integrated decisioning supports operational actions from analytic results
- –Requires SAS-centric architecture and admin skills for full effectiveness
- –Workflow setup can be heavy for small financial teams
- –Customization for niche financial data models may need specialist development
- –Interactive tooling can feel complex without standardized governance patterns
Best for: Enterprises modernizing governed risk and fraud analytics across multiple data domains
How to Choose the Right Financial Data Software
This buyer’s guide explains how to select Financial Data Software that serves governed financial analytics, interactive dashboards, and calculation-ready metric layers. It covers Databricks SQL, Snowflake, Amazon Redshift, Google BigQuery, Microsoft Power BI, Qlik Sense, Tableau, Apache Superset, Looker, and SAS Viya with tool-specific decision criteria.
What Is Financial Data Software?
Financial Data Software is used to ingest, model, govern, and query financial datasets so teams can produce repeatable reporting and analysis with controlled access. It commonly powers governed SQL analytics in platforms like Snowflake and BigQuery and then delivers interactive views through tools like Power BI and Tableau. It also standardizes financial metrics using semantic layers like Looker LookML so dashboards stay consistent across teams. Many implementations combine data governance features such as row-level security with performance features like materialized views or caching for recurring financial reporting workloads.
Key Features to Look For
These capabilities matter because financial teams need controlled access, repeatable definitions, and fast performance for both interactive variance work and scheduled reporting.
Governed access with row-level security in analytic queries
Row-level security enforced at the query layer keeps customer and transaction visibility restricted by user, group, or portfolio. Databricks SQL enforces row-level security in SQL queries, and Tableau restricts views by user, group, and data attributes.
Point-in-time analytics for reconciliation and backtesting
Point-in-time restore capabilities enable repeatable financial analysis even after upstream changes. Snowflake Time Travel supports point-in-time restores for repeatable backtests and point-in-time reconciliation.
Performance features for recurring reporting and drill-down
Performance accelerators reduce latency for dashboards and repeated aggregates. Google BigQuery materialized views accelerate recurring financial reporting queries, and Amazon Redshift materialized views speed repeated financial aggregations.
Elastic handling of bursty analyst and ETL workloads
Financial workloads spike during month-end reporting and risk model refresh cycles. Amazon Redshift concurrency scaling handles bursty analyst query traffic without resizing the cluster, and BigQuery’s parallel SQL execution helps process complex joins and aggregations on large datasets.
Semantic metric standardization using a governed modeling layer
A semantic layer prevents metric drift when multiple teams build dashboards and reuse definitions. Looker’s LookML provides reusable, governed measures and dimensions, and Power BI’s DAX calculation engine supports time intelligence and consistent financial measure logic.
Interactive exploration patterns for variance and scenario analysis
Interactive exploration determines how quickly teams move from a KPI to the underlying drivers. Qlik Sense’s associative analytics supports global selections across measures and dimensions for variance and what-if exploration, while Tableau provides drill-through from KPI to underlying transactions with calculated fields and parameters.
How to Choose the Right Financial Data Software
Selection works best by matching governance requirements, workload patterns, and metric standardization needs to tool-specific capabilities.
Start with the governance model required for financial datasets
If governed access must be enforced inside SQL queries, choose Databricks SQL because it enforces row-level security in SQL queries across Databricks datasets. If point-in-time governance and repeatability for reconciliation matter, choose Snowflake because it provides Time Travel for point-in-time restores.
Map workload shape to the platform performance features
If traffic bursts across analysts and ETL jobs happen during reporting cycles, choose Amazon Redshift because concurrency scaling handles spikes without resizing the cluster. If recurring dashboard queries need faster execution, choose Google BigQuery because materialized views accelerate repeated financial reporting queries.
Pick the metric definition strategy that prevents KPI drift
If a governed semantic layer is needed so all dashboards reuse the same metric logic, choose Looker because LookML standardizes financial measures, dimensions, and drill logic. If teams already build financial calculations in the Microsoft stack, choose Microsoft Power BI because DAX measures provide rolling totals and cohort metrics with time intelligence.
Choose an interactive reporting experience that matches how variance work happens
If interactive exploration should discover KPI relationships without predefined drill paths, choose Qlik Sense because its associative model explores relationships across financial metrics. If teams need drill-down from KPI to underlying transactions with scenario parameters, choose Tableau because it supports drill-through with calculated fields and parameters.
Ensure dashboard delivery fits the publishing and access pattern
If SQL-backed dashboards must support cross-filtered drill-down built on saved SQL queries, choose Apache Superset because it offers cross-filtered dashboards with interactive drill-down. If dashboards must embed directly into other operational applications while enforcing permissions, choose Looker because embedded dashboards pair with row-level controls and scheduled data refresh.
Who Needs Financial Data Software?
Financial Data Software supports a range of roles who need governed access, consistent metric logic, and fast analytics over financial datasets.
Financial analysts building governed SQL dashboards on curated data lakes
Databricks SQL fits this audience because it runs fast analytics with interactive dashboards over Delta Lake and enforces row-level security in SQL queries. It also supports SQL and notebook integration so metric definitions can be shared across governed workflows.
Financial teams running scalable governed analytics for risk, trading, and portfolio views
Snowflake fits because it separates compute and storage for elastic performance and includes Time Travel for repeatable point-in-time financial analysis. It also supports row-level security controls by portfolio, desk, or regulatory regime for governed access.
Financial teams on AWS running large-scale SQL analytics with recurring aggregations
Amazon Redshift fits because columnar storage accelerates large analytical SQL and workload management prioritizes mixed BI and ETL query patterns. Materialized views and concurrency scaling help teams handle repeated financial aggregations and analyst workload spikes.
Enterprises modernizing governed risk and fraud analytics across multiple data domains
SAS Viya fits because it provides model management with scoring and deployment integrated into a governed SAS analytics lifecycle. It also supports data preparation and advanced analytics across risk scoring, fraud workflows, and forecasting with audit-ready governance.
Common Mistakes to Avoid
Common failure points come from governance setup complexity, modeling complexity, and performance tuning that teams delay until reporting breaks during peak cycles.
Treating governance as a bolt-on instead of a built-in query control
Databricks SQL and Tableau both provide row-level security capabilities, but Databricks SQL requires advanced governance setup that depends on SQL and platform configuration skills. Apache Superset also has complex permission setups that become difficult for large financial organizations.
Skipping point-in-time requirements for reconciliation and repeatable backtests
Snowflake’s Time Travel is designed specifically for point-in-time restores and repeatable financial analyses, which helps avoid “moving target” results. Relying on systems without an equivalent point-in-time restore mechanism complicates backtesting workflows.
Overbuilding dashboard models without planning performance accelerators
BigQuery and Redshift rely on materialized views for faster repeated reporting queries and can require disciplined partitioning or clustering design for cost and latency control. Power BI and Tableau can require performance tuning for large models and high concurrency.
Allowing metric definitions to fragment across dashboards and charts
Looker uses LookML to enforce consistent financial metric definitions across teams, which reduces drift. Apache Superset can create fragmented custom metric definitions across datasets and charts if governance and documentation are not maintained.
How We Selected and Ranked These Tools
we evaluated Databricks SQL, Snowflake, Amazon Redshift, Google BigQuery, Microsoft Power BI, Qlik Sense, Tableau, Apache Superset, Looker, and SAS Viya by scoring every tool on three sub-dimensions: features with weight 0.4, ease of use with weight 0.3, and value with weight 0.3. The overall rating for each tool is the weighted average of those three sub-dimensions using overall = 0.40 × features + 0.30 × ease of use + 0.30 × value. Databricks SQL separated itself on features and execution fit because it combines interactive dashboards, fast SQL analytics over Delta Lake, and row-level security enforced in SQL queries for governed financial reporting latency.
Frequently Asked Questions About Financial Data Software
Which financial data software is best for governed SQL dashboards on a governed data lake?
How should teams choose between Snowflake and BigQuery for point-in-time financial reporting?
When is Redshift a better fit than other SQL analytics tools for bursty finance workloads?
Which tool works best when the finance workflow requires semantic metric definitions across teams?
What is the best option for interactive finance exploration that does not rely on predefined drill paths?
Which platform is strongest for month-end style reporting outputs with precise statement layout?
Which tool is best for building finance dashboards directly from SQL with minimal semantic layer work?
How can risk and fraud teams manage analytics governance plus model lifecycle in the same platform?
What tool helps finance teams enforce access controls at the row level inside dashboards?
Which software supports standardized refresh workflows for recurring finance KPIs like cash flow and margins?
Conclusion
After evaluating 10 data science analytics, Databricks SQL stands out as our overall top pick — it scored highest across our combined criteria of features, ease of use, and value, which is why it sits at #1 in the rankings above.
Use the comparison table and detailed reviews above to validate the fit against your own requirements before committing to a tool.
Tools reviewed
Primary sources checked during evaluation.
Referenced in the comparison table and product reviews above.
Keep exploring
Comparing two specific tools?
Software Alternatives
See head-to-head software comparisons with feature breakdowns, pricing, and our recommendation for each use case.
Explore software alternatives→In this category
Data Science Analytics alternatives
See side-by-side comparisons of data science analytics tools and pick the right one for your stack.
Compare data science analytics tools→FOR SOFTWARE VENDORS
Not on this list? Let’s fix that.
Our best-of pages are how many teams discover and compare tools in this space. If you think your product belongs in this lineup, we’d like to hear from you—we’ll walk you through fit and what an editorial entry looks like.
Apply for a ListingWHAT THIS INCLUDES
Where buyers compare
Readers come to these pages to shortlist software—your product shows up in that moment, not in a random sidebar.
Editorial write-up
We describe your product in our own words and check the facts before anything goes live.
On-page brand presence
You appear in the roundup the same way as other tools we cover: name, positioning, and a clear next step for readers who want to learn more.
Kept up to date
We refresh lists on a regular rhythm so the category page stays useful as products and pricing change.