GITNUXSOFTWARE ADVICE
Environment EnergyTop 10 Best Energy Reporting Software of 2026
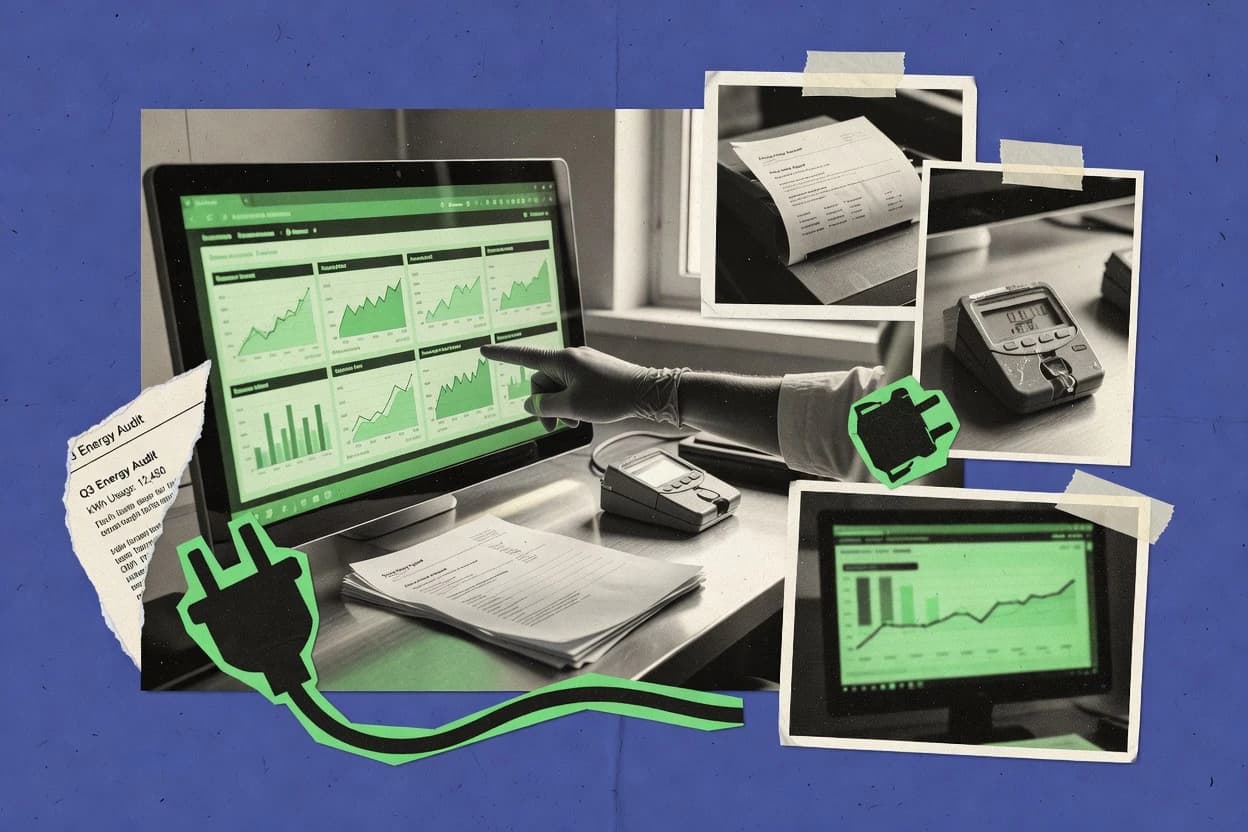
Compare the Top 10 Energy Reporting Software picks for ESG and carbon reporting, including Sphera, Watershed, and Ideagen. Explore the ranking.

How we ranked these tools
Core product claims cross-referenced against official documentation, changelogs, and independent technical reviews.
Analyzed video reviews and hundreds of written evaluations to capture real-world user experiences with each tool.
AI persona simulations modeled how different user types would experience each tool across common use cases and workflows.
Final rankings reviewed and approved by our editorial team with authority to override AI-generated scores based on domain expertise.
Score: Features 40% · Ease 30% · Value 30%
Gitnux may earn a commission through links on this page — this does not influence rankings. Editorial policy
Editor’s top 3 picks
Three quick recommendations before you dive into the full comparison below — each one leads on a different dimension.
Sphera Energy & Carbon Management
Audit-ready calculation engine that ties factor-based emissions results to traceable input data
Built for enterprises managing multi-site inventories and repeatable audit-ready reporting workflows.
Watershed
Audit-ready calculation traceability across energy inputs, factors, and reporting outputs
Built for companies standardizing energy data, emissions calculations, and disclosure workflows at scale.
Ideagen Sustainability
Evidence-backed review workflows for energy and emissions reporting.
Built for organizations standardizing energy reporting with governance and audit evidence..
Related reading
Comparison Table
This comparison table evaluates energy reporting and sustainability management software, including Sphera Energy & Carbon Management, Watershed, Ideagen Sustainability, OneTrust Sustainability, and FigBytes. It helps readers compare capabilities such as data collection and validation, emissions and energy calculations, reporting workflows, audit support, and integration coverage across major enterprise systems. Use the side-by-side view to narrow tools based on how they handle reporting requirements and operational data at scale.
| # | Tool | Category | Overall | Features | Ease of Use | Value |
|---|---|---|---|---|---|---|
| 1 | Sphera Energy & Carbon Management Enables energy data management, carbon accounting, and reporting workflows for organizations that need audit-ready emissions and energy reporting. | enterprise | 9.1/10 | 9.5/10 | 8.9/10 | 8.9/10 |
| 2 | Watershed Centralizes emissions, energy, and supplier activity data to produce reporting outputs for carbon programs and energy-related disclosures. | sustainability reporting | 8.8/10 | 8.7/10 | 9.1/10 | 8.7/10 |
| 3 | Ideagen Sustainability Supports sustainability and emissions workflows with controlled data collection and reporting processes designed for ESG assurance needs. | compliance reporting | 8.6/10 | 8.4/10 | 8.5/10 | 8.8/10 |
| 4 | OneTrust Sustainability Manages sustainability data and reporting processes for environmental disclosure with governance features that support audit trails. | governance | 8.3/10 | 8.0/10 | 8.6/10 | 8.4/10 |
| 5 | FigBytes Automates energy and emissions data capture and reporting for enterprises using integrations with meter and utility data sources. | data automation | 8.0/10 | 8.0/10 | 8.1/10 | 7.9/10 |
| 6 | Nexthink Sustainability Delivers energy and sustainability reporting capabilities tied to business processes and performance tracking across operations. | operations analytics | 7.7/10 | 7.7/10 | 7.5/10 | 7.8/10 |
| 7 | ecologi Tracks climate impact activities and supports reporting outputs for organizations that run offset and sustainability programs tied to energy actions. | climate program | 7.4/10 | 7.2/10 | 7.6/10 | 7.6/10 |
| 8 | Dataloop.ai Applies data pipelines and governance features to structure energy and emissions datasets for downstream reporting and analysis. | data platform | 7.1/10 | 7.2/10 | 7.1/10 | 7.1/10 |
| 9 | Aera Energy Reporting Centralizes energy consumption, utility data, and reporting outputs used for energy management and environmental reporting processes. | energy analytics | 6.9/10 | 6.8/10 | 6.7/10 | 7.1/10 |
| 10 | IBM Environmental Intelligence Suite Uses environmental data models and analytics to support energy-related insights and reporting aligned to organizational sustainability targets. | enterprise | 6.6/10 | 6.8/10 | 6.5/10 | 6.3/10 |
Enables energy data management, carbon accounting, and reporting workflows for organizations that need audit-ready emissions and energy reporting.
Centralizes emissions, energy, and supplier activity data to produce reporting outputs for carbon programs and energy-related disclosures.
Supports sustainability and emissions workflows with controlled data collection and reporting processes designed for ESG assurance needs.
Manages sustainability data and reporting processes for environmental disclosure with governance features that support audit trails.
Automates energy and emissions data capture and reporting for enterprises using integrations with meter and utility data sources.
Delivers energy and sustainability reporting capabilities tied to business processes and performance tracking across operations.
Tracks climate impact activities and supports reporting outputs for organizations that run offset and sustainability programs tied to energy actions.
Applies data pipelines and governance features to structure energy and emissions datasets for downstream reporting and analysis.
Centralizes energy consumption, utility data, and reporting outputs used for energy management and environmental reporting processes.
Uses environmental data models and analytics to support energy-related insights and reporting aligned to organizational sustainability targets.
Sphera Energy & Carbon Management
enterpriseEnables energy data management, carbon accounting, and reporting workflows for organizations that need audit-ready emissions and energy reporting.
Audit-ready calculation engine that ties factor-based emissions results to traceable input data
Sphera Energy & Carbon Management stands out by unifying energy use and emissions reporting with audit-ready calculation workflows and data lineage controls. The solution supports structured collection of activity data, energy factors, and emissions factors to produce consistent inventories across reporting scopes. Strong model-based management enables scenario reviews, reduction planning inputs, and standardized reporting outputs for internal and external disclosures. Configuration supports industry-aligned reporting structures and repeatable calculations across sites, assets, and organizational boundaries.
Pros
- Audit-ready calculation workflows with controlled inputs and traceable data lineage
- Configurable emissions calculation using activity, energy, and emissions factors
- Standardized reporting outputs across scopes, sites, and organizational structures
- Supports scenario comparisons for energy and carbon reduction planning
- Centralizes energy and emissions data to reduce reconciliation effort
Cons
- Complex configuration can slow onboarding for smaller reporting teams
- Data quality issues propagate quickly through factor-driven calculations
- Advanced modeling setup requires specialized process and reporting knowledge
- Bulk data imports may need careful mapping to match reporting structures
Best For
Enterprises managing multi-site inventories and repeatable audit-ready reporting workflows
More related reading
Watershed
sustainability reportingCentralizes emissions, energy, and supplier activity data to produce reporting outputs for carbon programs and energy-related disclosures.
Audit-ready calculation traceability across energy inputs, factors, and reporting outputs
Watershed centers energy and emissions reporting on converting utility and activity data into audit-ready disclosures. The platform supports structured ESG reporting workflows and automates calculations for Scope 1, Scope 2, and Scope 3 categories. It includes data validation and governance to keep source documents and assumptions traceable. Reporting outputs are designed for internal review and external submission through organized metrics and supplier-ready calculations.
Pros
- Automates emissions calculations from utility and activity inputs
- Scope 1, 2, and 3 coverage with configurable calculation logic
- Audit trails link assumptions to underlying source data
- Workflow controls support review and approvals for reporting cycles
- Supplier emissions inputs help scale upstream Scope 3 data
Cons
- Category-specific setup can be heavy for complex Scope 3 programs
- Imports require clean, well-structured source data to avoid rework
- Reporting customization may require specialist configuration and guidance
- Template-driven outputs can limit highly bespoke disclosure formats
Best For
Companies standardizing energy data, emissions calculations, and disclosure workflows at scale
Ideagen Sustainability
compliance reportingSupports sustainability and emissions workflows with controlled data collection and reporting processes designed for ESG assurance needs.
Evidence-backed review workflows for energy and emissions reporting.
Ideagen Sustainability focuses on energy reporting workflows with structured data collection and audit-ready evidence capture. It supports ESG and sustainability reporting processes that connect emissions, energy consumption, and supporting documentation into consistent reports. The solution emphasizes governance through controlled data inputs, change tracking, and review workflows. It is positioned for teams that need repeatable reporting cycles rather than one-off spreadsheets.
Pros
- Workflow-driven energy data collection with evidence trails for audits
- Structured reporting inputs reduce manual spreadsheet cleanup
- Review and approval controls support governance across reporting cycles
Cons
- Setup requires strong data mapping from source systems
- Reporting model complexity can slow initial configuration
- Less suited for purely ad hoc energy analysis without formal workflows
Best For
Organizations standardizing energy reporting with governance and audit evidence.
OneTrust Sustainability
governanceManages sustainability data and reporting processes for environmental disclosure with governance features that support audit trails.
Evidence-first sustainability workflows that tie calculations to auditable source documentation
OneTrust Sustainability stands out for centralizing energy and ESG evidence within a governed compliance workflow. The solution supports structured data capture for emissions and energy reporting, including audit-friendly documentation trails. It also emphasizes cross-functional controls such as permissions, approvals, and standardized submissions. Reporting output is built around traceable inputs so organizations can connect calculations to underlying source evidence.
Pros
- Workflow-driven energy reporting with evidence capture for audit readiness
- Governed approvals and role-based access for controlled submissions
- Centralized sustainability data model reduces spreadsheet handoffs
- Traceable inputs help link calculations to source documentation
- Configurable reporting structures support multiple internal reporting needs
Cons
- Implementation often requires strong data mapping and process setup
- Complex program structures can increase configuration effort
- Advanced reporting customization depends on admin configuration
- Non-standard data sources may need preprocessing for clean ingestion
- Teams may need training to maintain consistent data definitions
Best For
Enterprises standardizing energy and emissions reporting with governed workflows and audit trails
FigBytes
data automationAutomates energy and emissions data capture and reporting for enterprises using integrations with meter and utility data sources.
Audit-ready calculation and reporting workflow with approval tracking
FigBytes focuses on energy and sustainability reporting workflows that turn meter, utility, and operational data into audit-ready reporting outputs. The tool supports data aggregation, normalization, and calculation logic so energy totals and emissions metrics can be produced from messy source files. Collaboration features help teams review, approve, and track reporting changes across reporting cycles. Exportable reports and structured records support consistent submissions and internal governance.
Pros
- Energy reporting workflow tailored to utilities, meters, and operational data
- Structured calculations convert raw inputs into consistent metrics
- Review and approval steps support controlled reporting changes
- Exports provide reporting-ready outputs for internal and external use
Cons
- Setup requires careful mapping of source data fields
- Reporting customization can feel rigid for highly bespoke calculation models
- Complex multi-site configurations can increase data management effort
Best For
Teams producing repeatable energy and emissions reports across multiple sites
Nexthink Sustainability
operations analyticsDelivers energy and sustainability reporting capabilities tied to business processes and performance tracking across operations.
Experience-based sustainability reporting that links endpoint usage to energy and carbon impact
Nexthink Sustainability stands out by tying IT usage data to measurable sustainability outcomes. It uses end-user experience telemetry to quantify energy and carbon impacts across endpoints and applications. Built-in reporting supports audits, trend analysis, and evidence-ready dashboards for sustainability and IT teams. Workflow views help connect inefficient software usage patterns to actions that reduce resource consumption.
Pros
- Connects IT experience telemetry to sustainability metrics for defensible reporting
- Delivers audit-ready dashboards for energy and carbon trend visibility
- Maps application and endpoint usage patterns to reduction actions
Cons
- Relies on accurate instrumentation of endpoints for reporting credibility
- Energy and carbon attribution may require careful model alignment across environments
- Action workflows depend on process adoption beyond data visibility
Best For
Enterprises needing IT-driven energy reporting with experience-based evidence and dashboards
ecologi
climate programTracks climate impact activities and supports reporting outputs for organizations that run offset and sustainability programs tied to energy actions.
Verified impact project linking that connects reported reductions to supported climate actions
Ecologi stands out by combining business climate reporting with verified impact actions tied to carbon claims. The platform supports emissions tracking workflows and records reductions from energy-related activities alongside broader climate projects. Users can generate report-ready outputs for sustainability audiences and maintain an evidence trail for actions taken. Ecologi also emphasizes transparency by linking reporting data to the underlying supported projects.
Pros
- Links emissions reporting with verified impact projects for audit-ready evidence
- Centralizes emissions calculations and sustainability reporting workflows
- Produces shareable reports for stakeholders and management reviews
- Maintains activity-level records that support traceable claims
Cons
- Energy reporting depth can be narrower than specialized auditors
- Granular meter-level inputs may be limited for complex facilities
- Project-linked reporting can require cleanup of imported data
Best For
Teams needing action-linked emissions reporting with clear project traceability
Dataloop.ai
data platformApplies data pipelines and governance features to structure energy and emissions datasets for downstream reporting and analysis.
Human-in-the-loop review workflows that connect annotations to versioned dataset artifacts
Dataloop.ai stands out for managing energy datasets with reviewable AI workflows that tie labels, assets, and model changes to traceable artifacts. It supports human-in-the-loop annotation, dataset versioning, and pipeline execution that help teams keep measurement and inspection data consistent. Energy teams can standardize how images, sensor outputs, and document evidence are ingested, labeled, validated, and promoted into training sets. The platform also emphasizes governance features like permissions and audit trails to support regulated reporting workflows.
Pros
- Dataset versioning links changes to labels, assets, and model runs
- Human-in-the-loop labeling with review and approval workflows
- Reusable AI pipelines standardize energy data processing steps
- Audit trails and permissions support governance for reporting teams
Cons
- Workflow setup requires careful configuration of labeling and approval stages
- Custom integrations for specific energy systems may require engineering effort
- Interface complexity can slow teams running small, one-off labeling tasks
Best For
Teams curating regulated energy datasets with reviewable AI pipelines
Aera Energy Reporting
energy analyticsCentralizes energy consumption, utility data, and reporting outputs used for energy management and environmental reporting processes.
Audit-ready workflow trails that connect submissions, approvals, and reported metrics.
Aera Energy Reporting stands out for turning energy and emissions reporting into structured, repeatable workflows that map to reporting requirements. The platform supports data collection, normalization, and audit-ready documentation so reporting teams can trace inputs to outputs. It emphasizes scenario planning and change tracking so forecasts and reported figures remain consistent across reporting cycles. Collaboration features help multiple contributors manage submissions, reviews, and approvals.
Pros
- Workflow-driven reporting that standardizes data collection and approvals
- Audit-ready documentation links reported figures to underlying inputs
- Scenario planning supports forecasting changes across reporting cycles
- Collaboration tools manage submissions, reviews, and approvals
Cons
- Setup of reporting structure can take time for new reporting programs
- Complex source data mapping may require careful onboarding
- Advanced analytics depend on how data is modeled in the workflow
Best For
Energy and sustainability teams producing repeatable, audit-friendly reporting cycles
IBM Environmental Intelligence Suite
enterpriseUses environmental data models and analytics to support energy-related insights and reporting aligned to organizational sustainability targets.
Emissions reporting with validated calculations tied to asset and location context
IBM Environmental Intelligence Suite stands out by combining environmental data intelligence with energy reporting workflows. It supports emissions and sustainability reporting using structured datasets, validations, and audit-ready outputs. The suite connects operational context like locations and assets to reporting calculations for more traceable results. It is built for organizations that need recurring reporting with governance controls.
Pros
- Audit-ready reporting outputs with traceable data lineage across calculations
- Strong emissions and sustainability reporting workflows for recurring submissions
- Location and asset context improves calculation consistency across reports
- Governance features support review, approvals, and controlled reporting
- Integrates environmental intelligence data to reduce manual data preparation
Cons
- Complex configuration can slow deployment for smaller reporting teams
- Data quality issues propagate through calculations without strong upstream controls
- Reporting customization may require specialized admin or configuration support
- Best results depend on consistent asset and location master data
Best For
Enterprises needing governed, repeatable environmental and energy reporting with traceable calculations
How to Choose the Right Energy Reporting Software
This buyer’s guide explains how to choose Energy Reporting Software using concrete capabilities from Sphera Energy & Carbon Management, Watershed, Ideagen Sustainability, OneTrust Sustainability, and FigBytes. It also covers where Nexthink Sustainability, ecologi, Dataloop.ai, Aera Energy Reporting, and IBM Environmental Intelligence Suite fit when the reporting need extends beyond classic utility billing totals. The guide maps key selection criteria to the actual workflow, governance, and audit-readiness strengths of these tools.
What Is Energy Reporting Software?
Energy Reporting Software centralizes energy consumption inputs and turns them into auditable reporting outputs for internal disclosures and external submissions. It typically supports structured data collection, factor-based calculations for emissions, and workflow controls that connect reported figures back to source evidence. Tools like Sphera Energy & Carbon Management and Watershed focus on repeatable Scope 1, Scope 2, and Scope 3 calculations that preserve traceability across inputs, factors, and outputs. Other platforms like Ideagen Sustainability and OneTrust Sustainability emphasize evidence-first review workflows and governed approvals around the reporting process.
Key Features to Look For
Evaluating Energy Reporting Software with the same feature lens across tools prevents surprises during onboarding and during audit cycles.
Audit-ready factor-based calculation with traceable inputs
Sphera Energy & Carbon Management ties factor-based emissions results to traceable input data through an audit-ready calculation engine. Watershed delivers audit-ready calculation traceability that links energy inputs, calculation factors, and reporting outputs.
Evidence-first review workflows with audit trails
Ideagen Sustainability connects emissions and energy reporting data with review and approval controls that capture evidence for assurance needs. OneTrust Sustainability also centers workflows on audit-friendly documentation trails and traceable inputs for controlled submissions.
Governed permissions and controlled approvals for reporting cycles
OneTrust Sustainability provides role-based access and governed approvals that keep submissions controlled across cross-functional teams. FigBytes supports review and approval steps that track reporting changes across reporting cycles.
Structured scope coverage with configurable calculation logic
Watershed supports Scope 1, Scope 2, and Scope 3 coverage with configurable calculation logic that converts utility and activity data into reporting outputs. Sphera Energy & Carbon Management supports configurable emissions calculations using activity, energy, and emissions factors to produce consistent inventories across reporting scopes.
Scenario planning and repeatable reporting cycle consistency
Sphera Energy & Carbon Management supports scenario reviews that enable energy and carbon reduction planning inputs to flow into standardized reporting outputs. Aera Energy Reporting adds scenario planning with change tracking so forecasts and reported figures stay consistent across reporting cycles.
Data preparation and normalization for messy source inputs
FigBytes focuses on structured calculations that normalize meter, utility, and operational data into consistent energy and emissions metrics. IBM Environmental Intelligence Suite improves calculation consistency by connecting operational context like locations and assets to emissions reporting calculations.
How to Choose the Right Energy Reporting Software
Picking the right tool starts with matching calculation traceability needs and workflow governance needs to the reporting scope and data sources used in the organization.
Start with audit traceability requirements for emissions calculations
If emissions calculations must remain defensible down to the factor and input lineage, start with Sphera Energy & Carbon Management because it uses an audit-ready calculation engine that ties results to traceable input data. If traceability must also cover energy inputs, factors, and reporting outputs with workflow controls, Watershed provides audit-ready calculation traceability across those elements.
Match workflow governance to internal review and external submission needs
For organizations that need evidence-backed review workflows with controlled data inputs and change tracking, Ideagen Sustainability supports structured data collection with evidence trails designed for audits. For enterprises that require role-based access and governed approvals tied to auditable source documentation, OneTrust Sustainability centralizes energy and ESG evidence within governed compliance workflows.
Confirm Scope coverage and configuration fit for the actual reporting program complexity
For teams standardizing Scope 1, Scope 2, and Scope 3 calculations at scale, Watershed automates emissions calculations from utility and activity inputs while maintaining audit trails that link assumptions to source data. For multi-site organizations needing repeatable inventories across sites and organizational boundaries, Sphera Energy & Carbon Management supports standardized reporting outputs across scopes, sites, and organizational structures.
Validate input readiness and the level of data mapping required
If source data is consistently clean and structured, tools like Watershed can reduce rework by automating calculations from utility and activity inputs. If source files are often messy, FigBytes emphasizes aggregation, normalization, and calculation logic that converts messy source files into consistent metrics after careful mapping of source fields.
Choose an option based on the evidence model, not only the output format
If the reporting process needs evidence that links actions to verified projects, ecologi connects emissions reporting with verified impact actions and maintains activity-level records that support traceable claims. If the reporting need depends on IT endpoint usage telemetry, Nexthink Sustainability links endpoint usage patterns to measurable energy and carbon impacts through experience-based evidence and audit-ready dashboards.
Who Needs Energy Reporting Software?
Energy Reporting Software is used by organizations that must convert energy data into auditable emissions and energy disclosures with repeatable cycles.
Multi-site enterprises needing repeatable audit-ready energy and carbon inventories
Sphera Energy & Carbon Management fits multi-site programs because it centralizes energy and emissions data and produces standardized reporting outputs across scopes, sites, and organizational boundaries. This tool also supports scenario comparisons and reduction planning inputs using a traceable factor-based calculation engine.
Companies standardizing Scope 1, Scope 2, and Scope 3 reporting workflows at scale
Watershed is designed for organizations that need automated emissions calculations from utility and activity inputs across Scope 1, Scope 2, and Scope 3. It adds audit trails that link assumptions to underlying source data and includes workflow controls for review and approvals.
Organizations standardizing energy reporting with formal governance and assurance evidence
Ideagen Sustainability is built around workflow-driven energy data collection with evidence trails for audits and review and approval controls that support governance across reporting cycles. OneTrust Sustainability also emphasizes governed compliance workflows with permissions, approvals, and audit-friendly documentation trails tied to traceable inputs.
Teams producing repeatable multi-site energy and emissions reports with controlled change tracking
FigBytes supports structured calculations that convert raw meter, utility, and operational inputs into consistent metrics and emissions outputs. It also includes collaboration features with review and approval steps that track reporting changes across reporting cycles.
Common Mistakes to Avoid
Selection mistakes in this category usually show up as broken traceability, fragile data mapping, or workflows that do not match how teams review and approve disclosures.
Choosing a tool without an explicit calculation lineage model
Tools like Sphera Energy & Carbon Management and Watershed explicitly tie factor-based emissions results to traceable inputs and maintain audit trails linking assumptions to source data. Skipping lineage-focused capabilities increases reconciliation effort when reported figures do not match source documents.
Underestimating the onboarding effort for factor-driven and workflow-driven setups
Sphera Energy & Carbon Management has complex configuration that can slow onboarding for smaller reporting teams, especially when advanced modeling setup is required. Ideagen Sustainability and OneTrust Sustainability also require strong data mapping and can increase configuration effort when reporting model complexity grows.
Assuming data imports will work without clean, well-structured source fields
Watershed requires clean and well-structured source data because imports that are not organized can create rework for category-specific setup. FigBytes also requires careful mapping of source data fields because normalization and calculation logic depend on accurate input structure.
Selecting an evidence model that does not match the kind of proof the organization needs
Nexthink Sustainability relies on accurate instrumentation of endpoints for reporting credibility, which means teams must ensure telemetry coverage before expecting audit-ready dashboards. ecologi is most aligned with action-linked emissions evidence because it ties claims to verified impact projects, so it can feel narrower for facilities needing deeper meter-level reporting.
How We Selected and Ranked These Tools
We evaluated each of the 10 energy reporting tools on three sub-dimensions. Features received a weight of 0.4. Ease of use received a weight of 0.3. Value received a weight of 0.3. The overall rating is the weighted average calculated as overall = 0.40 × features + 0.30 × ease of use + 0.30 × value. Sphera Energy & Carbon Management separated from lower-ranked tools through high scoring capabilities tied to audit-ready calculation workflows that connect factor-based emissions results to traceable input data, which directly strengthened the features dimension and supported repeatable multi-site reporting.
Frequently Asked Questions About Energy Reporting Software
Which energy reporting platforms produce audit-ready calculation trails tied to input data and factors?
Sphera Energy & Carbon Management provides an audit-ready calculation engine that connects factor-based emissions results to traceable input data through factor and activity datasets. Watershed and OneTrust Sustainability also emphasize traceability by validating source inputs and maintaining evidence trails that support internal review and external submission.
What are the best tools for standardizing Scope 1, Scope 2, and Scope 3 energy and emissions workflows across multiple sites?
Watershed automates Scope 1, Scope 2, and Scope 3 calculations from utility and activity data using structured ESG workflows. Sphera Energy & Carbon Management is built for repeatable multi-site inventories with consistent reporting structures across assets and organizational boundaries.
Which platforms are strongest for evidence-backed reviews with controlled change tracking?
Ideagen Sustainability focuses on structured data collection tied to audit-ready evidence capture with governed inputs and change tracking. FigBytes adds collaboration and approval tracking so teams can review, approve, and record reporting changes across reporting cycles.
How do these tools handle data quality issues like messy files, normalization, and aggregation?
FigBytes is designed to transform meter and utility exports into audit-ready outputs by normalizing inputs and applying calculation logic across aggregation layers. Aera Energy Reporting also supports data collection and normalization so inputs remain traceable from submitted datasets to reported metrics.
Which energy reporting solutions connect emissions reporting to external actions or verified project reductions?
Ecologi supports emissions tracking workflows that link reported reductions to supported climate projects with a transparent evidence trail. This action-linked model differs from tools like Watershed and Sphera, which concentrate on factor-based calculations and disclosure-ready reporting from energy and emissions inputs.
Which option fits organizations that need IT telemetry-based sustainability reporting from endpoint usage?
Nexthink Sustainability ties end-user experience telemetry to measurable energy and carbon impacts across endpoints and applications. This approach supports dashboards and audit-ready reporting based on usage patterns, which is distinct from utility-data-first workflows used by Sphera and Watershed.
What platforms best support governed collaboration across many contributors with approvals and permissions?
OneTrust Sustainability centralizes energy and ESG evidence in a governed compliance workflow with permissions, approvals, and standardized submissions. Aera Energy Reporting also supports multiple contributors with scenario planning and change tracking so forecasts and reported figures stay consistent across cycles.
Which tools are suited for teams that need scenario planning and consistency between forecasts and reported figures?
Sphera Energy & Carbon Management includes model-based management for scenario reviews and reduction planning inputs that feed standardized reporting outputs. Aera Energy Reporting provides scenario planning plus change tracking so forecasted assumptions remain consistent with later reported figures.
Which solutions connect structured environmental datasets to asset and location context for traceable calculations?
IBM Environmental Intelligence Suite links environmental data intelligence to reporting workflows using validations and audit-ready outputs tied to locations and assets. Sphera Energy & Carbon Management similarly emphasizes configurable reporting structures across sites and organizational boundaries, which supports traceable calculation context.
How do AI-focused data platforms fit into energy reporting workflows that require evidence and dataset governance?
Dataloop.ai manages energy datasets using reviewable human-in-the-loop AI workflows that tie labels, assets, and model changes to traceable artifacts. This complements tools like Ideagen Sustainability by strengthening the dataset governance layer that feeds audit-ready evidence, labels, and validated measurement inputs.
Conclusion
After evaluating 10 environment energy, Sphera Energy & Carbon Management stands out as our overall top pick — it scored highest across our combined criteria of features, ease of use, and value, which is why it sits at #1 in the rankings above.
Use the comparison table and detailed reviews above to validate the fit against your own requirements before committing to a tool.
Tools reviewed
Referenced in the comparison table and product reviews above.
Keep exploring
Comparing two specific tools?
Software Alternatives
See head-to-head software comparisons with feature breakdowns, pricing, and our recommendation for each use case.
Explore software alternatives→In this category
Environment Energy alternatives
See side-by-side comparisons of environment energy tools and pick the right one for your stack.
Compare environment energy tools→FOR SOFTWARE VENDORS
Not on this list? Let’s fix that.
Our best-of pages are how many teams discover and compare tools in this space. If you think your product belongs in this lineup, we’d like to hear from you—we’ll walk you through fit and what an editorial entry looks like.
Apply for a ListingWHAT THIS INCLUDES
Where buyers compare
Readers come to these pages to shortlist software—your product shows up in that moment, not in a random sidebar.
Editorial write-up
We describe your product in our own words and check the facts before anything goes live.
On-page brand presence
You appear in the roundup the same way as other tools we cover: name, positioning, and a clear next step for readers who want to learn more.
Kept up to date
We refresh lists on a regular rhythm so the category page stays useful as products and pricing change.