GITNUXSOFTWARE ADVICE
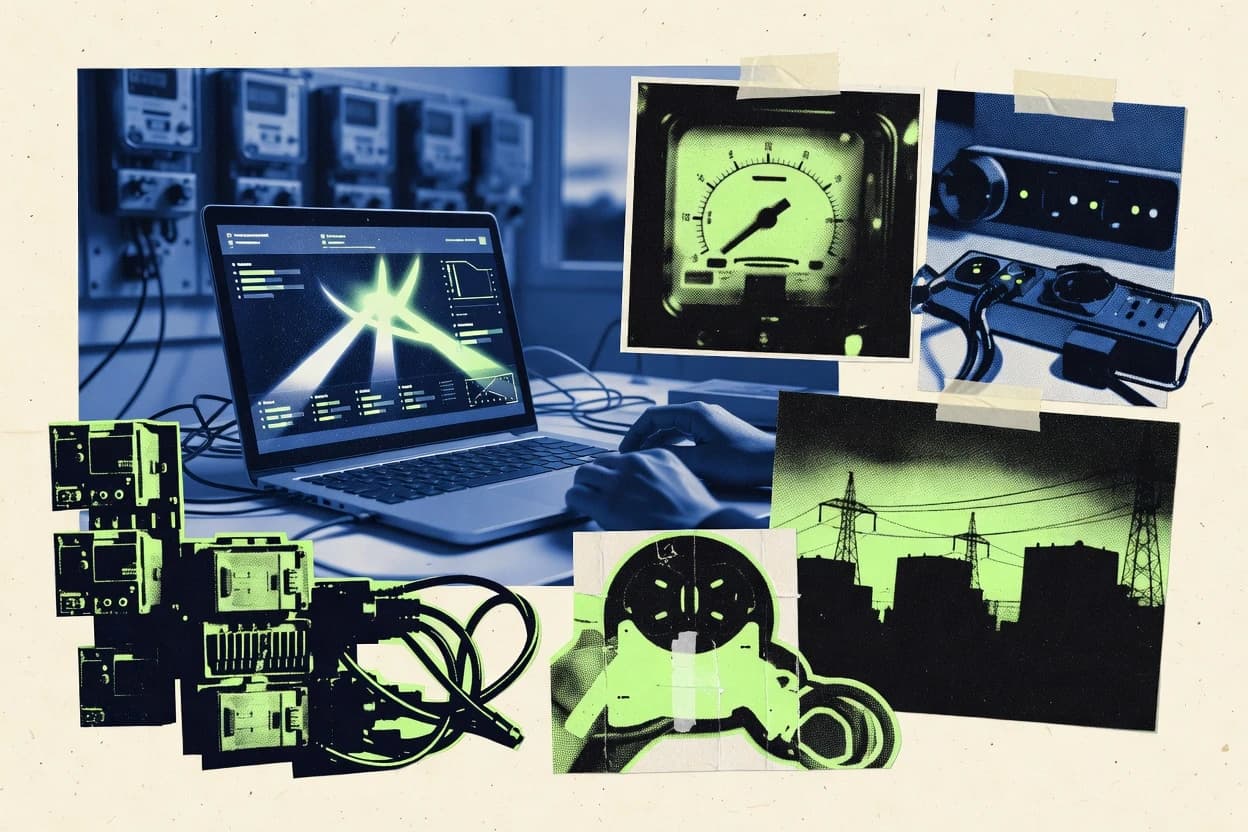
Environment EnergyTop 10 Best Energy Management Dashboard Software of 2026
Compare the Top 10 Best Energy Management Dashboard Software of 2026 with rankings and key features. Explore the best picks.

How we ranked these tools
Core product claims cross-referenced against official documentation, changelogs, and independent technical reviews.
Analyzed video reviews and hundreds of written evaluations to capture real-world user experiences with each tool.
AI persona simulations modeled how different user types would experience each tool across common use cases and workflows.
Final rankings reviewed and approved by our editorial team with authority to override AI-generated scores based on domain expertise.
Score: Features 40% · Ease 30% · Value 30%
Gitnux may earn a commission through links on this page — this does not influence rankings. Editorial policy
Editor’s top 3 picks
Three quick recommendations before you dive into the full comparison below — each one leads on a different dimension.
EnergyCAP
Savings project tracking with measurement and verification style documentation
Built for organizations managing multi-site energy accounting and project savings validation.
Sense
Editor pickAppliance identification with Whole-Home monitoring and on-dashboard anomaly alerts
Built for homeowners seeking appliance-level energy insights and anomaly alerts.
Enel X Way
Editor pickAutomated energy management workflows linked to monitored distributed energy resources
Built for utilities and energy operators managing multi-site assets with real-time control.
Related reading
Comparison Table
This comparison table evaluates EnergyCAP, Sense, Enel X Way, Smappee, Ember Energy, and other energy management dashboard platforms based on the data they capture, how that data is visualized, and the control or automation features they support. Readers can use the side-by-side view to compare reporting depth, deployment requirements, monitoring scope, and integrations that determine how each tool fits into a specific energy monitoring workflow.
EnergyCAP
enterpriseEnergyCAP provides utility bill tracking, benchmarking, and dashboard reporting with energy savings workflows for facilities and organizations.
Savings project tracking with measurement and verification style documentation
EnergyCAP stands out with utility-grade energy accounting and budgeting designed for facilities and multi-site portfolios. The dashboard unifies utility data, interval trends, and cost allocation to support forecasting and variance reporting.
EnergyCAP also drives structured project and tracking workflows using savings documentation and measurement logic. The result is a reporting layer that connects consumption performance to operational actions and capital planning.
- +Strong utility data normalization for consistent portfolio reporting
- +Variance and forecast reporting ties usage changes to cost impacts
- +Savings tracking supports documented energy projects end to end
- +Multi-site dashboards enable rollups across buildings and regions
- +Interval analytics reveal peaks, baselines, and performance drift
- –Dashboard setup can be time-consuming without clean source data
- –Advanced configuration requires analytics discipline across sites
- –Reporting customization may lag behind teams needing bespoke metrics
- –Some workflows feel heavy for small portfolios with few meters
Best for: Organizations managing multi-site energy accounting and project savings validation
Sense
consumer monitoringSense provides appliance-level energy monitoring and interactive dashboards that visualize real-time energy use at the household level.
Appliance identification with Whole-Home monitoring and on-dashboard anomaly alerts
Sense stands out for using device-level monitoring and circuit-level insights to translate household energy data into actionable usage patterns. The dashboard highlights which appliances drive consumption and shows how energy use changes by time of day. Sense also supports automated anomaly detection to flag unusual consumption that may indicate waste or developing issues.
- +Device-level energy identification using whole-home and circuit signals
- +Time-based analytics reveal peak usage patterns by household and appliance
- +Automated anomaly detection flags unusual consumption changes
- –Setup depends on compatible wiring and may require professional help
- –Lower visibility for complex systems like multi-panel or shared meters
- –Insights remain household-focused and less suited for large portfolios
Best for: Homeowners seeking appliance-level energy insights and anomaly alerts
Enel X Way
distributed energyEnel X Way offers energy management software with energy analytics dashboards for distributed energy resources, storage, and load control.
Automated energy management workflows linked to monitored distributed energy resources
Enel X Way stands out for integrating energy analytics with grid and asset visibility into one operational dashboard for utilities and energy operators. Core capabilities include real-time monitoring, performance analytics, and automated energy management workflows tied to distributed energy resources and controllable assets.
The platform supports scenario-based planning and KPI reporting for operational decision-making and demand or generation optimization. Enel X Way also provides data connectivity to internal systems so teams can manage energy performance across sites with centralized visibility.
- +Real-time energy monitoring for assets and energy flows
- +KPI dashboards for performance tracking and operational reporting
- +Scenario planning for generation and demand optimization
- +Automated energy management workflows for controllable assets
- –Best value depends on Enel X integration partners
- –Advanced analytics require solid data quality and system alignment
- –Multi-site rollout can be heavy for small teams
- –Workflow configuration depth may slow early deployments
Best for: Utilities and energy operators managing multi-site assets with real-time control
Smappee
smart energySmappee provides real-time energy dashboards and smart energy management features that connect to power and monitoring devices.
Real-time energy visibility down to circuits and locations
Smappee stands out for turning building and energy hardware data into an interactive energy management dashboard. It supports real-time monitoring, historical consumption views, and energy insights tied to meters and connected devices.
The platform focuses on identifying usage patterns and highlighting operational changes across electrical circuits and locations. It is built to help facilities teams track performance and spot abnormal energy behavior quickly.
- +Real-time monitoring from connected energy meters and sensors
- +Historical dashboards for consumption trends and comparisons
- +Circuit and location visibility for faster root-cause analysis
- +Action-oriented insights for abnormal usage detection
- –Dashboard setup can be hardware dependent and time consuming
- –Advanced analysis relies on correct meter mapping
- –Reporting customization is limited versus dedicated analytics tools
- –Multi-site rollups require careful configuration
Best for: Facilities teams managing metered electrical loads across buildings
Ember Energy
meter analyticsEmber Energy aggregates smart meter and data feeds to visualize energy consumption on dashboards and support planning for efficiency actions.
Device-level energy breakdown with time-of-day recommendations for targeted household optimizations
Ember Energy stands out by focusing on actionable home energy optimization rather than generic energy charts. The dashboard organizes real-time consumption, device-level usage, and time-of-day patterns into clear views.
It supports automated insights that help reduce waste through targeted recommendations. The workflow emphasizes day-to-day improvements with trend tracking across sessions.
- +Device-level visibility ties loads to specific household equipment
- +Real-time consumption cards make spikes easy to diagnose
- +Time-of-day analytics highlight high-usage periods for action
- +Recommendation-driven layout guides energy-saving decisions quickly
- +Trend history supports follow-up checks after changes
- –Insights can feel household-specific instead of grid-focused
- –Advanced customization options are limited for complex setups
- –Dashboard depth may be insufficient for multi-site reporting
- –Integration flexibility may lag behind broader smart home ecosystems
Best for: Households seeking device-level energy savings through clear dashboards and recommendations
Acuity Brands Energy Management
building systemsAcuity Brands supports energy monitoring and management through connected lighting and building systems dashboards integrated with energy data.
Real-time monitoring and alerting across connected lighting and energy metrics
Acuity Brands Energy Management stands out with a dashboard built around lighting and building energy signals from compatible Acuity systems. Core capabilities include real-time energy and operational visibility, configurable views by space, and alerting tied to monitored metrics.
The platform supports energy tracking over time so teams can compare usage patterns and identify outliers. It also emphasizes actionable monitoring through work-ready insights for facility operations.
- +Real-time energy visibility for monitored buildings and connected lighting systems
- +Configurable dashboards support space-level views for faster troubleshooting
- +Time-series reporting helps detect usage trends and recurring anomalies
- +Alerting highlights metric deviations for quicker operational response
- –Best results depend on compatibility with Acuity-controlled equipment
- –Dashboard setup can require disciplined data and space mapping
- –Advanced analysis is less flexible than general-purpose analytics tools
- –Integration depth outside Acuity ecosystems may be limited
Best for: Facilities teams managing Acuity-connected lighting and energy performance dashboards
Schneider Electric EcoStruxure Energy Hub
industrial energySchneider Electric EcoStruxure Energy Hub centralizes energy data and presents analytics dashboards for industrial and building energy monitoring.
EcoStruxure Energy Hub multi-site dashboards with asset-linked, event-aware energy monitoring
Schneider Electric EcoStruxure Energy Hub centralizes utility and site energy data with dashboarding built for Schneider ecosystem devices. The software supports multi-site visualization, configurable energy KPIs, and event-aware monitoring tied to plant assets.
It enables consumption analytics and operational context for energy performance tracking, including anomaly visibility across metering signals. Integration depth with EcoStruxure portfolios makes it a strong choice for organizations standardizing on Schneider hardware and software.
- +Multi-site energy dashboards with consistent KPI structure across sites
- +Strong integration path for Schneider EcoStruxure meters and controllers
- +Event-aware monitoring improves traceability from spikes to operational conditions
- +Configurable widgets for consumption, demand, and performance trend analysis
- –Best results rely on Schneider device ecosystem for richer telemetry
- –Advanced analytics require careful data modeling and metering setup
- –Dashboard customization can be constrained for non-Scneider asset types
Best for: Organizations standardizing Schneider metering for multi-site energy monitoring and KPIs
Siemens Energy IP Management
asset monitoringSiemens Energy IP management capabilities provide energy and performance monitoring dashboards for operators managing energy assets.
Lifecycle status tracking for IP disclosures with governed access and audit trails
Siemens Energy IP Management stands out with an energy-focused governance layer for managing intellectual property across projects and partners. It centralizes IP records tied to specific initiatives, workflows, and stakeholders.
Core capabilities include structured IP documentation, lifecycle tracking, and access-controlled collaboration around disclosures and usage rights. Reporting supports audit readiness by showing status changes, ownership context, and review trails for managed IP assets.
- +Energy-specific IP records linked to projects and stakeholders
- +Lifecycle tracking supports disclosure, review, and status updates
- +Role-based controls restrict access to sensitive IP information
- +Audit-friendly trails capture decision points and change history
- –Not a grid analytics dashboard for real-time power and meter data
- –Requires process discipline to keep IP records complete and current
- –Dashboard views focus on IP governance rather than operational KPIs
Best for: Teams managing energy IP governance, compliance workflows, and cross-partner collaboration
Microsoft Power BI
BI dashboardsPower BI creates energy management dashboards that combine smart meter data, building telemetry, and external datasets.
Power BI DAX measures for advanced energy KPIs and forecasting-style calculations
Microsoft Power BI stands out for turning energy operational data into interactive dashboards through Microsoft-centric connectivity. It supports data modeling with DAX, real-time style updates via scheduled refresh, and rich visuals for load, generation, and consumption analytics.
Power BI connects to common enterprise sources like Azure services, SQL databases, and streaming datasets, which suits utilities and energy traders. Governance controls like row-level security enable role-based views across operations, finance, and planning teams.
- +DAX enables precise energy metrics like demand peaks, rolling averages, and variances
- +Strong Microsoft ecosystem integration supports Azure data pipelines and enterprise identities
- +Interactive dashboards support drill-through from KPIs to underlying metering records
- +Row-level security supports role-based access for control-room and finance teams
- –Complex data models require careful design to avoid slow visuals
- –Real-time performance depends on data refresh and streaming setup choices
- –Geospatial mapping can require extra configuration for utility-specific basemaps
Best for: Utilities and energy teams needing analytics dashboards with governance and drill-down
Grafana
observabilityGrafana visualizes time-series energy metrics on dashboards with alerts and integrations for common telemetry backends.
Grafana Alerting with rule evaluation on time-series queries and notification routing
Grafana stands out for turning time-series energy data into dashboards with fast, interactive exploration. It supports core energy-management workflows through metric visualizations, alerting, and a plugin-based data source ecosystem.
Grafana’s query and transformation pipeline helps normalize signals for load profiles, demand forecasting inputs, and asset-level reporting. It also supports collaborative operations with shared dashboards and role-based access controls.
- +Interactive time-series panels built for power usage, load curves, and telemetry
- +Grafana Alerting supports threshold and multi-condition alerts on energy metrics
- +Transformations normalize and reshape signals before visualization
- +Extensive data source connectors for SCADA, time-series, and databases
- –Dashboarding and alerting require data modeling work for clean energy KPIs
- –Actionable energy control workflows depend on external automation integrations
- –Large dashboard performance can suffer with heavy queries and many panels
- –Provisioning and governance take setup for consistent multi-team operations
Best for: Grid operators and energy teams visualizing telemetry across many assets
How to Choose the Right Energy Management Dashboard Software
This buyer's guide helps teams choose energy management dashboard software by mapping dashboard capabilities to operational goals across EnergyCAP, Sense, Enel X Way, Smappee, Ember Energy, Acuity Brands Energy Management, Schneider Electric EcoStruxure Energy Hub, Siemens Energy IP Management, Microsoft Power BI, and Grafana. It covers the key capabilities that show up repeatedly in these tools, the exact “best for” matches used to segment buyers, and common setup pitfalls tied to meter mapping, ecosystem fit, and data modeling. The guide also explains how EnergyCAP stands out and how tools like Power BI and Grafana support custom analytics versus purpose-built energy accounting and control workflows.
What Is Energy Management Dashboard Software?
Energy Management Dashboard Software turns utility bills, interval meter readings, and building telemetry into interactive dashboards with consumption trends, anomaly visibility, and performance KPIs. It solves problems like tracking usage and cost impacts over time, comparing performance across assets, and routing insights into actions like monitoring alerts or savings project workflows. Facilities and utilities teams typically use these dashboards to connect energy behavior to operational decisions, while homeowners use them to identify which appliances drive consumption. Tools like EnergyCAP model utility-grade accounting and multi-site reporting, while Smappee focuses on real-time, circuit- and location-level visibility for metered building loads.
Key Features to Look For
Energy management dashboards should connect data quality to the exact decisions users need, such as savings validation, anomaly response, or real-time operational control.
Utility-grade energy normalization for consistent portfolio reporting
EnergyCAP is built for utility bill tracking, benchmarking, and dashboard reporting with strong utility data normalization across multi-site portfolios. This feature matters because variance and forecast reporting depends on consistent accounting logic when usage patterns differ by building and meter source.
Savings project tracking with measurement and verification style documentation
EnergyCAP supports structured project and tracking workflows using savings documentation and measurement logic that ties usage changes to cost impacts. This feature matters for teams validating energy efficiency capital planning instead of only viewing charts.
Whole-home or device-level identification and on-dashboard anomaly alerts
Sense provides appliance identification using whole-home and circuit signals and highlights unusual consumption with automated anomaly detection. Ember Energy similarly emphasizes device-level energy breakdown with time-of-day patterns and recommendation-driven cards, which makes it easier to act on spikes and waste.
Circuit and location visibility for faster root-cause analysis
Smappee delivers real-time energy visibility down to circuits and locations and ties insights to meters and connected devices. This feature matters for facilities teams diagnosing abnormal usage patterns that originate from specific electrical circuits.
Real-time operational KPIs with scenario planning and automated energy management workflows
Enel X Way provides real-time monitoring and KPI dashboards for assets and energy flows, plus scenario-based planning for demand and generation optimization. It also supports automated energy management workflows linked to controllable distributed energy resources, which matters for operators needing actions that go beyond reporting.
Advanced analytics with governance, drill-through, and programmable KPI logic
Microsoft Power BI supports DAX measures for energy KPIs and forecasting-style calculations with interactive drill-through from dashboard tiles to underlying metering records. Grafana supports interactive time-series exploration with Grafana Alerting that evaluates time-series queries and routes notifications, which matters for teams that want custom energy KPI definitions backed by robust alerting.
How to Choose the Right Energy Management Dashboard Software
Select the tool that matches the data level, operational workflow, and integration ecosystem required for the intended energy decisions.
Match the dashboard granularity to the decisions that must be made
Sense is designed for appliance-level identification using whole-home and circuit signals with on-dashboard anomaly alerts, which fits households deciding which devices create waste. Smappee focuses on circuit and location visibility across buildings, which fits facilities teams tracking metered electrical loads across multiple areas.
Choose utility-grade accounting when variance and forecasting across sites are required
EnergyCAP connects utility data, interval trends, and cost allocation to support variance and forecast reporting that ties usage changes to cost impacts. This approach fits multi-site energy accounting and budgeting workflows where reporting must normalize and roll up data across buildings and regions.
Prioritize automated control workflows if the dashboard must trigger actions
Enel X Way includes automated energy management workflows linked to monitored distributed energy resources and controllable assets. Acuity Brands Energy Management supports alerting tied to monitored metrics and configurable dashboards by space, which fits operational monitoring where work-ready insights guide facility response.
Select ecosystem-aligned platforms for faster implementation and better telemetry
Schneider Electric EcoStruxure Energy Hub emphasizes multi-site dashboards with asset-linked, event-aware monitoring that integrates strongly with EcoStruxure portfolios. Acuity Brands Energy Management is strongest when using compatible Acuity systems for real-time energy and operational visibility.
Use Power BI or Grafana for custom KPI logic and governance-heavy analytics
Microsoft Power BI is a fit for utilities and energy teams needing DAX-based energy KPIs, interactive dashboards, and governance features like row-level security. Grafana is a fit for grid operators and energy teams visualizing telemetry across many assets with Grafana Alerting that evaluates rules on time-series queries and routes notifications.
Who Needs Energy Management Dashboard Software?
Energy management dashboard software benefits organizations and teams that must track consumption performance, detect abnormal behavior, and route insights into operational or savings actions.
Multi-site energy accounting teams validating project savings
EnergyCAP is the best fit because it unifies utility data and interval trends and supports savings project tracking with measurement and verification style documentation. The platform also enables variance and forecast reporting that ties usage changes to cost impacts, which aligns with budgeting and capital planning workflows.
Facilities teams managing metered electrical loads across buildings
Smappee is built for real-time dashboards with historical consumption views and circuit and location visibility for faster root-cause analysis. Acuity Brands Energy Management adds real-time monitoring and alerting across connected lighting and supports configurable dashboards by space for operational troubleshooting.
Utilities and energy operators managing distributed assets and controllable resources
Enel X Way is tailored for real-time energy monitoring, KPI dashboards, scenario planning, and automated energy management workflows tied to distributed energy resources. Schneider Electric EcoStruxure Energy Hub also supports multi-site monitoring with asset-linked, event-aware tracing when organizations standardize on Schneider metering and controllers.
Teams building analytics-heavy dashboards with governance and custom KPI definitions
Microsoft Power BI supports DAX measures for advanced energy KPIs and forecasting-style calculations with role-based access via row-level security. Grafana supports interactive time-series panels, transformations for normalizing signals, and Grafana Alerting for rule evaluation and notification routing across telemetry backends.
Common Mistakes to Avoid
These tools expose consistent failure modes during setup and configuration, especially around data mapping, ecosystem dependency, and overly ambitious customization without the right data model.
Underestimating the impact of source data cleanliness on setup time
EnergyCAP dashboard setup can be time-consuming without clean source data, and advanced configuration requires analytics discipline across sites. Grafana also requires data modeling work for clean energy KPIs, so heavy dashboards with many panels can degrade performance when query design is not optimized.
Choosing a dashboard that cannot see the asset level required for decisions
Sense and Ember Energy are household-focused and emphasize appliance or device-level insights, so they are less suited for large portfolios and complex multi-panel or shared-meter systems. Siemens Energy IP Management is not a grid analytics dashboard because its views focus on IP governance with lifecycle status tracking rather than operational energy KPIs.
Relying on advanced analysis while meter mapping and asset alignment are weak
Smappee advanced analysis depends on correct meter mapping, and multi-site rollups require careful configuration. Acuity Brands Energy Management also benefits from disciplined space mapping so alerts and configurable views align with the monitored buildings and connected lighting.
Expecting an ecosystem-dependent platform to generalize across non-native hardware
Schneider Electric EcoStruxure Energy Hub produces best results with Schneider device ecosystem telemetry, and dashboard customization can be constrained for non-Schneider asset types. Acuity Brands Energy Management is strongest with Acuity-connected equipment, and integration depth outside the Acuity ecosystem can be limited.
How We Selected and Ranked These Tools
We evaluated every tool on three sub-dimensions: features with weight 0.4, ease of use with weight 0.3, and value with weight 0.3. The overall rating is the weighted average of those three calculations, so overall equals 0.40 × features + 0.30 × ease of use + 0.30 × value. EnergyCAP separated from lower-ranked tools because its utility-grade normalization and variance and forecast reporting connect usage changes to cost impacts, which directly strengthens the features dimension tied to multi-site energy accounting and savings workflows. EnergyCAP also earned a high ease-of-use score for teams that already have structured utility data and need multi-site rollups, which lifted its overall result above tools that focus on narrower visibility levels like Sense and Ember Energy or non-analytics governance workflows like Siemens Energy IP Management.
Frequently Asked Questions About Energy Management Dashboard Software
Which energy dashboard tools are best for multi-site utilities and centralized operations?
What tool provides the most actionable anomaly alerts for household or device-level use cases?
Which dashboards are strongest for lighting-centric facility monitoring and work-ready operational insights?
Which platforms are most suitable for forecasting, scenario planning, and KPI modeling workflows?
How do the tools differ in meter-to-insight granularity and circuit or device visibility?
Which option fits utilities that need real-time grid telemetry visualization with alerting?
Which tools provide dashboards that integrate well with enterprise data sources and governed access controls?
What are common onboarding steps to get a usable dashboard quickly with these systems?
Which solution addresses governance, audit trails, and access-controlled workflows for regulated organizations?
Conclusion
After evaluating 10 environment energy, EnergyCAP stands out as our overall top pick — it scored highest across our combined criteria of features, ease of use, and value, which is why it sits at #1 in the rankings above.
Use the comparison table and detailed reviews above to validate the fit against your own requirements before committing to a tool.
Tools reviewed
Primary sources checked during evaluation.
Referenced in the comparison table and product reviews above.
Keep exploring
Comparing two specific tools?
Software Alternatives
See head-to-head software comparisons with feature breakdowns, pricing, and our recommendation for each use case.
Explore software alternatives→In this category
Environment Energy alternatives
See side-by-side comparisons of environment energy tools and pick the right one for your stack.
Compare environment energy tools→FOR SOFTWARE VENDORS
Not on this list? Let’s fix that.
Our best-of pages are how many teams discover and compare tools in this space. If you think your product belongs in this lineup, we’d like to hear from you—we’ll walk you through fit and what an editorial entry looks like.
Apply for a ListingWHAT THIS INCLUDES
Where buyers compare
Readers come to these pages to shortlist software—your product shows up in that moment, not in a random sidebar.
Editorial write-up
We describe your product in our own words and check the facts before anything goes live.
On-page brand presence
You appear in the roundup the same way as other tools we cover: name, positioning, and a clear next step for readers who want to learn more.
Kept up to date
We refresh lists on a regular rhythm so the category page stays useful as products and pricing change.