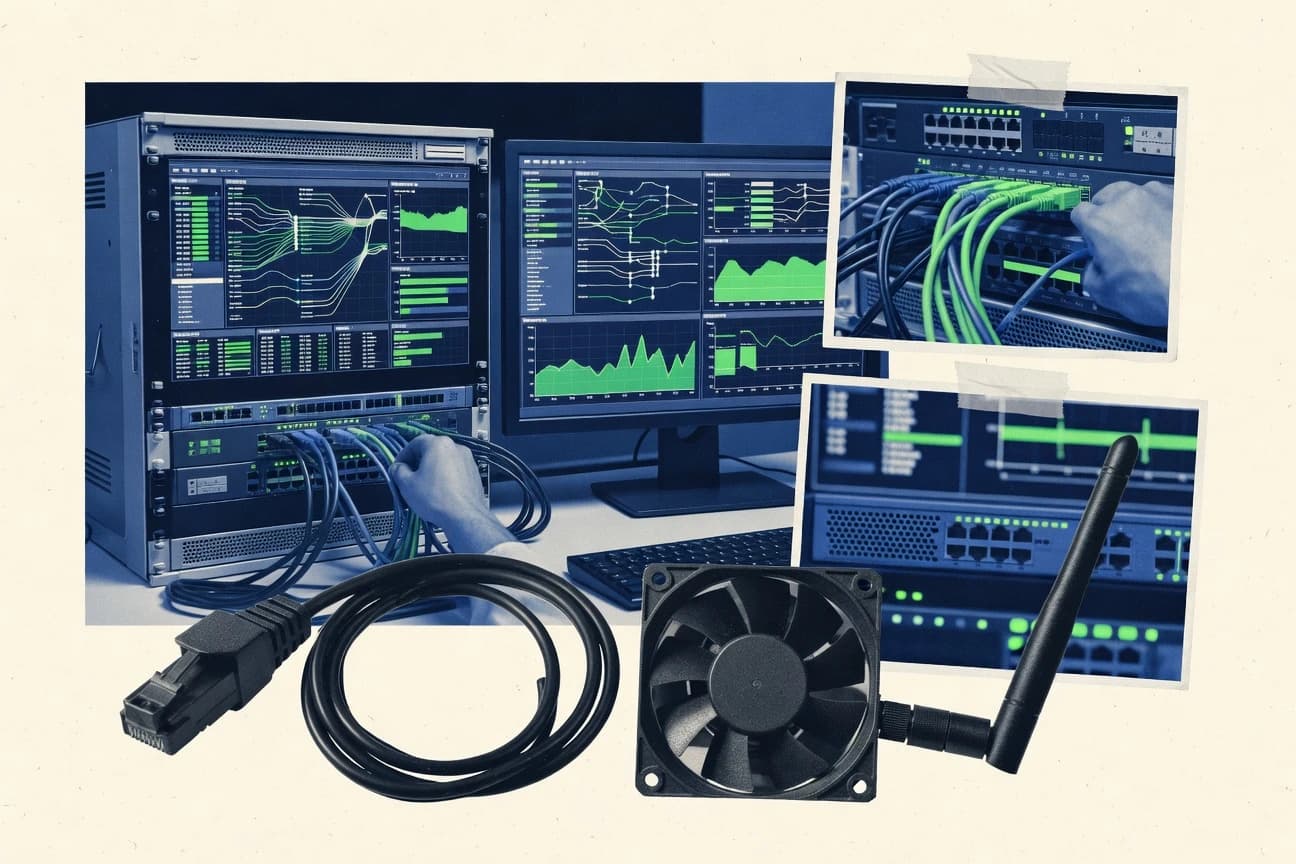
GITNUXSOFTWARE ADVICE
Technology Digital MediaTop 10 Best Bandwidth Management Software of 2026
Discover top 10 bandwidth management software solutions to optimize network performance.

How we ranked these tools
Core product claims cross-referenced against official documentation, changelogs, and independent technical reviews.
Analyzed video reviews and hundreds of written evaluations to capture real-world user experiences with each tool.
AI persona simulations modeled how different user types would experience each tool across common use cases and workflows.
Final rankings reviewed and approved by our editorial team with authority to override AI-generated scores based on domain expertise.
Score: Features 40% · Ease 30% · Value 30%
Gitnux may earn a commission through links on this page — this does not influence rankings. Editorial policy
Editor picks
Three quick recommendations before you dive into the full comparison below — each one leads on a different dimension.
NetFlow Analyzer
NetFlow and sFlow bandwidth monitoring with top talker and application breakdown
Built for network teams needing NetFlow bandwidth analytics, alerting, and reporting.
SolarWinds Network Performance Monitor
Runner UpNetFlow performance monitoring with detailed bandwidth and utilization analytics for interfaces and traffic flows
Built for network operations teams needing bandwidth visibility and fault-level performance troubleshooting.
PRTG Network Monitor
Also GreatSNMP and NetFlow-style sensor collection with alerting on bandwidth thresholds
Built for network teams needing bandwidth visibility and alerting without traffic shaping.
Related reading
Comparison Table
This comparison table evaluates bandwidth management and network monitoring tools such as NetFlow Analyzer, SolarWinds Network Performance Monitor, PRTG Network Monitor, ManageEngine OpManager, and nTopng. It highlights how each solution collects flow and interface metrics, visualizes utilization, and supports alerting and reporting so you can match features to your network monitoring and traffic control needs.
NetFlow Analyzer
enterprise monitoringProvides bandwidth monitoring, capacity planning, and live traffic analytics using flow data across routers, switches, and firewalls.
NetFlow and sFlow bandwidth monitoring with top talker and application breakdown
NetFlow Analyzer by ManageEngine stands out with deep network traffic visibility built around NetFlow and sFlow data collection. It combines bandwidth monitoring, top talker reporting, and application visibility so teams can pinpoint who uses capacity and what consumes it.
The platform also supports alerting and historical reports for capacity planning and incident investigation. Administrators get centralized dashboards and customizable reports without needing a separate analytics stack.
- +Strong NetFlow and sFlow ingestion for accurate bandwidth visibility
- +Actionable top talker and application usage reports for fast investigations
- +Built-in alerting supports proactive capacity monitoring
- +Dashboards and historical trending improve long-term capacity planning
- +Centralized reporting reduces the need for external analytics tools
- –Deep customization can require more setup than lightweight monitors
- –Learning the report filters and dashboards takes time for new teams
- –Large environments can increase collector and storage demands
- –Use-case focus on traffic analytics may not cover full network security needs
Best for: Network teams needing NetFlow bandwidth analytics, alerting, and reporting
More related reading
SolarWinds Network Performance Monitor
network monitoringDelivers bandwidth and interface utilization monitoring with alerting and performance reporting for networks of all sizes.
NetFlow performance monitoring with detailed bandwidth and utilization analytics for interfaces and traffic flows
SolarWinds Network Performance Monitor distinguishes itself with deep SNMP and NetFlow visibility paired with advanced network path analysis for diagnosing bandwidth and latency issues. It provides throughput monitoring, interface utilization alerts, and performance baselining so teams can spot congestion trends before they impact users.
Dashboards connect device health and traffic behavior to pinpoint which links and segments drive saturation. It also supports automated remediation workflows through alerting that integrates with other SolarWinds products.
- +Strong SNMP and NetFlow telemetry for interface throughput and traffic analysis
- +Baselining and anomaly detection help identify congestion trends early
- +Detailed dashboards link device performance to where bandwidth problems originate
- +Alerting supports escalations that fit real operational processes
- –Setup and tuning are heavy for large environments with many device types
- –User workflows can feel complex due to many overlapping performance views
- –Bandwidth management requires proper NetFlow export configuration end to end
- –Cost can be high versus simpler bandwidth reporting tools
Best for: Network operations teams needing bandwidth visibility and fault-level performance troubleshooting
PRTG Network Monitor
sensor-based monitoringUses sensors and probes to track bandwidth consumption and generate alerts from SNMP, flow, and other network telemetry.
SNMP and NetFlow-style sensor collection with alerting on bandwidth thresholds
PRTG Network Monitor stands out for bandwidth-focused monitoring built on a large library of network and application sensors. It visualizes traffic per interface and link, then alerts when bandwidth thresholds are exceeded.
It also supports SNMP and NetFlow-style data collection for granular throughput and trend analysis. For bandwidth management, it pairs monitoring with traffic baselines and notification workflows rather than offering traffic-shaping controls.
- +Breadth of sensor types for interface and bandwidth monitoring
- +Threshold alerts with detailed logs and notification options
- +Traffic views and reports help track usage trends over time
- +SNMP monitoring covers switches, routers, and servers
- –Bandwidth management lacks built-in traffic shaping and throttling
- –Sensor-heavy setups increase configuration and maintenance effort
- –Usability can lag for large environments with many monitored devices
- –Alert tuning takes time to reduce noise
Best for: Network teams needing bandwidth visibility and alerting without traffic shaping
ManageEngine OpManager
performance monitoringMonitors bandwidth and interface performance with threshold-based alerts, historical reporting, and capacity trend views.
SNMP-driven bandwidth monitoring with capacity trending and threshold-based alerting
ManageEngine OpManager stands out with strong network and bandwidth visibility through SNMP-based performance monitoring and capacity trending. It builds live dashboards and historical reports for interface utilization, top talkers, and link saturation across routers, switches, and WAN links.
The product supports alerting, threshold policies, and event correlation so bandwidth incidents surface quickly. Broad integration with ManageEngine ecosystem features like alert management and helpdesk workflows makes it practical for operations teams managing bandwidth alongside outages.
- +Deep SNMP monitoring for interface throughput and utilization
- +Historical capacity trends for peak usage forecasting and planning
- +Threshold alerts for bandwidth saturation and sustained anomalies
- +Actionable dashboards for links, devices, and bandwidth hotspots
- –Setup and tuning take time for large, heterogeneous networks
- –Bandwidth analytics are strongest for networks, weaker for app-layer attribution
- –Reporting depth can feel complex without standard templates
Best for: Network operations teams needing interface bandwidth monitoring and capacity trending
Ntopng
flow analyticsShows real-time traffic flows, bandwidth usage, and top talkers with a web-based interface built for network visibility.
Protocol-aware flow statistics with host-level bandwidth rankings
Ntopng distinguishes itself by turning network traffic visibility into an on-device style interface with live host and flow views. It combines packet and flow analysis to surface bandwidth usage by host, protocol, and conversation so operators can spot heavy talkers quickly.
Bandwidth management actions are driven by measurement and visibility rather than a built-in traffic shaping policy engine, so it pairs best with external QoS or firewall controls. You get deep troubleshooting data such as protocol identification and flow-based statistics that support capacity planning and incident response.
- +Flow and protocol breakdown pinpoints bandwidth hogs by host and conversation
- +Live web UI shows top talkers and time-series stats for rapid triage
- +Deep packet and traffic analytics support troubleshooting beyond simple charts
- +Runs as a network probe so you can monitor centrally without agents
- –Bandwidth management relies on visibility, not built-in traffic shaping
- –Setup and tuning for capture points can be complex in larger networks
- –Web interface navigation can feel dense when volumes and hosts grow
Best for: Network operators needing flow visibility and bandwidth forensics
Wireshark
packet inspectionEnables deep packet inspection to analyze bandwidth use at the protocol and traffic-session level with powerful filtering.
Live capture with display filters and hundreds of protocol dissectors for packet-level bandwidth diagnosis
Wireshark stands out with deep packet inspection and interactive protocol analysis that goes far beyond bandwidth charts. It captures live network traffic, decodes hundreds of protocols, and provides granular filters to measure traffic patterns at the packet level.
As a bandwidth management tool, it helps identify top talkers, noisy protocols, retransmissions, and congestion signals by analyzing real traffic behavior. It supports export for further analysis and can validate fixes by comparing captures before and after changes.
- +Protocol dissectors reveal exact traffic composition beyond simple usage graphs
- +Powerful display filters pinpoint top talkers and specific flows quickly
- +Capture-to-analysis workflow supports troubleshooting before and after changes
- +Exportable packet data supports reporting and offline bandwidth investigations
- –It does not provide policy-based bandwidth enforcement or throttling controls
- –Packet-level analysis can overwhelm teams without network forensics skills
- –Live monitoring requires active capturing and tuning rather than turnkey dashboards
- –Summarized bandwidth reporting is less automated than dedicated monitoring suites
Best for: Network teams investigating bandwidth issues with packet-level visibility and protocol decoding
Zabbix
open-source monitoringCollects SNMP and agent metrics for interface throughput and bandwidth utilization with dashboards and alerting.
Trigger-based alerting on interface throughput with action workflows
Zabbix stands out for deep infrastructure monitoring with built-in alerting, dashboards, and data retention controls that can support bandwidth-oriented operations. You can track interface throughput using SNMP and agent-based metrics, then drive bandwidth thresholds, incident notifications, and historical trend analysis.
Its real strength is correlating network usage with host and application health, which helps troubleshoot bandwidth-driven outages. Bandwidth management is achievable through monitoring and alert workflows rather than dedicated traffic shaping or policy enforcement.
- +Collects interface bandwidth via SNMP and agents for detailed throughput tracking
- +Flexible triggers and actions enable automated alerts on bandwidth thresholds
- +Custom dashboards and reports support long-term trend analysis
- +Scales across many hosts with distributed polling options
- +Strong ecosystem for integrations like Slack, email, and ticketing
- –Bandwidth management focuses on monitoring and alerting, not traffic shaping
- –Initial setup and tuning require careful configuration and SNMP/metric knowledge
- –Large deployments can demand significant database and storage planning
- –UI customization and complex rules can increase operational overhead
- –Less suited for hands-on capacity planning without external tooling
Best for: Network and infrastructure teams needing bandwidth visibility with alert automation
Nagios XI
alert-centric monitoringMonitors network bandwidth and interface health using extensible plugins, custom checks, and alerting workflows.
SNMP-based interface monitoring with threshold-driven alerting for utilization spikes.
Nagios XI focuses on network and infrastructure monitoring that directly supports bandwidth management through alerting and capacity visibility. It provides host, service, and SNMP-based interface checks so you can track link utilization and trigger notifications when thresholds are exceeded.
With a web console and event handling workflows, you can reduce downtime risks that degrade throughput. For deeper bandwidth analytics, it is strongest as a monitoring and alerting hub rather than a reporting-first traffic optimization system.
- +SNMP interface monitoring supports bandwidth and utilization threshold alerts
- +Web console gives fast access to alerts, dashboards, and event history
- +Extensive plugin ecosystem enables custom bandwidth checks and integrations
- +Solid incident handling reduces time-to-detect bandwidth problems
- –Bandwidth analytics and forecasting are limited compared to dedicated traffic platforms
- –Setup and tuning can be complex for teams without monitoring experience
- –Alert noise management needs careful thresholds to avoid constant notifications
Best for: IT teams monitoring bandwidth via SNMP with actionable alerting workflows
LibreNMS
open-source SNMPTracks SNMP-based bandwidth and device performance in a web UI with graphing, thresholds, and alert notifications.
Auto-discovery with SNMP polling for interfaces and utilization graphing
LibreNMS stands out as a network monitoring system that doubles as a practical bandwidth management solution through SNMP polling and traffic analytics. It collects interface counters, graphs utilization over time, and supports alerting based on thresholds for bandwidth-related signals.
Its device coverage includes common network gear, and it can centralize performance visibility across many switches, routers, and firewalls. It is less focused on user-facing traffic shaping workflows than on measurement, troubleshooting, and reporting.
- +SNMP-based interface polling with detailed bandwidth time-series graphs
- +Alerting on utilization thresholds to catch congestion early
- +Broad network device support for centralized bandwidth visibility
- +Flexible dashboards for monitoring multiple sites and links
- –Bandwidth management is measurement-focused, not policy-based traffic shaping
- –Setup and tuning require SNMP, polling, and discovery configuration
- –Visualization and reporting can feel complex on large deployments
- –Limited built-in automation compared with dedicated network controllers
Best for: Network teams needing open-source bandwidth monitoring and alerting across many devices
Icinga
check-based monitoringRuns bandwidth and interface checks via plugins and monitoring agents to support alerting and operational visibility.
Icinga Web dashboard and alerting tied to configurable check results
Icinga stands out for its Icinga Web monitoring front end and its strong configuration-driven approach to alerting. It can manage and validate network and service performance through active checks, passive checks, and threshold-based rules that align with bandwidth and connectivity visibility.
For bandwidth management specifically, it is best used to enforce operational controls and reporting signals rather than to run shaping or quota enforcement. Its core workflow centers on detecting issues and routing notifications across teams.
- +Strong monitoring workflow with configurable checks and threshold logic
- +Supports both active and passive event ingestion for bandwidth-related signals
- +Integrates with alerting and dashboards via Icinga Web
- +Mature ecosystem for plugins and operational automation
- –Not a bandwidth shaper or traffic governor for enforcement policies
- –Setup and tuning require careful configuration for accurate bandwidth signals
- –Less focused on quota management and chargeback reporting
Best for: Ops teams monitoring bandwidth health with alerting and workflow automation
Conclusion
After evaluating 10 technology digital media, NetFlow Analyzer stands out as our overall top pick — it scored highest across our combined criteria of features, ease of use, and value, which is why it sits at #1 in the rankings above.
Use the comparison table and detailed reviews above to validate the fit against your own requirements before committing to a tool.
How to Choose the Right Bandwidth Management Software
This buyer’s guide covers how to evaluate Bandwidth Management Software using tools like NetFlow Analyzer, SolarWinds Network Performance Monitor, PRTG Network Monitor, and ManageEngine OpManager. It also explains when flow visibility tools like Ntopng and Wireshark fit better than monitoring hubs like Zabbix, Nagios XI, LibreNMS, and Icinga. Use it to match the right telemetry method, reporting needs, and alert workflow to your network environment.
What Is Bandwidth Management Software?
Bandwidth Management Software measures network throughput and link utilization so teams can detect congestion, investigate who consumes capacity, and plan for growth. Most solutions in this category drive alerting from SNMP, NetFlow, or flow-style telemetry while reporting capacity trends and hotspots. Tools like NetFlow Analyzer focus on NetFlow and sFlow bandwidth monitoring with top talker and application breakdown for incident investigation and capacity planning. Tools like PRTG Network Monitor focus on SNMP and flow-based sensor monitoring with threshold alerts rather than traffic shaping controls.
Key Features to Look For
These features determine whether a tool can move you from bandwidth visibility to faster triage, better forecasting, and cleaner alert workflows.
NetFlow and sFlow bandwidth visibility with top talker and application breakdown
Look for NetFlow and sFlow ingestion that produces actionable top talker and application usage reports for fast investigations. NetFlow Analyzer is built around NetFlow and sFlow bandwidth monitoring with top talker and application breakdown, and SolarWinds Network Performance Monitor pairs NetFlow with detailed bandwidth and utilization analytics.
SNMP interface throughput monitoring with threshold-based alerts
SNMP polling is the fastest way to turn interface counters into bandwidth threshold alerts that operations teams can respond to quickly. ManageEngine OpManager and LibreNMS both emphasize SNMP-driven interface utilization graphs and alerts, and Nagios XI and Zabbix use SNMP checks and triggers to drive notification workflows.
Capacity trending and historical reporting for peak usage forecasting
Bandwidth management requires more than live charts, because sustained anomalies and seasonal peaks determine where you need to add capacity. ManageEngine OpManager provides historical capacity trends for peak usage forecasting, and NetFlow Analyzer offers dashboards and historical trending for long-term capacity planning.
Protocol-aware traffic analytics for bandwidth forensics
Protocol and flow breakdown helps teams identify noisy traffic and specific contributors when congestion appears. Ntopng delivers protocol-aware flow statistics with host-level bandwidth rankings, and Wireshark provides packet-level protocol dissectors and live capture filtering to pinpoint retransmissions, noisy protocols, and specific flows.
Alert workflow automation that connects signals to operational actions
Alerting must route to teams and tools, or bandwidth events become noisy tickets that slow response time. Zabbix offers flexible triggers and action workflows with integrations like Slack, email, and ticketing, and SolarWinds Network Performance Monitor supports alerting that can integrate into SolarWinds operational workflows.
Scalability across device counts using auto-discovery and distributed polling
Large environments need discovery and polling options that reduce manual configuration and keep data collection stable. LibreNMS uses SNMP auto-discovery for interface and utilization graphing, while Zabbix supports distributed polling so you can scale interface throughput monitoring across many hosts.
How to Choose the Right Bandwidth Management Software
Pick the tool whose telemetry model and reporting depth match your bandwidth management goal, then confirm it aligns with your team’s operational workflow.
Choose your telemetry method based on what you must explain
If you need “who uses capacity and what application consumes it,” choose a NetFlow-focused platform like NetFlow Analyzer or SolarWinds Network Performance Monitor because both emphasize NetFlow-based performance monitoring with traffic and application breakdown. If you need “which interfaces are saturated,” choose an SNMP-first monitoring approach like ManageEngine OpManager or LibreNMS because both emphasize SNMP interface throughput, utilization graphs, and threshold alerts.
Decide how much bandwidth control you actually need
Most tools here are measurement and alerting systems rather than traffic shaping engines, so verify your enforcement requirement early. PRTG Network Monitor and Ntopng focus on bandwidth visibility and alerting without built-in traffic shaping, and Wireshark is a packet-capture diagnostic workflow that does not provide policy-based throttling controls.
Match reporting depth to planning versus troubleshooting
For capacity planning and historical trending, prioritize ManageEngine OpManager for capacity trend views and NetFlow Analyzer for historical dashboards and capacity planning reports. For rapid troubleshooting and bandwidth forensics, prioritize Ntopng for protocol-aware flow statistics and Wireshark for packet-level decoding with display filters.
Plan alert quality before you deploy at scale
Tools like Zabbix and Icinga can be powerful once triggers and checks are tuned, so allocate time to design bandwidth thresholds and alert actions around your environment. If you want threshold alerts fast, Nagios XI and PRTG Network Monitor provide SNMP and utilization threshold monitoring, but you still need careful alert tuning to avoid notification noise.
Use a proof-of-collection test for your network size and data sources
Large environments can increase collector and storage demands for NetFlow-based systems like NetFlow Analyzer, and SolarWinds Network Performance Monitor requires proper NetFlow export configuration end to end. For SNMP-heavy deployments, Plan configuration effort for Zabbix, LibreNMS, and ManageEngine OpManager because setup and tuning require SNMP knowledge and discovery configuration.
Who Needs Bandwidth Management Software?
Bandwidth Management Software fits teams that need ongoing visibility into link utilization and throughput, plus alerting workflows for congestion incidents.
Network teams running NetFlow or sFlow and needing top talkers and application attribution
NetFlow Analyzer is a strong match because it ingests NetFlow and sFlow bandwidth data and produces top talker and application usage breakdown for incident investigation. SolarWinds Network Performance Monitor also fits teams that want NetFlow-based interface and traffic flow analytics with performance path troubleshooting.
Network operations teams that manage interface saturation and WAN link bottlenecks
ManageEngine OpManager is built for SNMP interface bandwidth monitoring with capacity trending and threshold-based alerting, which supports sustained congestion detection and forecasting. LibreNMS also fits teams that want SNMP polling with utilization graphs and threshold notifications across many devices.
Teams that want bandwidth monitoring plus flexible automation and incident routing
Zabbix is a fit because it uses SNMP and agent metrics for interface throughput and it supports trigger-based actions with integrations like Slack, email, and ticketing. Icinga fits operators who want configurable checks via Icinga Web with active and passive ingestion and alert routing across teams.
Security-minded teams and engineers performing packet-level bandwidth diagnosis
Wireshark is the right choice for protocol-level investigation because it captures live traffic with hundreds of protocol dissectors and strong display filters to identify noisy protocols and congestion signals. Ntopng is a fit when you want host-level bandwidth rankings with protocol-aware flow statistics for forensic triage.
Common Mistakes to Avoid
Bandwidth management failures usually come from picking the wrong telemetry model, expecting traffic shaping from a monitoring tool, or underestimating configuration and alert tuning effort.
Expecting built-in traffic shaping or throttling controls
PRTG Network Monitor and Ntopng provide bandwidth monitoring and alerting but do not include built-in traffic shaping. Wireshark is a packet-capture diagnostic tool that does not provide policy-based bandwidth enforcement or throttling controls.
Skipping NetFlow export configuration validation for NetFlow-focused tools
SolarWinds Network Performance Monitor requires proper NetFlow export configuration end to end to deliver bandwidth monitoring accuracy. NetFlow Analyzer can consume NetFlow and sFlow well for visibility, but large deployments can increase collector and storage demands that must be planned.
Deploying without alert threshold design and noise control
Nagios XI can generate threshold-driven utilization alerts quickly, but careful thresholds are required to avoid constant notifications. Zabbix and Icinga can support sophisticated trigger logic, but they also require careful tuning of thresholds and check rules to keep bandwidth alerts actionable.
Overlooking setup and tuning effort for large, heterogeneous environments
SolarWinds Network Performance Monitor and ManageEngine OpManager both require setup and tuning time for large, heterogeneous networks. LibreNMS, Zabbix, and Icinga also need SNMP, discovery, or check configuration effort so bandwidth data is accurate across many devices.
How We Selected and Ranked These Tools
We evaluated the top bandwidth management solutions by scoring overall capability first, then how strongly each product supports core bandwidth management workflows like monitoring, alerting, and reporting. We also measured features depth, ease of use, and value so a team could see how quickly it could become operational. NetFlow Analyzer separated itself by combining NetFlow and sFlow ingestion with top talker and application breakdown plus built-in alerting and historical trending that supports both investigation and capacity planning. Tools like Wireshark and Ntopng ranked differently because they excel in packet-level or protocol-aware forensics but do not provide the same turnkey monitoring and trending experience as NetFlow or SNMP management suites.
Frequently Asked Questions About Bandwidth Management Software
What tool should I choose if I need NetFlow and sFlow traffic analytics for bandwidth management?
Which option is best for bandwidth monitoring when I only have SNMP and interface counters?
Which tools are best for detecting bandwidth problems before users report them?
Do any of these tools actively shape traffic, enforce quotas, or run QoS policies?
Which product is strongest if I need packet-level evidence to explain bandwidth usage and retransmissions?
If I want a live host and flow view for bandwidth forensics, what should I use?
Which option is easiest to start with if I want a free or open-source path?
What typical pricing model should I expect across these tools?
How do I turn bandwidth monitoring into actionable workflows for operations teams?
What is a common setup requirement or limitation that affects bandwidth management outcomes?
Tools reviewed
Primary sources checked during evaluation.
Referenced in the comparison table and product reviews above.
Keep exploring
Comparing two specific tools?
Software Alternatives
See head-to-head software comparisons with feature breakdowns, pricing, and our recommendation for each use case.
Explore software alternatives→In this category
Technology Digital Media alternatives
See side-by-side comparisons of technology digital media tools and pick the right one for your stack.
Compare technology digital media tools→FOR SOFTWARE VENDORS
Not on this list? Let’s fix that.
Our best-of pages are how many teams discover and compare tools in this space. If you think your product belongs in this lineup, we’d like to hear from you—we’ll walk you through fit and what an editorial entry looks like.
Apply for a ListingWHAT THIS INCLUDES
Where buyers compare
Readers come to these pages to shortlist software—your product shows up in that moment, not in a random sidebar.
Editorial write-up
We describe your product in our own words and check the facts before anything goes live.
On-page brand presence
You appear in the roundup the same way as other tools we cover: name, positioning, and a clear next step for readers who want to learn more.
Kept up to date
We refresh lists on a regular rhythm so the category page stays useful as products and pricing change.