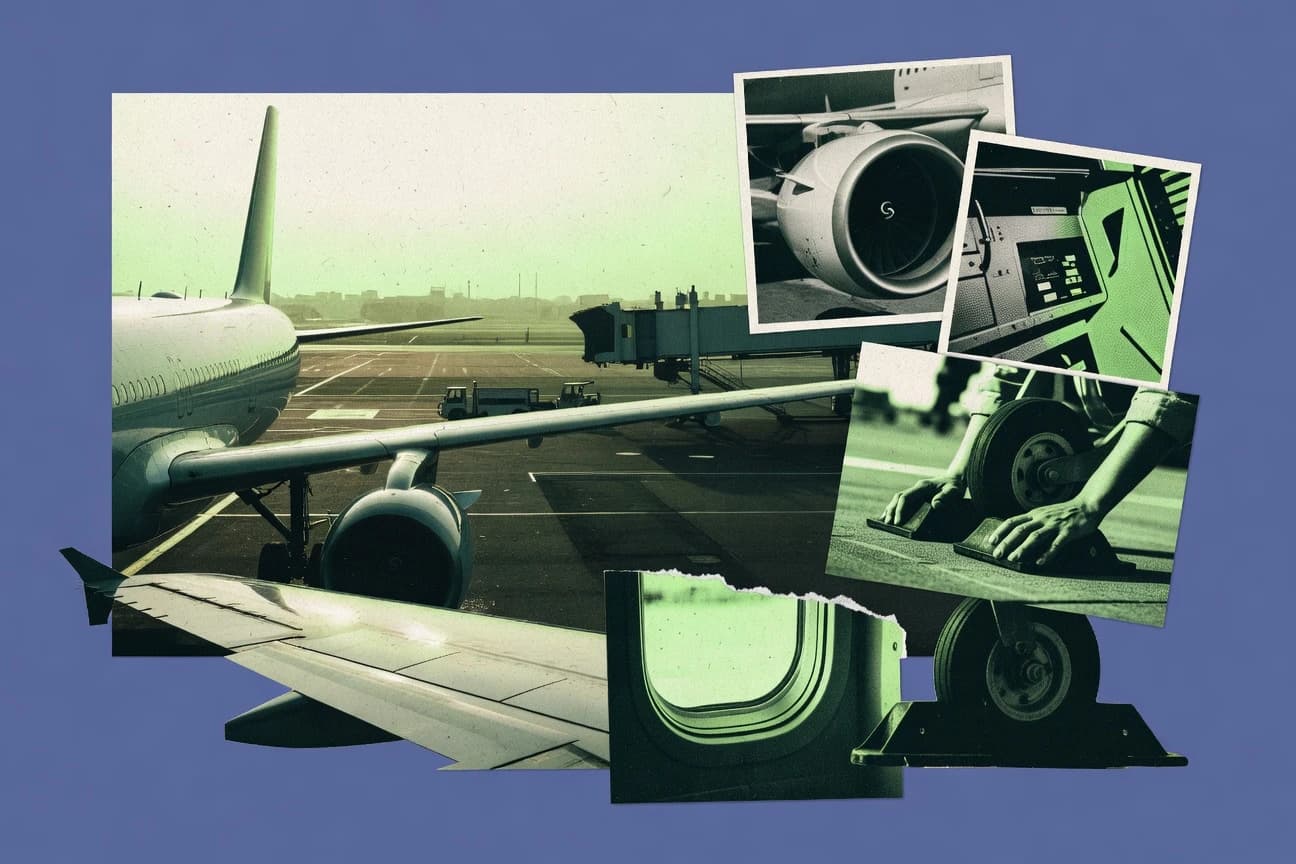

Airline outcomes in the global market are driven by demand recovery, capacity choices, and cost pressures that differ by region. In 2023, passenger traffic rebounded to about 96% of pre-pandemic levels as load factors averaged 82.6% worldwide. The page then connects these traffic and financial dynamics to fleet realities, safety performance, and environmental trade-offs like CO2 emissions and jet fuel use.
Key Takeaways
- Global airline net profits reached $30.5 billion in 2023.
- Average net profit margin: 3.9% for airlines in 2023.
- Passenger revenue: $744 billion globally in 2023.
- World fleet size: 28,400 aircraft in service end-2023.
- Narrowbody aircraft: 60% of global fleet.
- Average aircraft age: 12.5 years globally.
- In 2023, global airline passenger traffic reached 4.5 billion passengers, recovering to 96% of pre-pandemic levels.
- US airlines carried 853 million passengers in 2023, a 8.5% increase from 2022.
- International passenger traffic grew by 36.6% in 2023 compared to 2022.
- Global fatal accidents: 1 per 5.8 million departures in 2023.
- US accident rate: 0.09 per million departures.
- IATA member airlines: zero fatal accidents in 2023.
- Global aviation CO2 emissions: 915 million tonnes in 2023.
- Jet fuel consumption: 370 billion liters annually.
- Sustainable Aviation Fuel (SAF) usage: 0.2% of fuel.
In 2023, airlines globally rebounded with near pre pandemic demand, modest profits, and rising fuel emissions.
Related reading
01 · Category
Financial Metrics27 stats
01
Global airline net profits reached $30.5 billion in 2023.
02
Average net profit margin: 3.9% for airlines in 2023.
03
Passenger revenue: $744 billion globally in 2023.
04
US airlines operating revenue: $193 billion in 2023.
05
Cargo revenue contribution: 12% of total airline revenue.
06
Fuel costs: 28% of total operating expenses in 2023.
07
Average yield per RPK: 11.3 cents in 2023.
08
Delta Air Lines net profit: $4.6 billion in 2023.
09
Ryanair operating profit: €2.5 billion for FY2023.
10
Emirates revenue: AED 119.8 billion in 2023.
11
Southwest Airlines revenue growth: 12% YoY to $26.1B.
12
Global airline debt: $700 billion as of end-2023.
13
Ancillary revenue per passenger: $20globally.
14
Lufthansa Group profit: €2.7 billion in 2023.
15
Air France-KLM revenue: €29.9 billion.
16
United Airlines EBIT: $7.8 billion in 2023.
17
IAG (British Airways parent) profit: €3.5 billion.
18
JetBlue net loss reduced to $189 million in 2023.
19
Global airline cash reserves: $250 billion end-2023.
20
Labor costs: 25% of operating expenses.
21
American Airlines revenue: $52.8 billion.
22
Singapore Airlines profit: SGD 2.9 billion.
23
Qantas revenue: AUD 22.8 billion FY2023.
24
easyJet pre-tax profit: £478 million.
25
Turkish Airlines revenue: $19.7 billion.
26
Return on invested capital (ROIC): 7.2% industry average.
27
Global airlines EBITDA: $100 billion in 2023.
Interpretation
Financial Metrics Interpretation
In 2023 the airline industry generated $30.5 billion in net profit on average with a thin 3.9% net margin, showing that despite strong passenger revenue of $744 billion and fuel costs of 28% of operating expenses, overall financial performance remains tightly constrained.
02 · Category
Operational Data22 stats
01
World fleet size: 28,400 aircraft in service end-2023.
02
Narrowbody aircraft: 60% of global fleet.
03
Average aircraft age: 12.5 years globally.
04
Boeing 737 family: 5,000+ in service.
05
Airbus A320 family: 10,000 ordered.
06
Daily global flights: 100,000 in 2023 average.
07
US airlines: 5,000 daily departures.
08
Cargo fleet: 2,500 freighters worldwide.
09
Average daily utilization: 11 hours per aircraft.
10
Widebody aircraft: 25% of fleet by capacity.
11
Regional jets: 20% of departures.
12
Slots at top 30 airports: 70% utilization.
13
Pilot shortage: 34,000 globally by 2025 projection.
14
New aircraft deliveries: 1,200 in 2023.
15
Engine maintenance market: $80 billion annually.
16
Ground staff: 2.5 million employees.
17
Cabin crew ratio: 1 per 50 seats average.
18
Air traffic control delays: 15% of flights.
19
Busiest route: ATL-JFK with 5 million pax.
20
Longest flight: Singapore-New York 18.4 hours.
21
Airport capacity expansion: 500 million seats added.
22
Drone integration trials: 200 airports.
Interpretation
Operational Data Interpretation
Operational Data shows that with 100,000 average daily global flights in 2023 and 28,400 aircraft in service end 2023, the world is running on a relatively mature but highly utilized fleet where narrowbodies make up 60 percent and the average aircraft age is 12.5 years.
03 · Category
Passenger Statistics30 stats
01
In 2023, global airline passenger traffic reached 4.5 billion passengers, recovering to 96% of pre-pandemic levels.
02
US airlines carried 853 million passengers in 2023, a 8.5% increase from 2022.
03
International passenger traffic grew by 36.6% in 2023 compared to 2022.
04
Load factor for global airlines averaged 82.6% in 2023.
05
Asia-Pacific region saw 2.1 billion passengers in 2023.
06
Revenue Passenger Kilometers (RPKs) globally increased by 36.5% in 2023.
07
Europe airlines carried 1.0 billion passengers in 2023.
08
Low-cost carriers accounted for 37% of global seat capacity in Q4 2023.
09
Domestic US passengers hit 730 million in 2023.
10
Global available seat kilometers (ASKs) rose 26.6% in 2023.
11
Middle East carriers reported 12.4% growth in passengers.
12
China's domestic market carried 590 million passengers in 2023.
13
Latin America passenger traffic up 22% YoY in 2023.
14
African airlines saw 5.8% passenger growth in 2023.
15
Q4 2023 global load factor reached 83.1%.
16
US international passengers: 123 million in 2023.
17
India's passenger traffic: 150 million in 2023.
18
Global business travel passengers recovering to 85% of 2019 levels.
19
Leisure travel accounted for 75% of 2023 bookings.
20
Premium cabin load factor: 78% in 2023 globally.
21
Australia's domestic passengers: 70 million in 2023.
22
Brazil's airlines carried 110 million passengers.
23
Global connecting passengers: 25% of total traffic.
24
Female passengers: 48% of global total in 2023.
25
Average flight length: 1,800 km globally.
26
Peak month: December 2023 with 450 million passengers.
27
Under 35 age group: 40% of passengers.
28
First-time flyers: 15% increase in emerging markets.
29
Global on-time performance: 72% in 2023.
30
Point-to-point traffic: 60% of total passengers.
Interpretation
Passenger Statistics Interpretation
Passenger demand in 2023 rebounded strongly, with global traffic reaching 4.5 billion passengers and returning to 96% of pre pandemic levels, while international travel rose 36.6% year over year.
More related reading
04 · Category
Safety Records20 stats
01
Global fatal accidents: 1 per 5.8 million departures in 2023.
02
US accident rate: 0.09 per million departures.
03
IATA member airlines: zero fatal accidents in 2023.
04
Runway excursions: 15% of accidents.
05
Bird strikes: 15,000 incidents annually.
06
Turbulence injuries: 1,300 in 2023 globally.
07
Loss of control in-flight: 8% of fatal accidents.
08
Safety audit compliance: 95% of airlines.
09
Controlled flight into terrain: down 50% since 2010.
10
US commercial safety record: safest year ever.
11
Cargo aircraft accidents: 2 in 2023.
12
Pilot error contribution: 53% of accidents.
13
Weather-related incidents: 20%.
14
IOSA registered airlines: 420 carriers.
15
Global risk index: lowest in history at 2.18.
16
Mechanical failures: 12% of incidents.
17
Near-miss reports: 1,200 in US.
18
Fire/smoke events: 250 annually.
19
Safety management systems: 90% adoption.
20
Airline safety rating: 7/7 for 25 top carriers.
Interpretation
Safety Records Interpretation
In 2023 the overall safety picture in the airline industry looks strong, with just 1 fatal accident per 5.8 million departures globally and zero fatal accidents among IATA member airlines, even though runway excursions account for 15% of accidents and turbulence caused 1,300 injuries worldwide.
05 · Category
Sustainability And Environment15 stats
01
Global aviation CO2 emissions: 915 million tonnes in 2023.
02
Jet fuel consumption: 370 billion liters annually.
03
Sustainable Aviation Fuel (SAF) usage: 0.2% of fuel.
04
Carbon intensity per RPK: 92 grams CO2.
05
CORSIA participation: 90% of international traffic.
06
NOx emissions: 15 million tonnes yearly.
07
Aircraft noise complaints: 50,000 in Europe.
08
Fuel efficiency improvement: 2.5% annually.
09
SAF production capacity: 1 million tonnes 2023.
10
Net-zero pledge by 2050: 100% IATA members.
11
Electric aircraft tests: 50 prototypes.
12
Hydrogen flight demos: 20 planned by 2030.
13
Carbon offset programs: 25 million tonnes.
14
Airport electrification: 30% ground equipment.
15
Contrail mitigation research: 40% reduction potential.
Interpretation
Sustainability And Environment Interpretation
In the sustainability and environment space, global aviation is still driving a massive footprint with 915 million tonnes of CO2 in 2023 while only 0.2% of jet fuel is SAF, showing that even with 90% CORSIA participation, cutting emissions at the source remains far from the level needed.
Reference
Cite This Report
This report is designed to be cited. We maintain stable URLs and versioned verification dates. Copy the format appropriate for your publication below.
APA
Megan Gallagher. (2026, February 13). Airline Industry Statistics. Gitnux. https://gitnux.org/airline-industry-statistics
MLA
Megan Gallagher. "Airline Industry Statistics." Gitnux, 13 Feb 2026, https://gitnux.org/airline-industry-statistics.
Chicago
Megan Gallagher. 2026. "Airline Industry Statistics." Gitnux. https://gitnux.org/airline-industry-statistics.
Sources & references
54 datasets cited across this report · attribution is report-level