In today’s rapidly evolving digital landscape, web application performance has become increasingly critical for businesses across all industries. As the virtual gateways to an organization’s products and services, web applications play an integral role in shaping user experience, driving consumer satisfaction, and influencing overall brand perception.
This is where web application performance metrics come into play. These vital indicators enable us to measure, analyze, and optimize the efficiency, reliability, and overall user experience of web applications. In this blog post, we will delve into essential web application performance metrics, their significance, and best practices for maximizing your application’s effectiveness in delivering an outstanding user experience. Join us as we explore the intricacies of these crucial KPIs and discuss strategies to help ensure your web application operates at its optimum potential.
Web Application Performance Metrics You Should Know
1. Load Time
The amount of time it takes for a web application to fully load and become interactive. This includes all the resources such as images, stylesheets, and scripts.
2. Time to First Byte (TTFB)
The time it takes for a client to receive the first byte of data from the server. This metric is helpful in determining the efficiency of your server and network infrastructure.
3. First Contentful Paint (FCP)
The time it takes for the first content element (e.g., text or image) to be rendered on the screen. This metric gives an idea of how quickly your application starts displaying content to users.
4. First Input Delay (FID)
The time it takes for the web app to respond to the first user interaction, like clicking a button or entering text. This metric helps measure responsiveness and user experience.
5. Speed Index
A performance metric that shows how quickly the content on your web page is visually displayed. Lower values indicate faster loading and better perceived user experience.
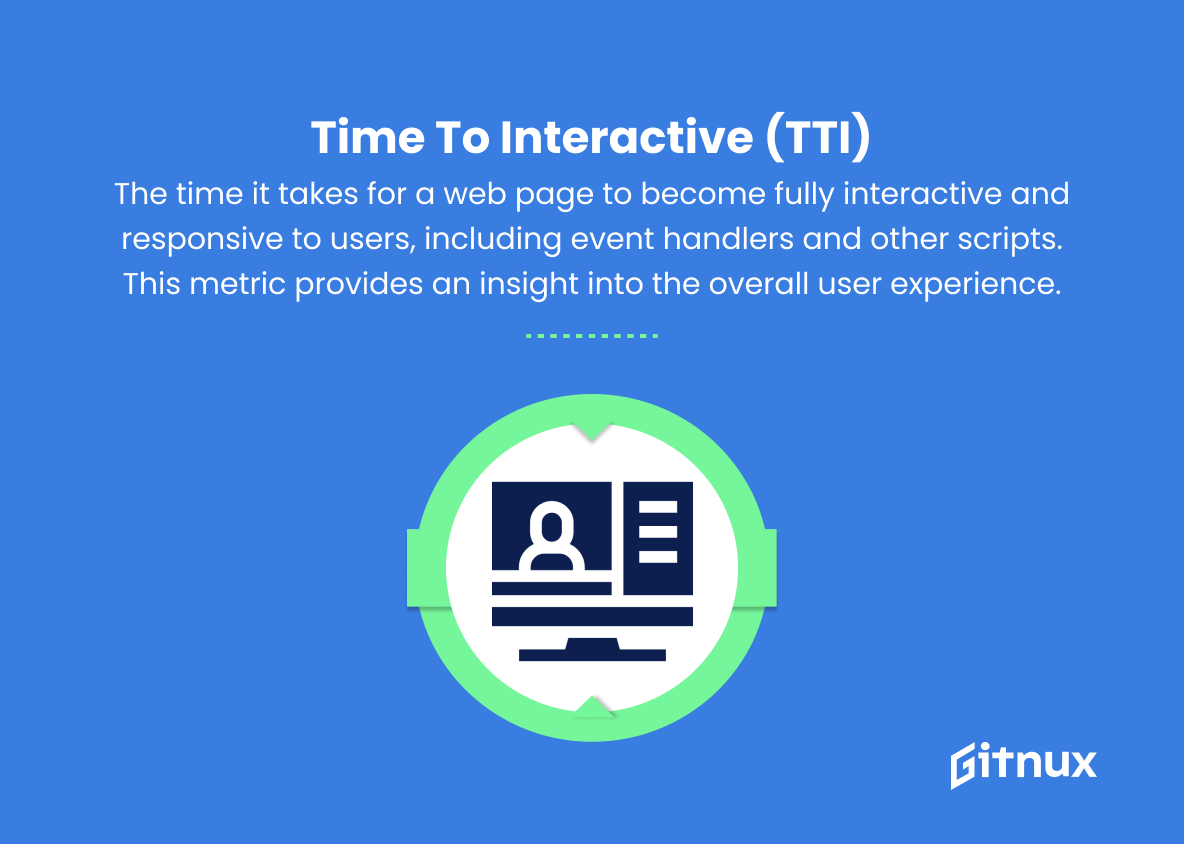
6. Time to Interactive (TTI)
The time it takes for a web page to become fully interactive and responsive to users, including event handlers and other scripts. This metric provides an insight into the overall user experience.
7. Cumulative Layout Shift (CLS)
Measures the movement of visible elements on your web page during the page load. High CLS values indicate an unfavorable user experience, as content shifting may cause users to make unintended clicks or struggle to read.
8. Largest Contentful Paint (LCP)
The time it takes for the largest content element (e.g., image, video or text block) to be rendered on the screen. This metric focuses on the perceived loading speed of the main content.
9. Request Count
The total number of HTTP requests made by a web page. Reducing the number of requests can improve web app performance by reducing network overhead.
10. Error Rate
The percentage of errors that occur during a specific time period. This can help identify issues with the web application, such as server downtime, broken links or failed requests.
11. Throughput
The amount of data transmitted over the network during a specific time period. Higher throughput indicates a smoother, faster-loading web application.
12. Session Duration
The average length of time users spend on your web application during a single session. Higher session duration can indicate engaged users and a satisfying user experience.
13. Bounce Rate
The percentage of users who leave your web application after viewing only one page. A high bounce rate can indicate poor user experience, slow loading times or irrelevant content.
14. Conversion Rate
The percentage of users who complete the desired action on your web application (e.g., make a purchase, sign up for a newsletter). This metric is crucial for understanding the effectiveness of your web application in achieving its goals.
Web Application Performance Metrics Explained
Web Application Performance Metrics are essential for understanding how users experience and interact with web applications. Load Time, Time to First Byte, First Contentful Paint, and Largest Contentful Paint help measure the perceived speed of a web app, giving an idea of the app’s initial rendering capabilities. First Input Delay, Time to Interactive, and Cumulative Layout Shift provide insights into the responsiveness and user experience, as they indicate if users can easily interact with the app without disruptions. Speed Index, Request Count, Error Rate, and Throughput are crucial for evaluating the technical performance of an app, shedding light on network efficiency and potential bottlenecks.
Finally, Session Duration, Bounce Rate, and Conversion Rate help assess the overall satisfaction of users, revealing if they stay engaged with the app and if it effectively achieves its goals. Monitoring and optimizing these metrics can lead to improved user experience, increased user engagement, and higher conversion rates.
Conclusion
In conclusion, understanding and effectively utilizing web application performance metrics is essential for creating a seamless and efficient online experience for users. By focusing on the right metrics such as page load time, Time to Interactive, server response time, and resource utilization, developers can optimize their web applications and ensure continuous performance improvements.
Periodically assessing these metrics and taking corrective action as needed will not only lead to greater customer satisfaction but also positively impact the success of your online presence. Remember, in this digital age, performance is a key factor in determining your web application’s competitiveness and a crucial element in creating lasting user engagement.
