
In today’s fast-paced and competitive business environment, effective software development is critical to staying ahead and delivering optimal value to customers. To ensure the success and efficiency of software development projects, it is essential to have a clear understanding of the key performance indicators (KPIs) that matter most. Leveraging these KPIs enables organizations to make informed decisions, increase productivity, and ultimately achieve their strategic goals.
In this comprehensive blog post, we will delve into the most critical software development KPIs that should be on every development team’s radar. We will explore their importance, share practical tips for measuring them, and discuss how they can contribute to the successful delivery of high-quality software solutions.
Software Development KPIs You Should Know
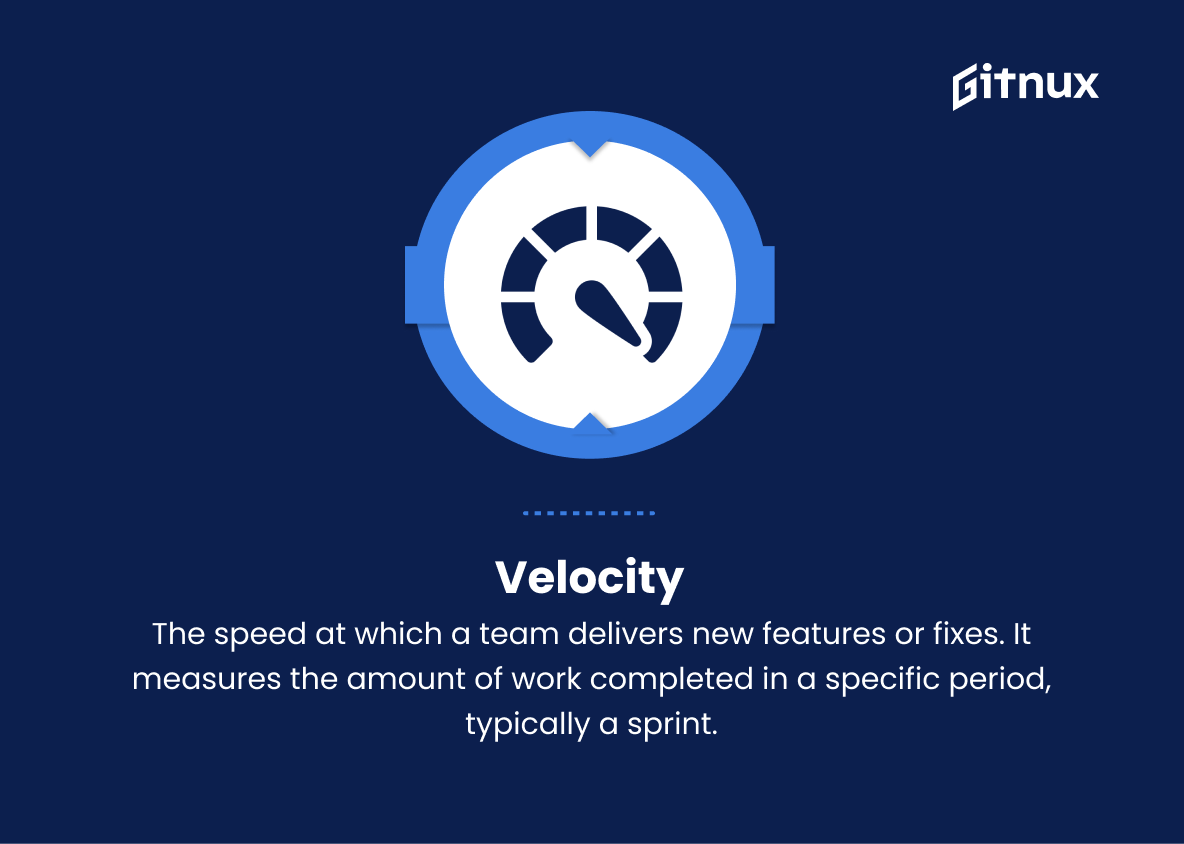
1. Velocity
The speed at which a team delivers new features or fixes. It measures the amount of work completed in a specific period, typically a sprint.
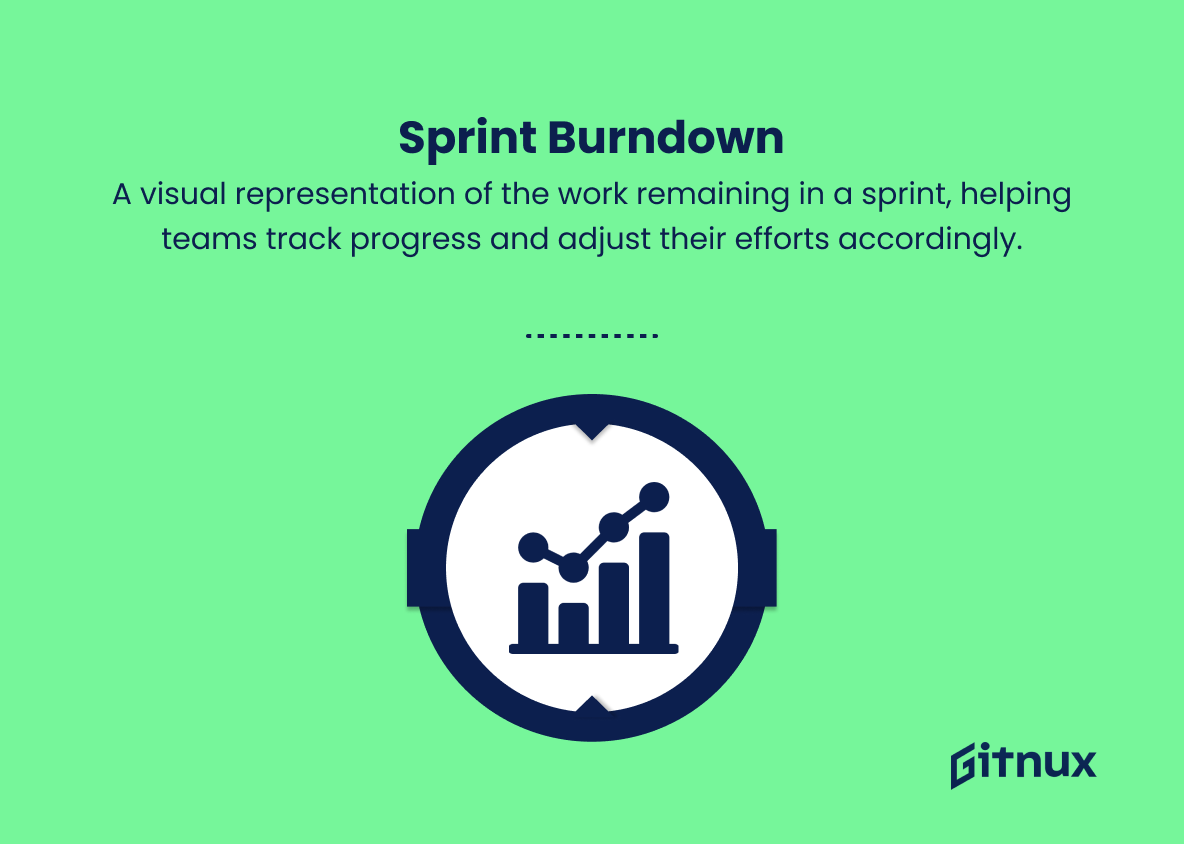
2. Sprint Burndown
A visual representation of the work remaining in a sprint, helping teams track progress and adjust their efforts accordingly.
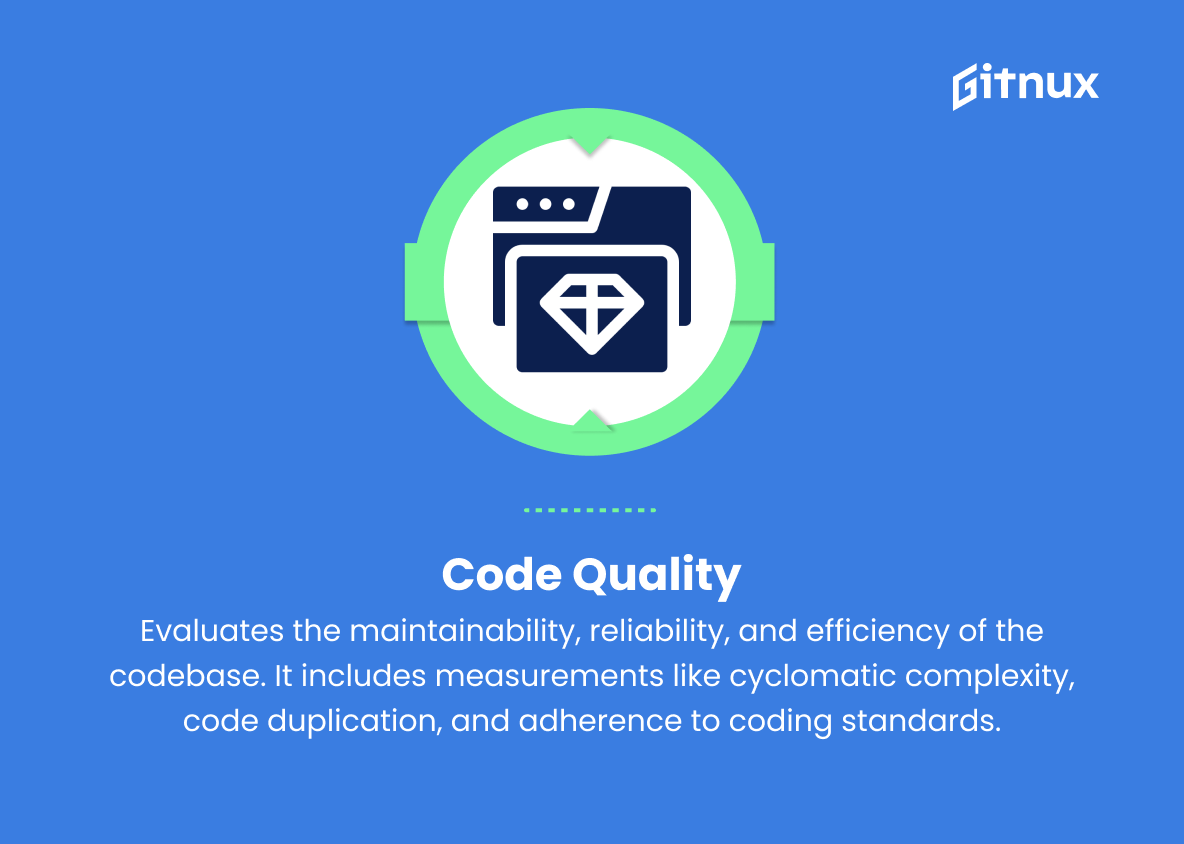
3. Code Quality
Evaluates the maintainability, reliability, and efficiency of the codebase. It includes measurements like cyclomatic complexity, code duplication, and adherence to coding standards.
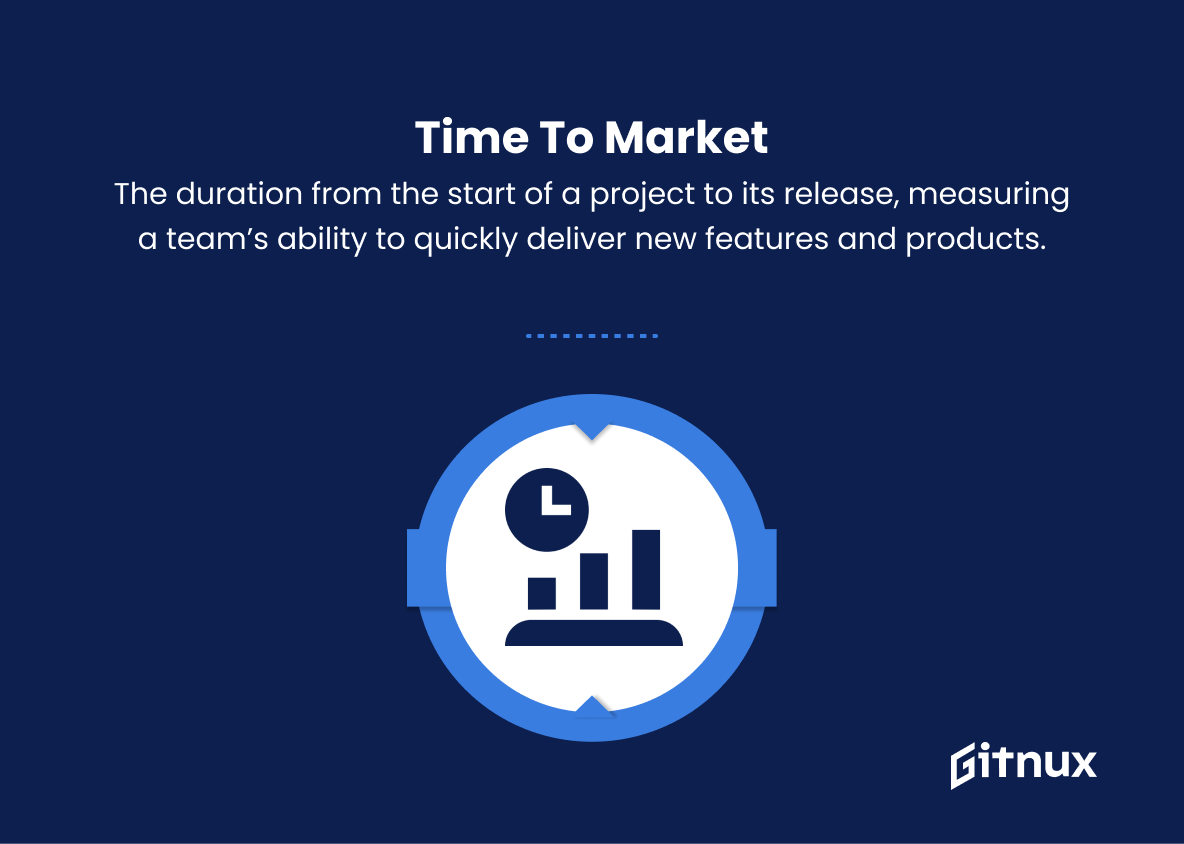
In today’s fast-paced and competitive business landscape, effective software development is crucial to staying ahead and delivering optimal value to customers.4. Time to Market
The duration from the start of a project to its release, measuring a team’s ability to quickly deliver new features and products.
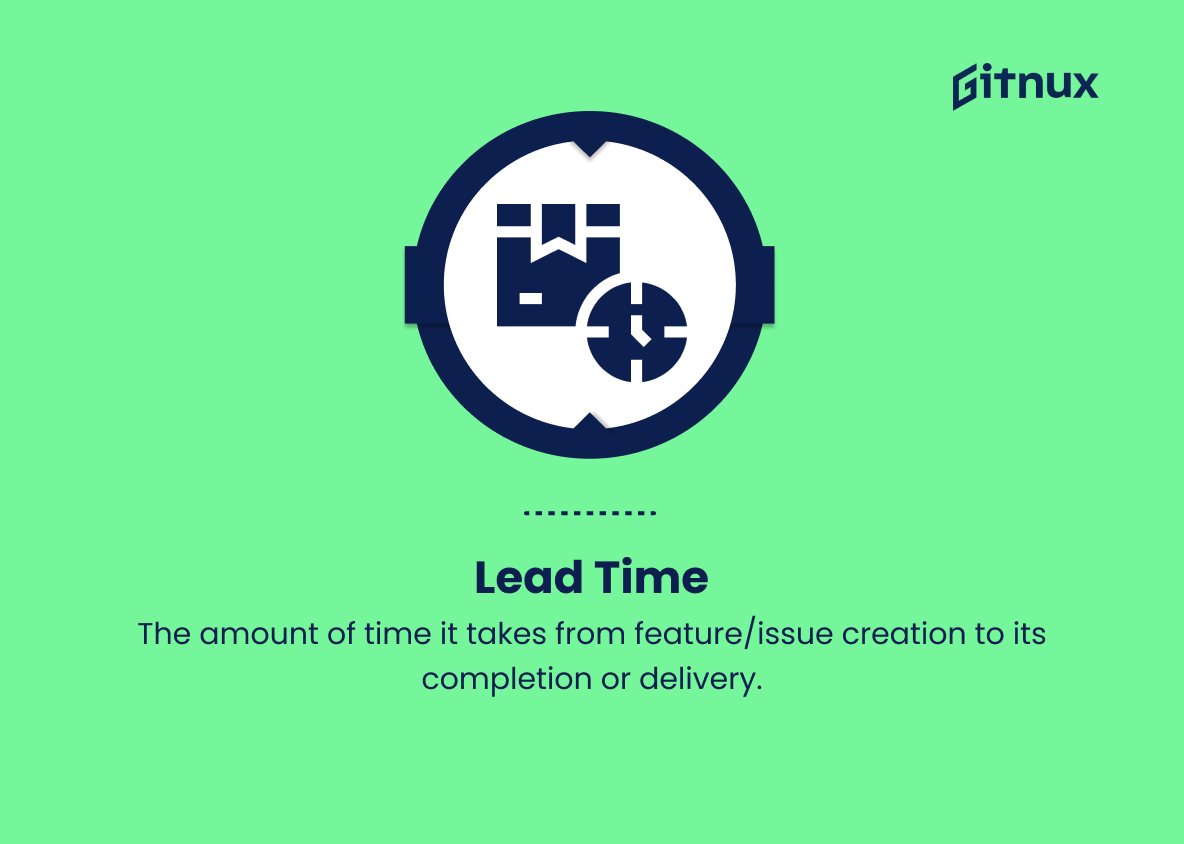
5. Lead Time
The amount of time it takes from feature/issue creation to its completion or delivery.
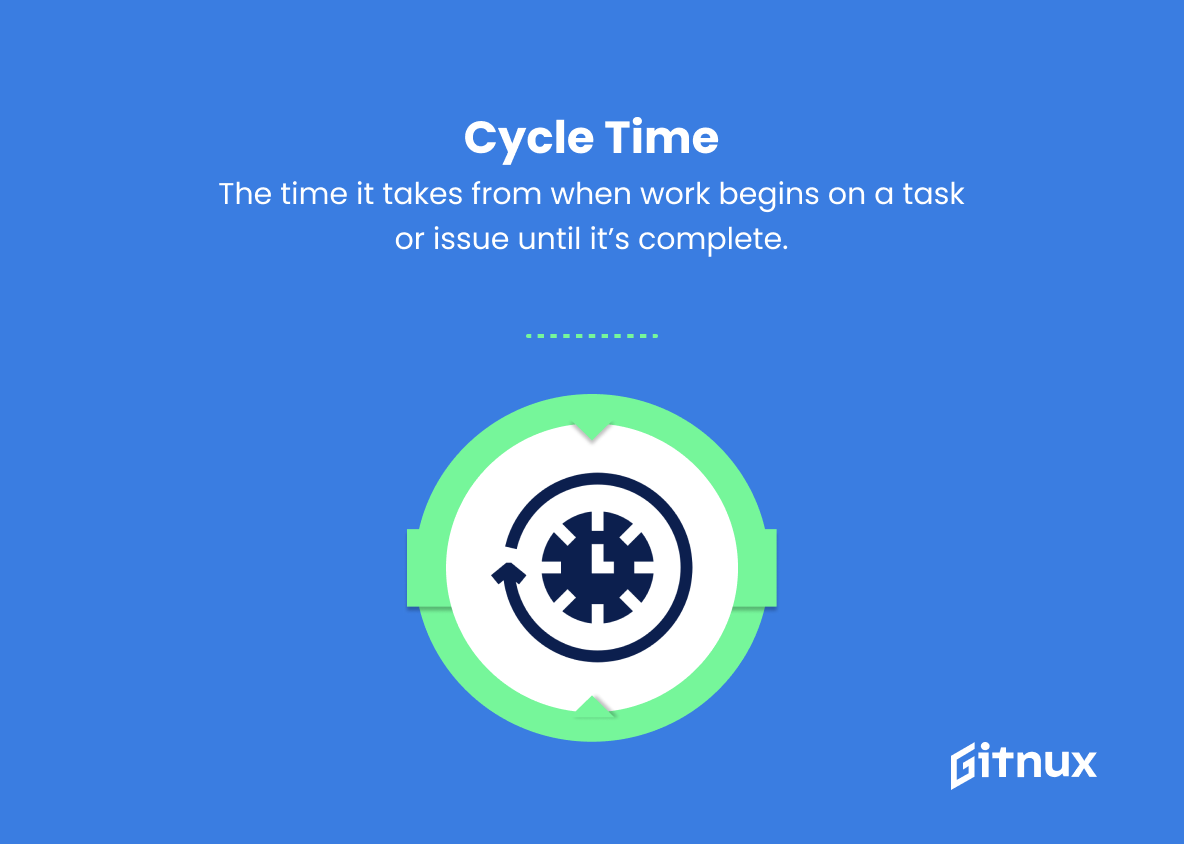
6. Cycle Time
The time it takes from when work begins on a task or issue until it’s complete.
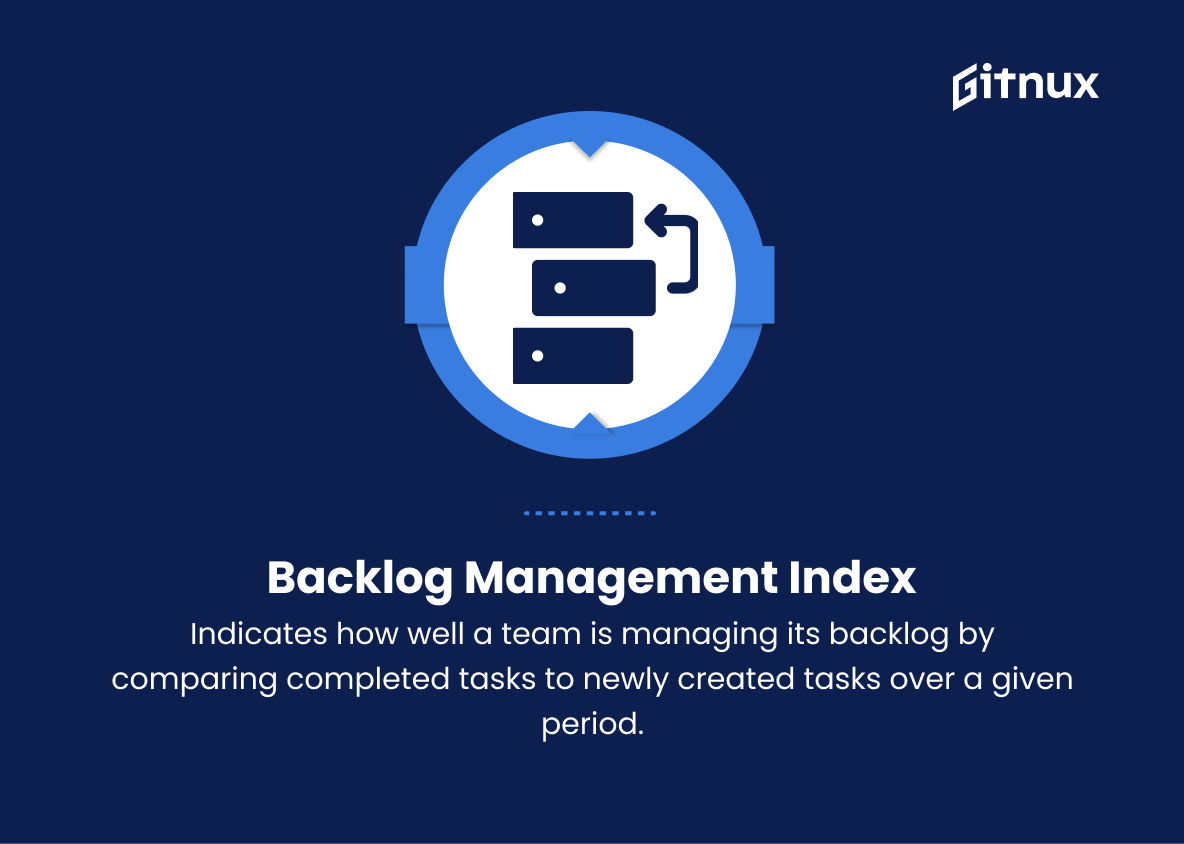
7. Backlog Management Index (BMI)
Indicates how well a team is managing its backlog by comparing completed tasks to newly created tasks over a given period.
8. Defect Density
Measures the number of defects found in software, relative to its size (e.g., per 1,000 lines of code).
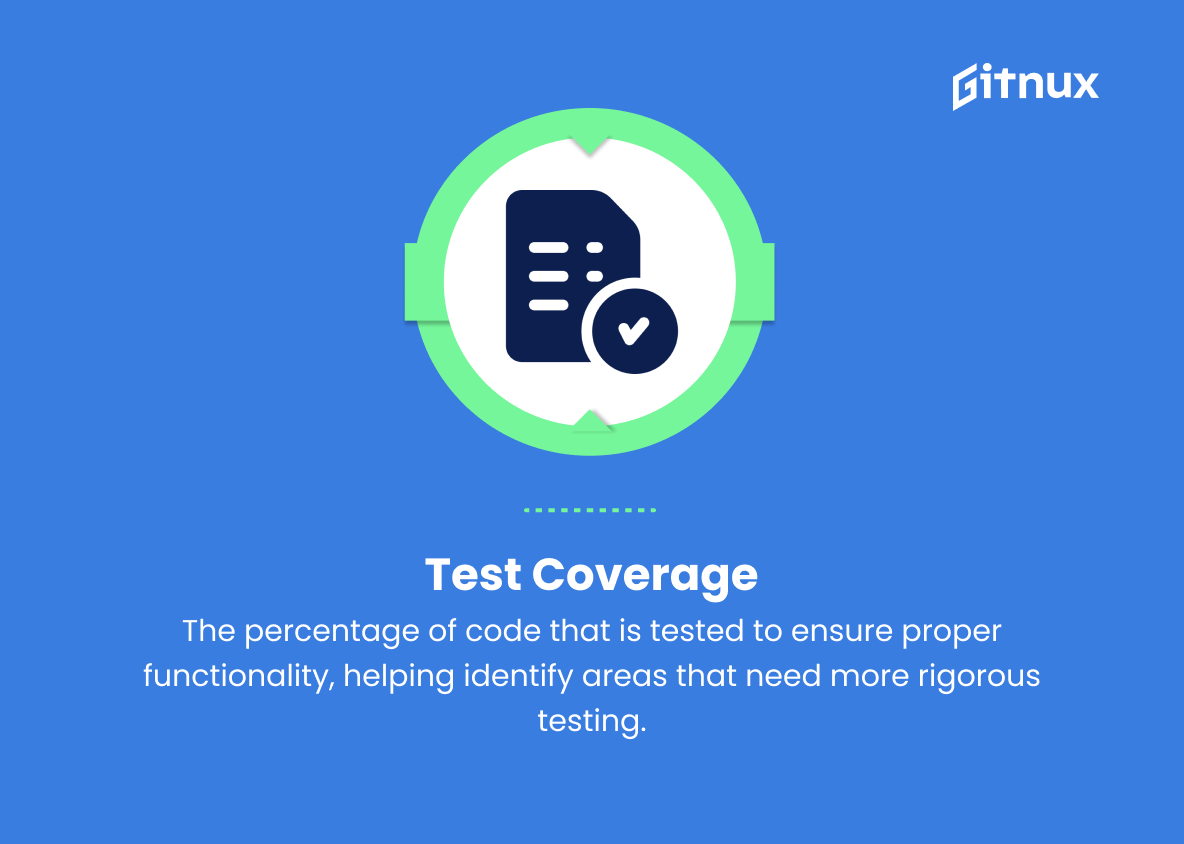
9. Test Coverage
The percentage of code that is tested to ensure proper functionality, helping identify areas that need more rigorous testing.
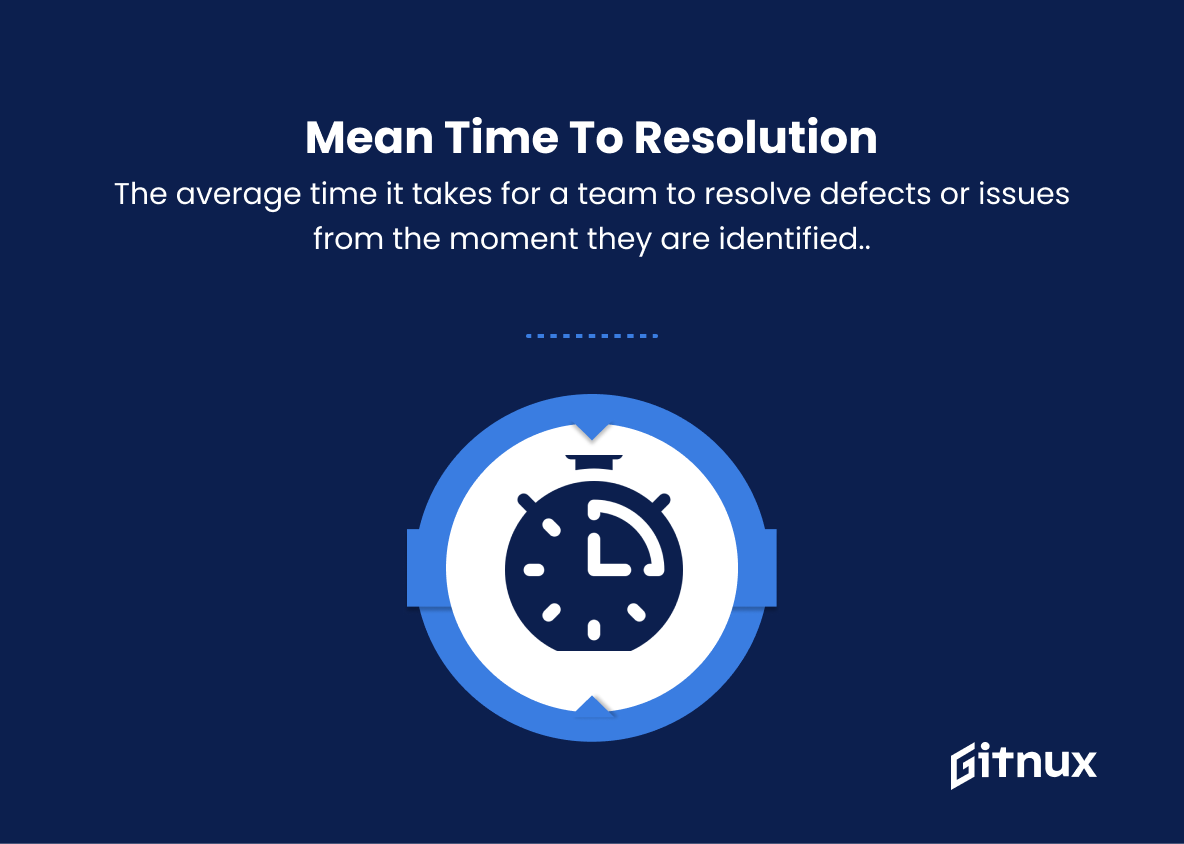
10. Mean Time to Resolution (MTTR)
The average time it takes for a team to resolve defects or issues from the moment they are identified.
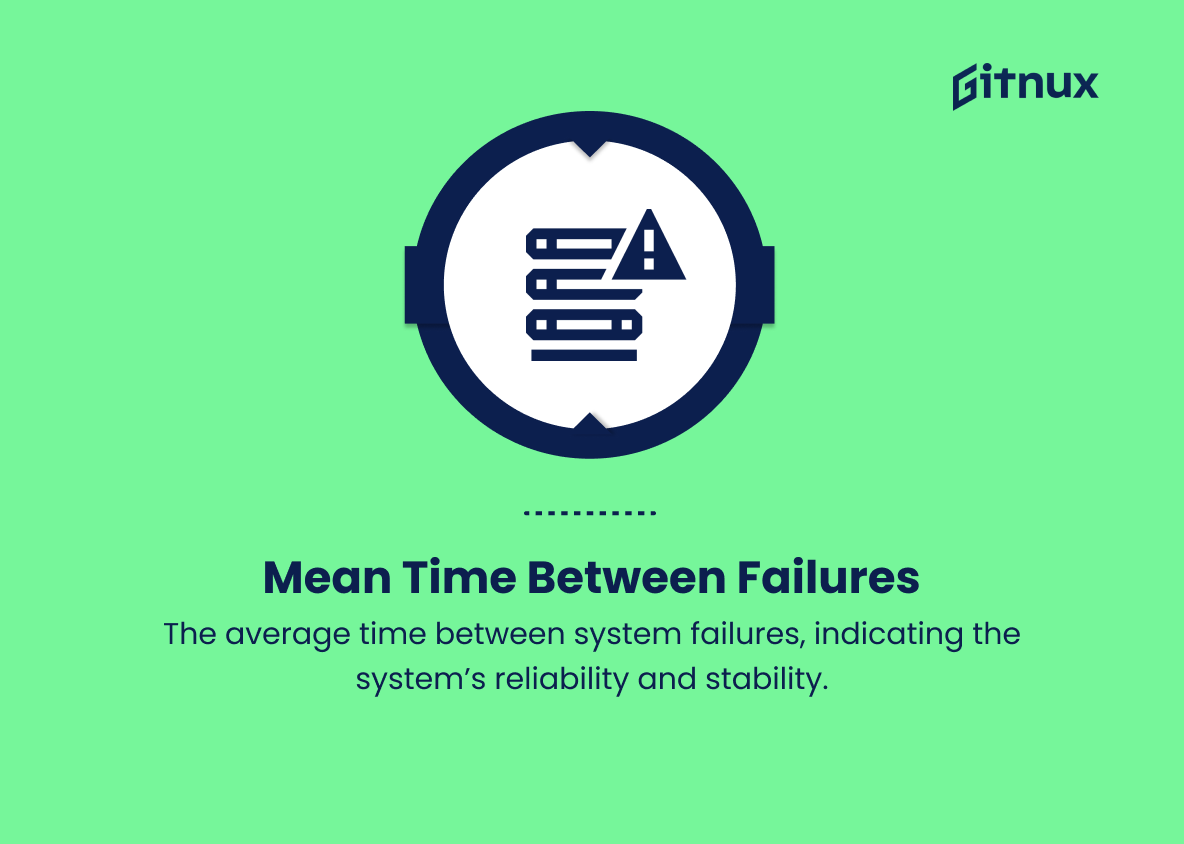
11. Mean Time Between Failures (MTBF)
The average time between system failures, indicating the system’s reliability and stability.
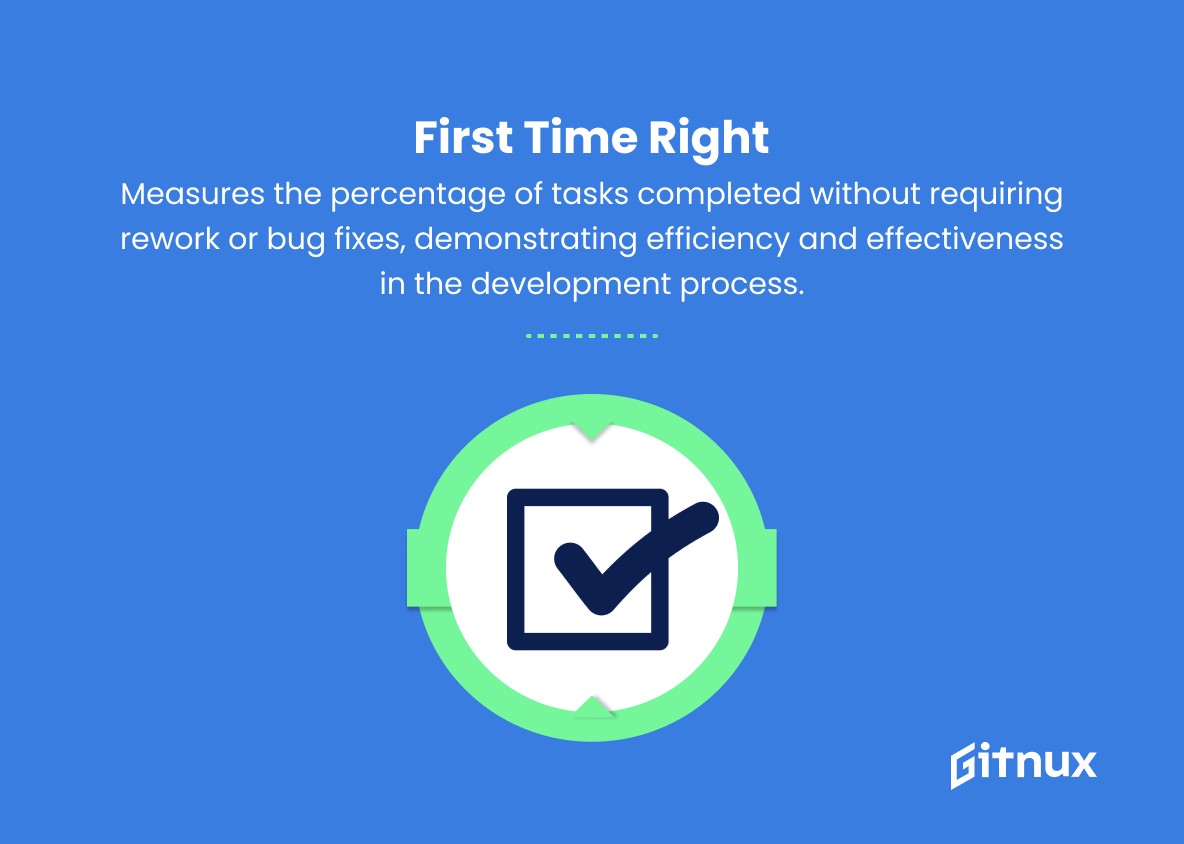
12. First Time Right (FTR)
Measures the percentage of tasks completed without requiring rework or bug fixes, demonstrating efficiency and effectiveness in the development process.
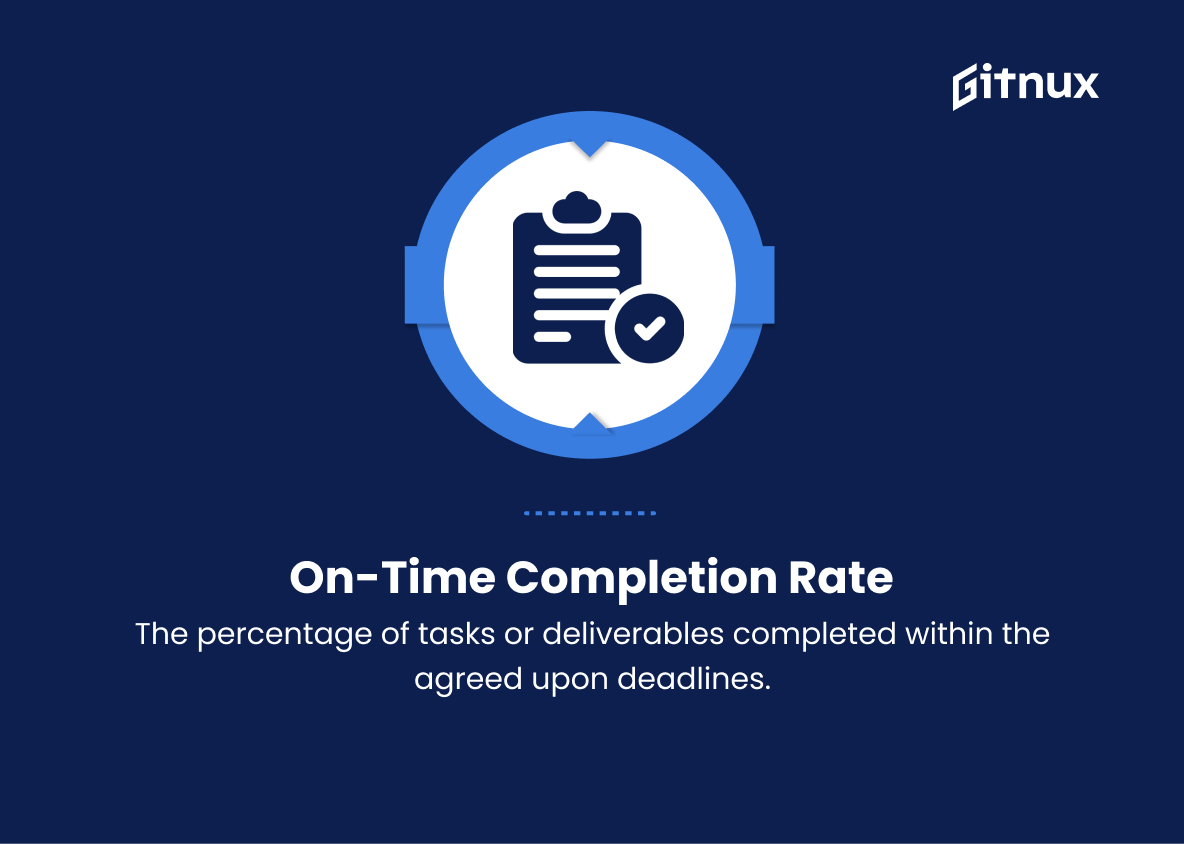
13. On-Time Completion Rate
The percentage of tasks or deliverables completed within the agreed upon deadlines.
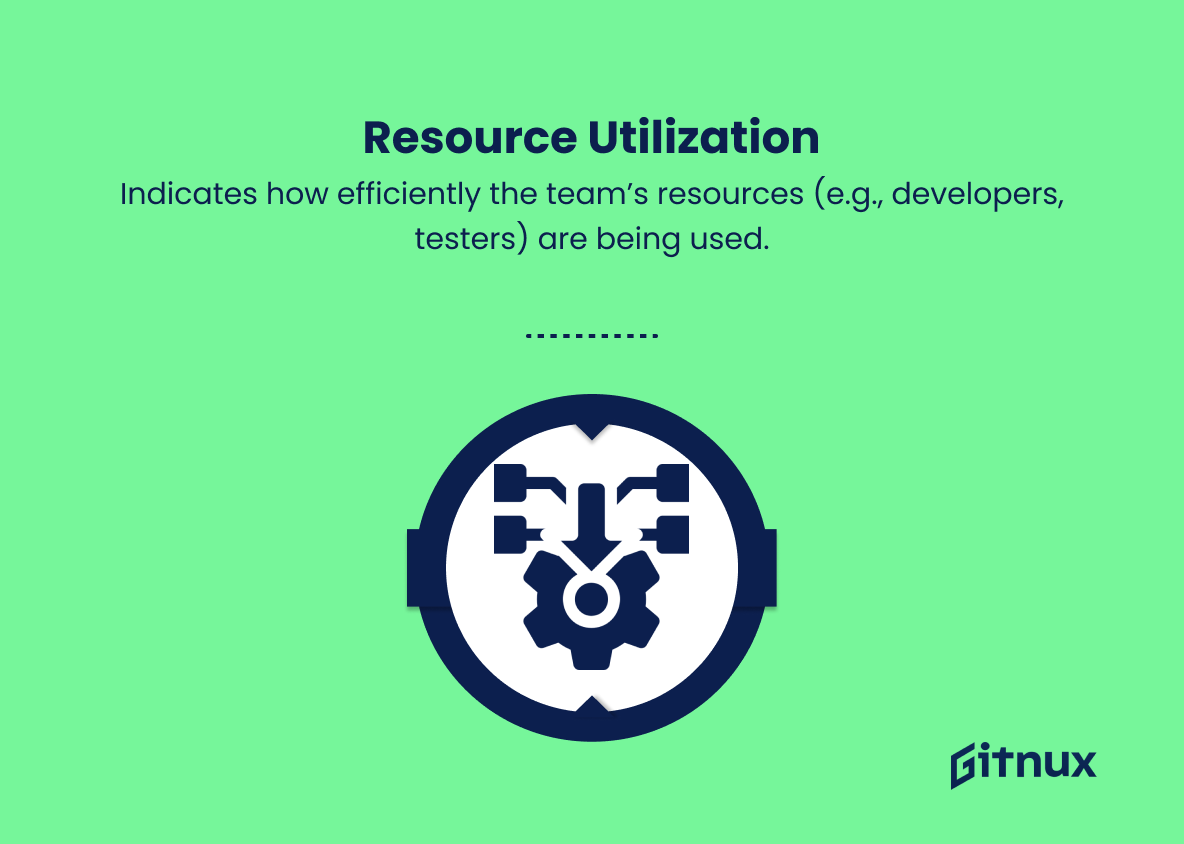
14. Resource Utilization
Indicates how efficiently the team’s resources (e.g., developers, testers) are being used.
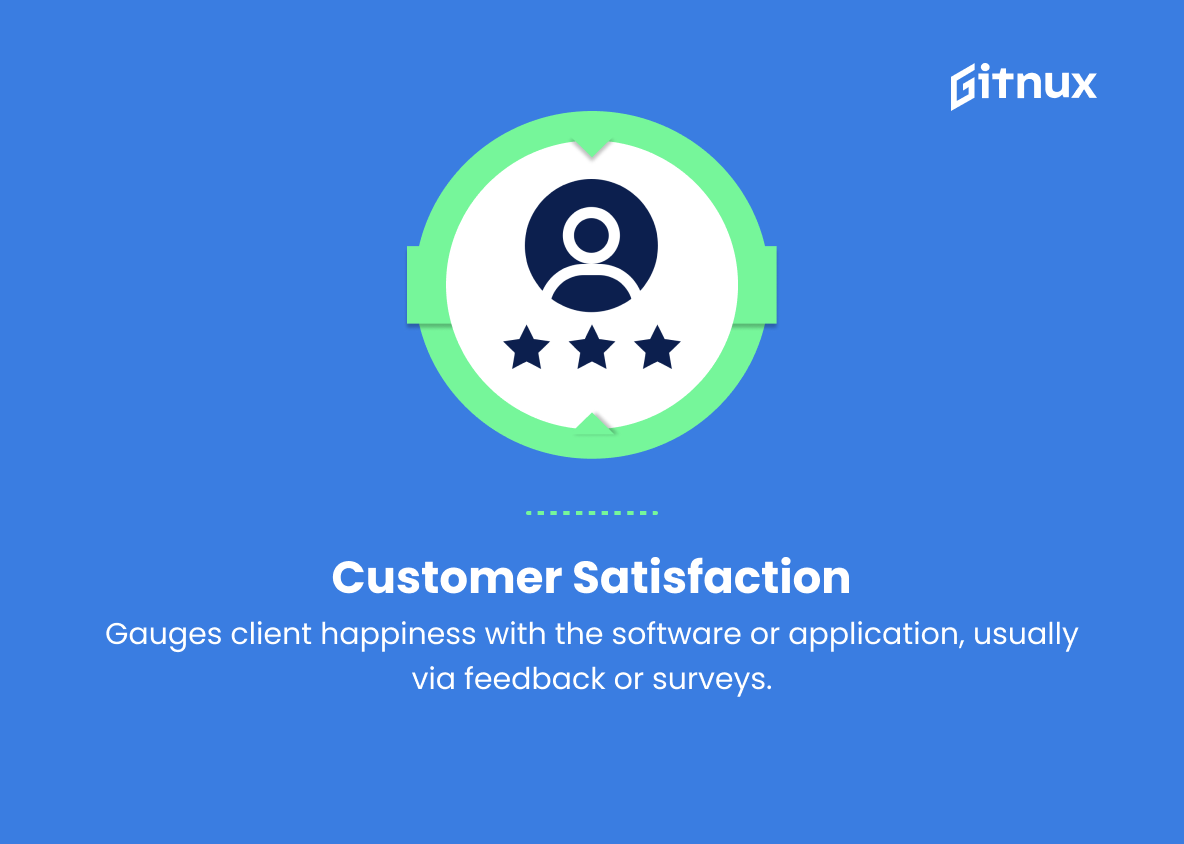
15. Customer Satisfaction
Gauges client happiness with the software or application, usually via feedback or surveys.
16. User Adoption Rate
Tracks how many users actively engage with the software, both new and returning.
17. Return on Investment (ROI)
The financial return from a software development project in comparison to the costs invested in it.
18. Feature Usage
Identifies which features are being utilized by end-users, helping prioritize feature development based on user needs.
19. Churn Rate
The percentage of users who stop using a software application over a specific period.
Software development KPIs are crucial indicators that help drive success and efficiency in the development process.20. Net Promoter Score (NPS)
Measures customer loyalty and satisfaction by evaluating the likelihood that users will recommend the software to others.
Software Development KPIs Explained
Software development KPIs are critical indicators that help drive success and efficiency in the development process. Velocity helps measure a team’s productivity by measuring the amount of work completed in a given period of time. Sprint burndown charts provide a visual representation of work progress, ensuring that teams stay on track and make necessary adjustments. Code quality is essential to creating a robust, maintainable, and efficient codebase.
Time to Market highlights the team’s ability to deliver new features or products quickly, while Lead Time and Cycle Time measure the time a feature or task takes from creation to completion. The Backlog Management Index assesses the team’s ability to manage backlogs. Defect Density, Test Coverage, MTTR, and MTBF are critical to identifying and resolving software defects to ensure system reliability and stability.
First Time Right, On-Time Completion Rate, and Resource Utilization measure the team’s efficiency and effectiveness, while customer-centric KPIs such as Customer Satisfaction, User Adoption Rate, ROI, Feature Usage, Churn Rate, and NPS help prioritize features, drive user engagement, and measure customer satisfaction to ensure a successful, customer-centric software development process.
Conclusion
In summary, software development KPIs are critical to providing a clear understanding of the performance, efficiency, and overall success of your software development processes. They allow organizations to set quantifiable goals, streamline workflows, and identify areas for improvement. Aligning these metrics with your organization’s goals will undoubtedly result in better decision making, improved team collaboration, and increased customer satisfaction.
In this ever-evolving software landscape, it is critical to continuously monitor, evaluate, and make data-driven decisions to stay competitive and drive innovation. Embrace these KPIs and unlock the full potential of your software development journey.
