In today’s fast-moving digital landscape, response time metrics have emerged as a vital parameter for gauging the efficiency and effectiveness of various online services, applications, and websites. As customer expectations continue to rise, businesses must continuously strive to deliver exceptional user experiences – placing response time optimization at the forefront of their digital strategies.
In this comprehensive blog post, we will delve into the intricacies of response time metrics, examining their significance, real-world implications, and best practices for monitoring and improvement. Join us as we explore the crucial role these metrics play in shaping the future of online functionality and ensuring that our ever-evolving digital ecosystem remains relevant, reliable, and results-driven.
Response Time Metrics You Should Know
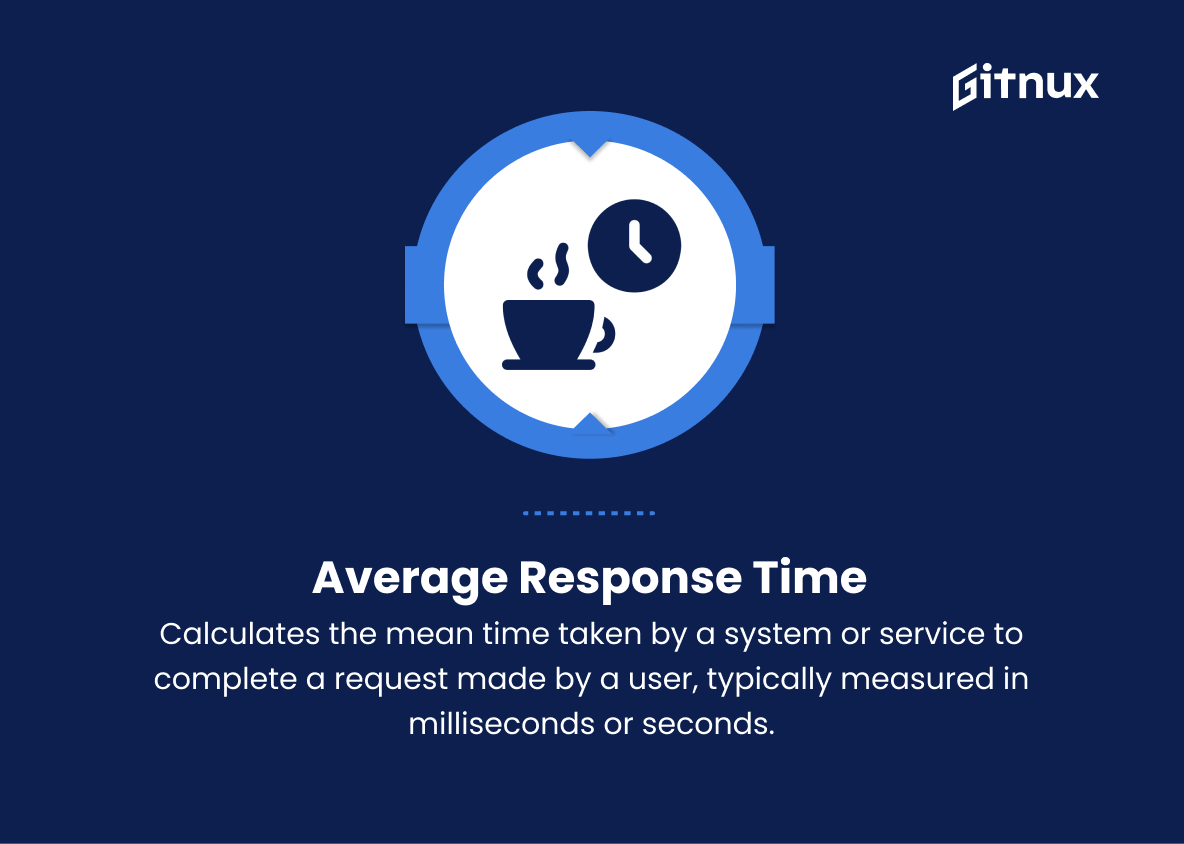
1. Average Response Time
This metric calculates the mean time taken by a system or service to complete a request made by a user, typically measured in milliseconds or seconds. It helps determine whether systems are working efficiently or if there are any bottlenecks in performance.
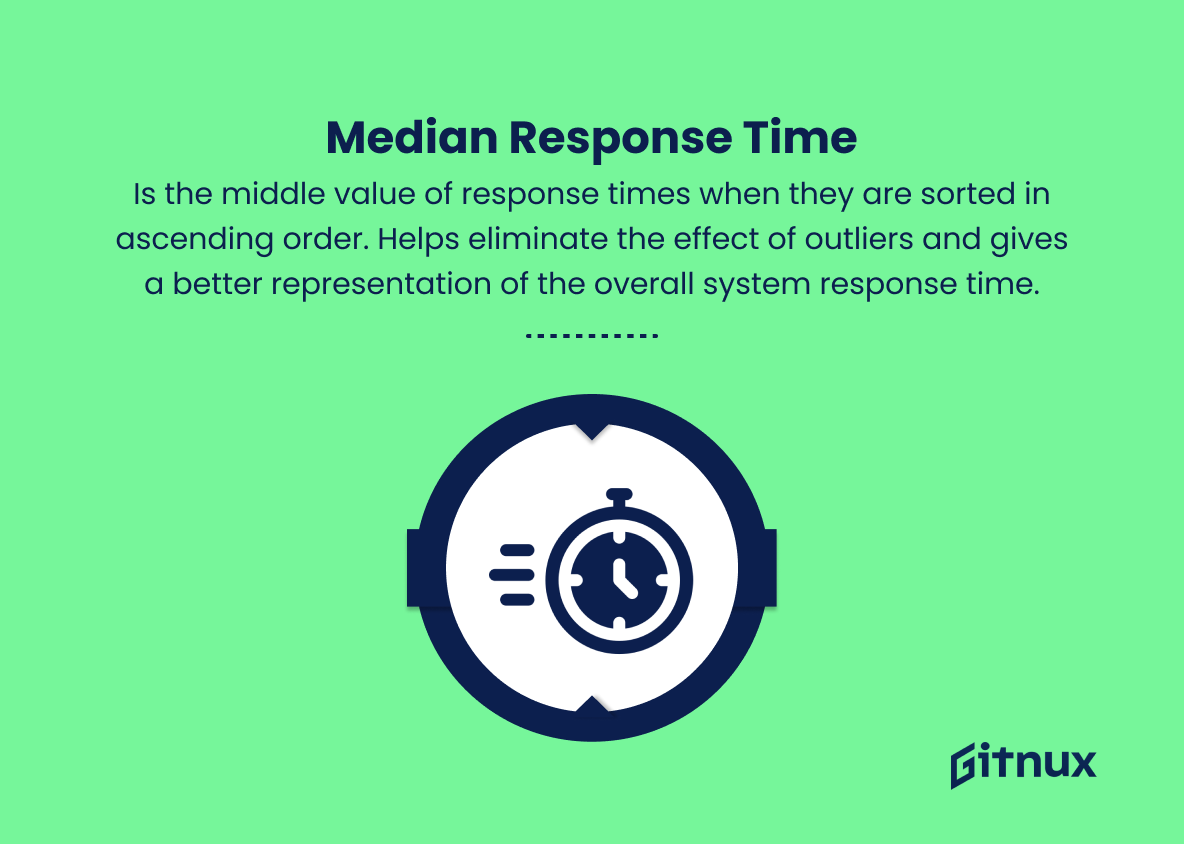
2. Median Response Time
This is the middle value of response times when they are sorted in ascending order. Median response time helps eliminate the effect of outliers and gives a better representation of the overall system response time.
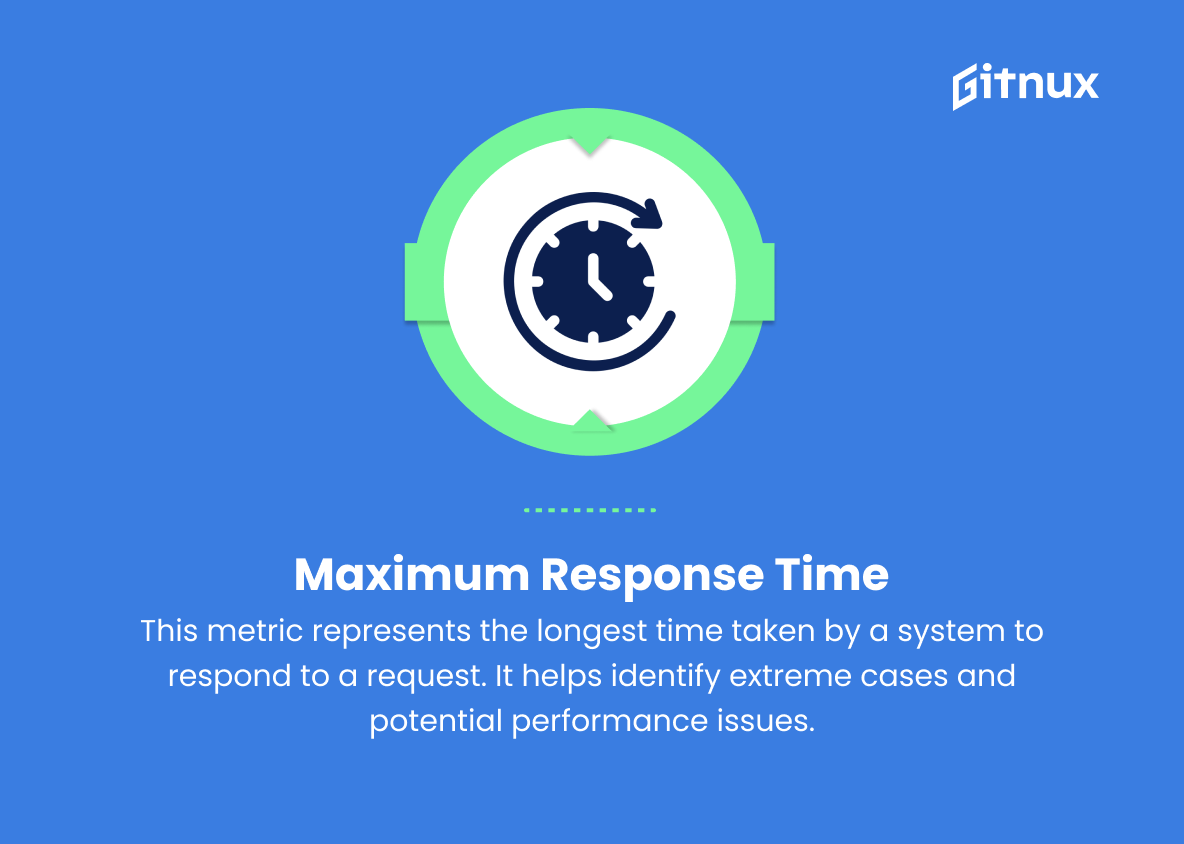
3. Maximum Response Time
This metric represents the longest time taken by a system to respond to a request. It helps identify extreme cases and potential performance issues.
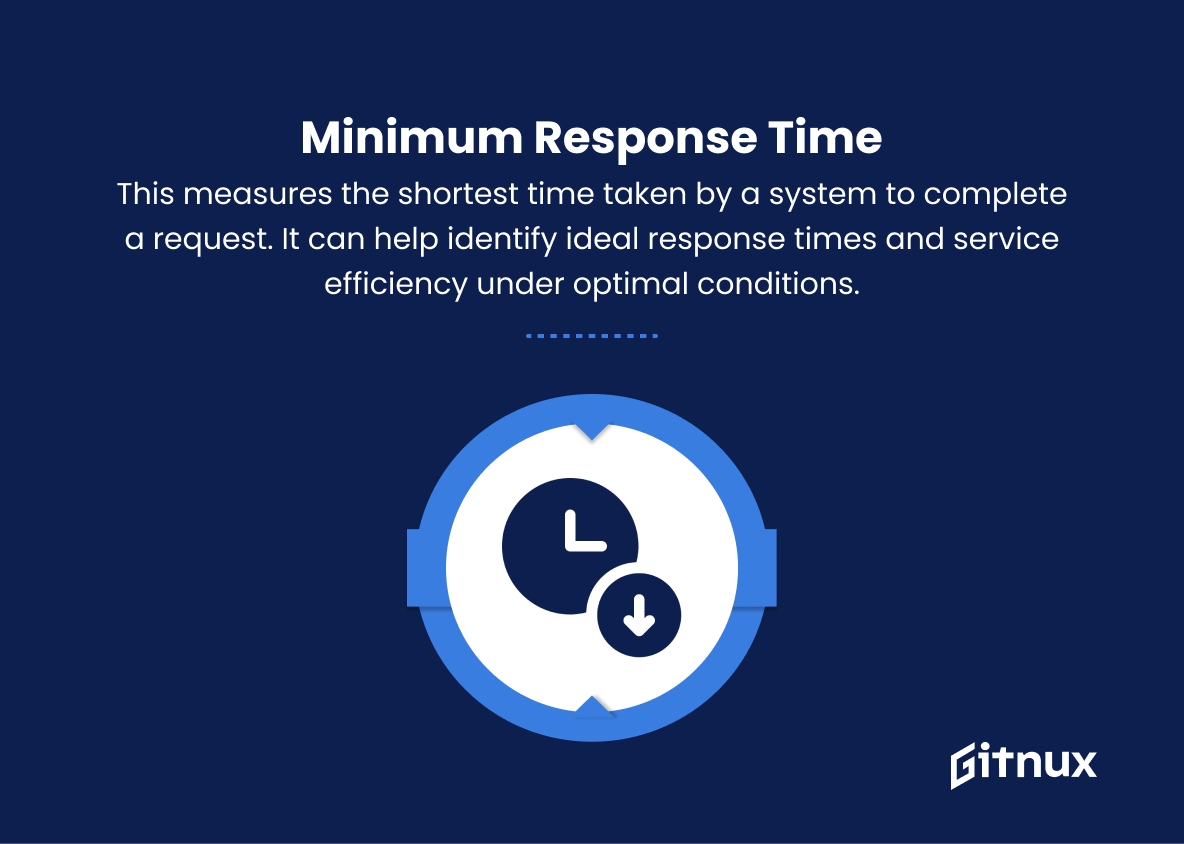
4. Minimum Response Time
This measures the shortest time taken by a system to complete a request. It can help identify ideal response times and service efficiency under optimal conditions.
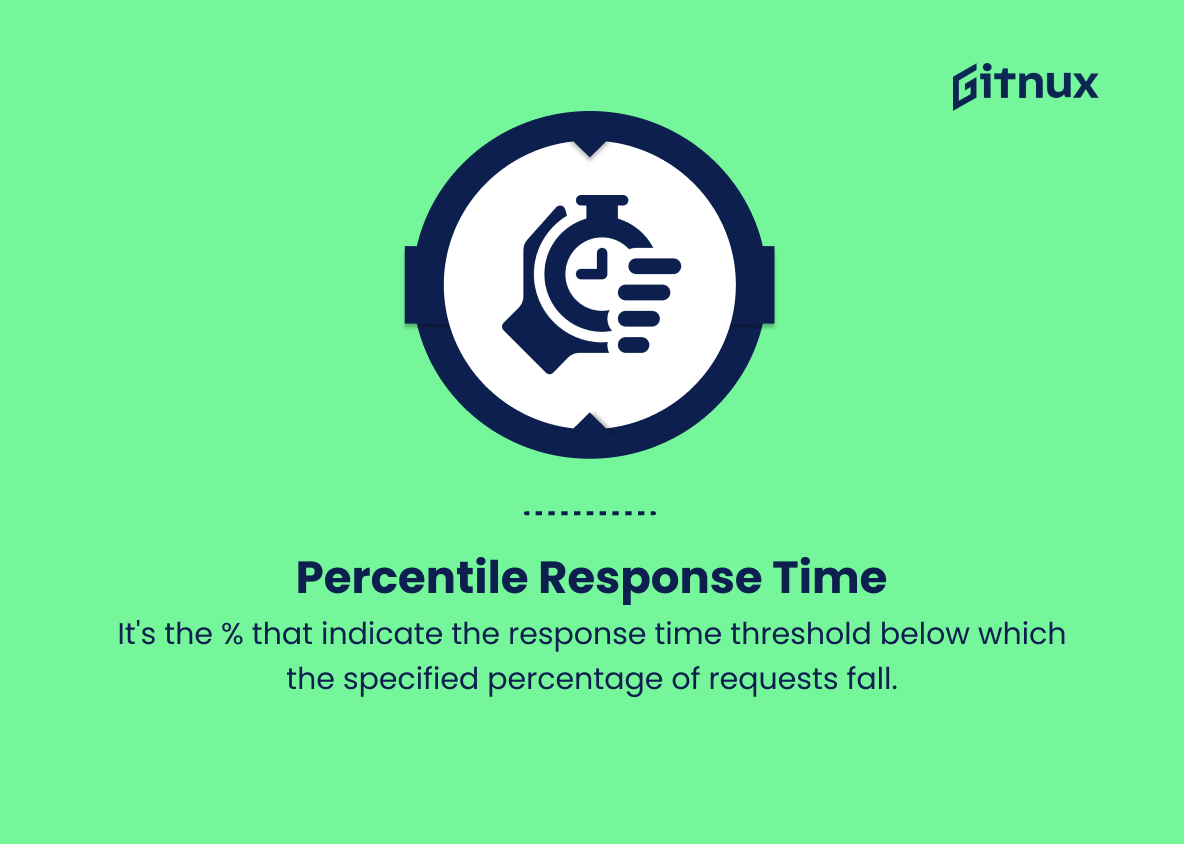
5. Percentile Response Time
These are specific percentiles (e.g., 90th, 95th, or 99th percentile) that indicate the response time threshold below which the specified percentage of requests fall. Percentile response times help identify response times under various load conditions and eliminate extreme values that may skew average response times.
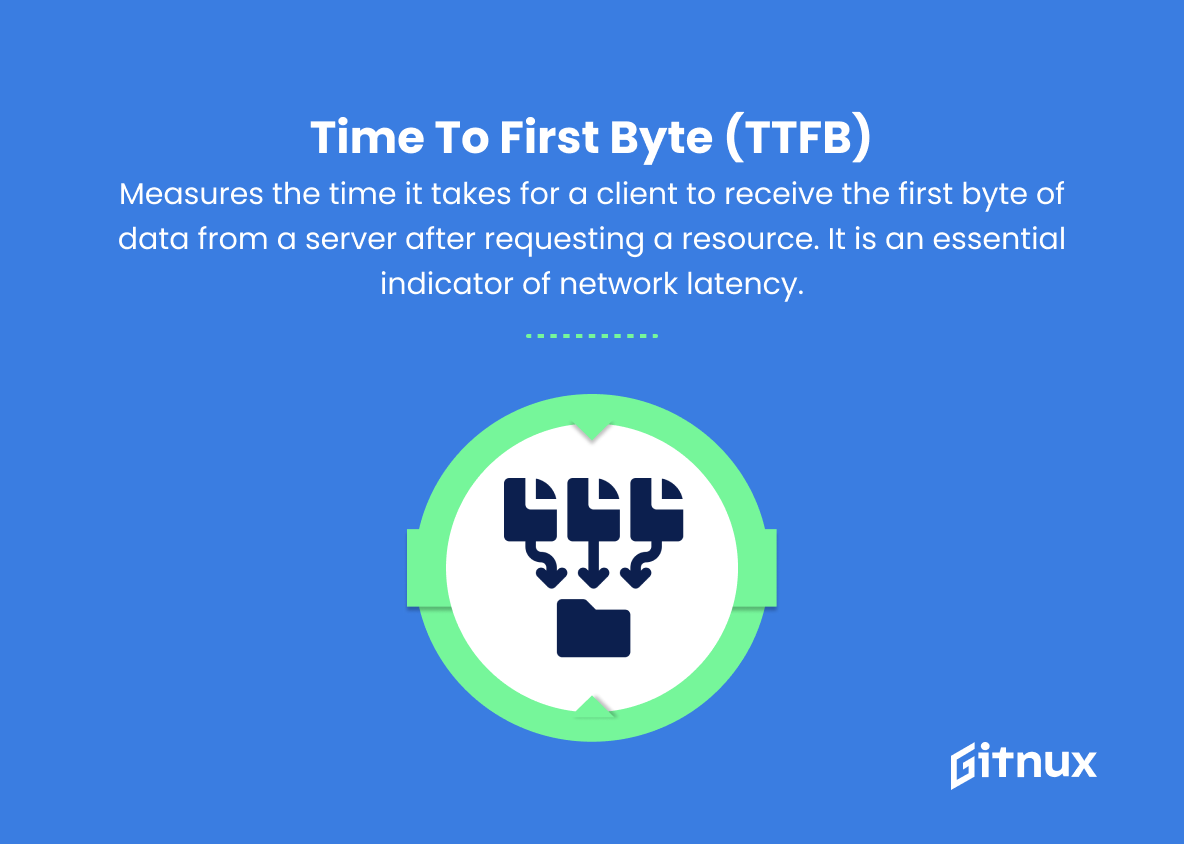
6. Time to First Byte (TTFB)
This metric measures the time it takes for a client to receive the first byte of data from a server after requesting a resource. It is an essential indicator of network latency, server performance, and the efficiency of content delivery.
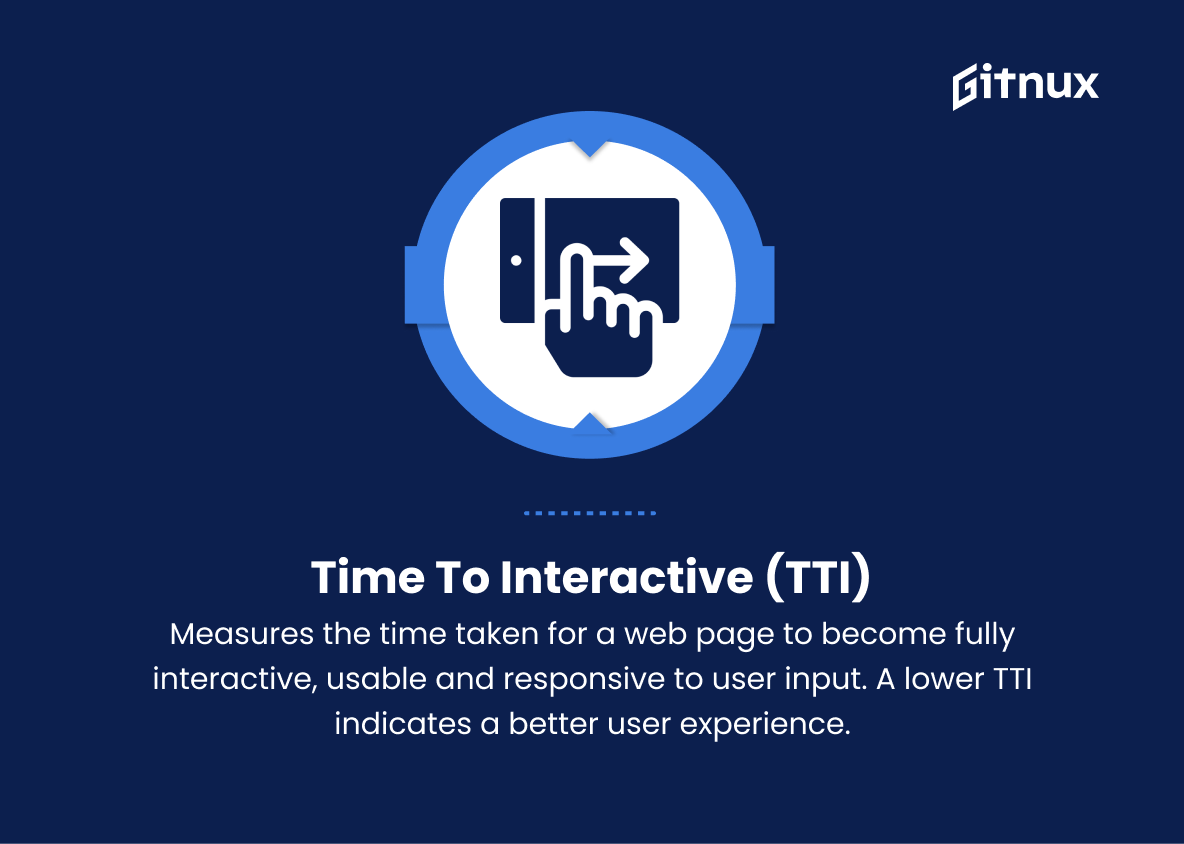
7. Time to Interactive (TTI)
TTI measures the time taken for a web page to become fully interactive, usable and responsive to user input. A lower TTI indicates a better user experience and faster-loading web pages.
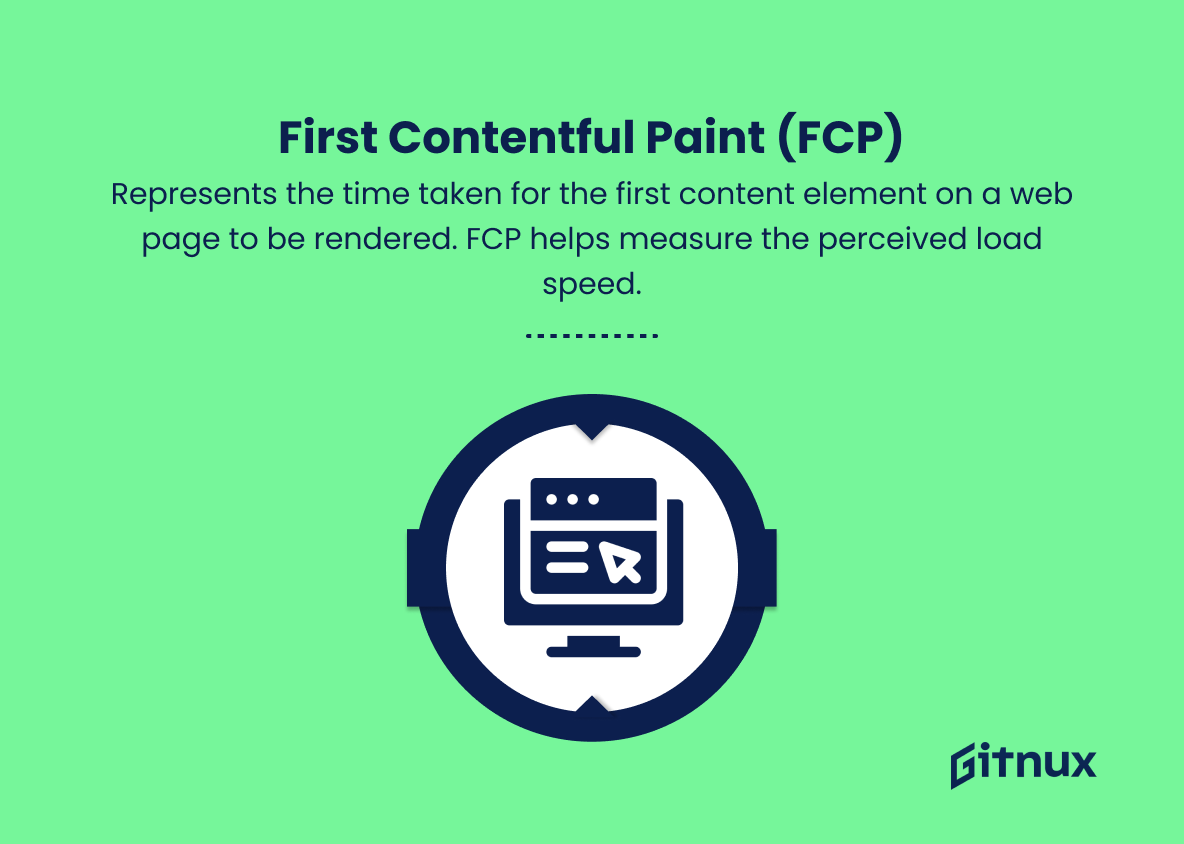
8. First Contentful Paint (FCP)
This metric represents the time taken for the first content element (text, image, canvas element) on a web page to be rendered. FCP helps measure the perceived load speed of a web page by users.
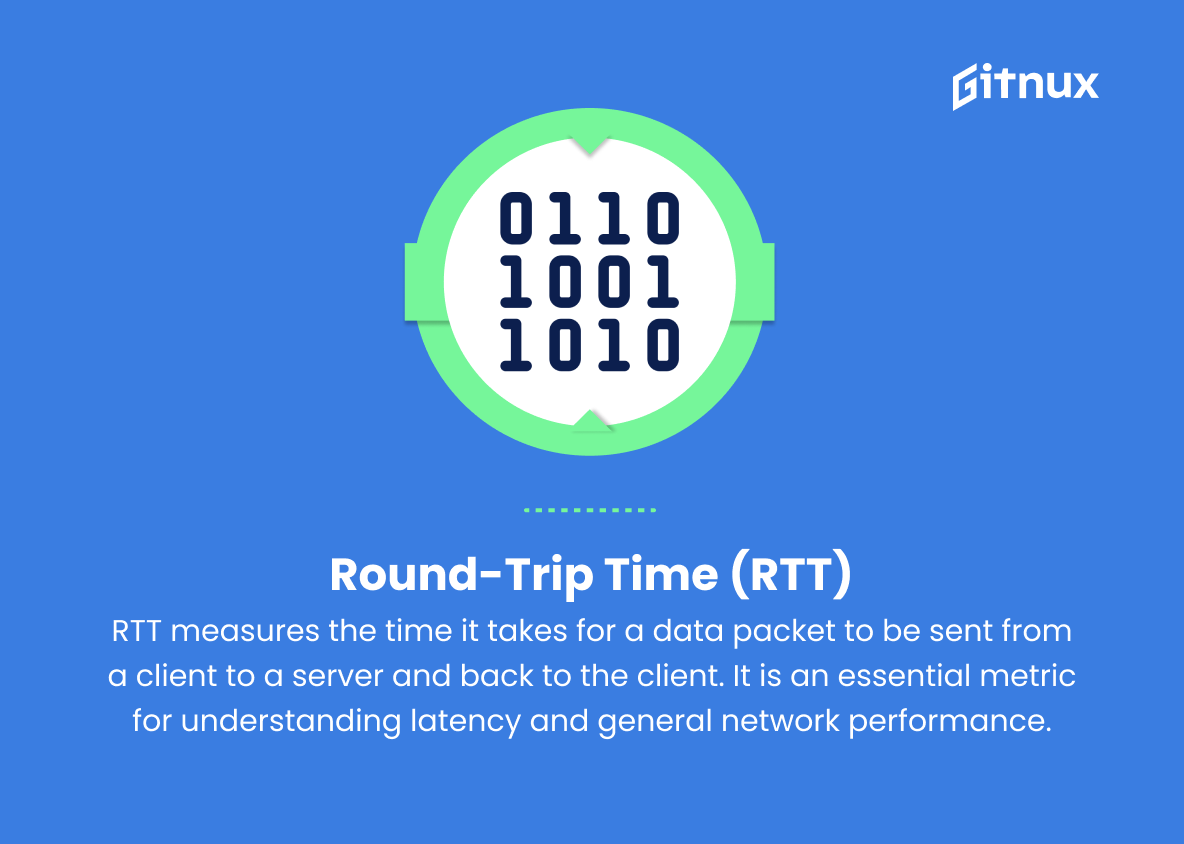
9. Round-Trip Time (RTT)
RTT measures the time it takes for a data packet to be sent from a client to a server and back to the client. It is an essential metric for understanding latency and general network performance.
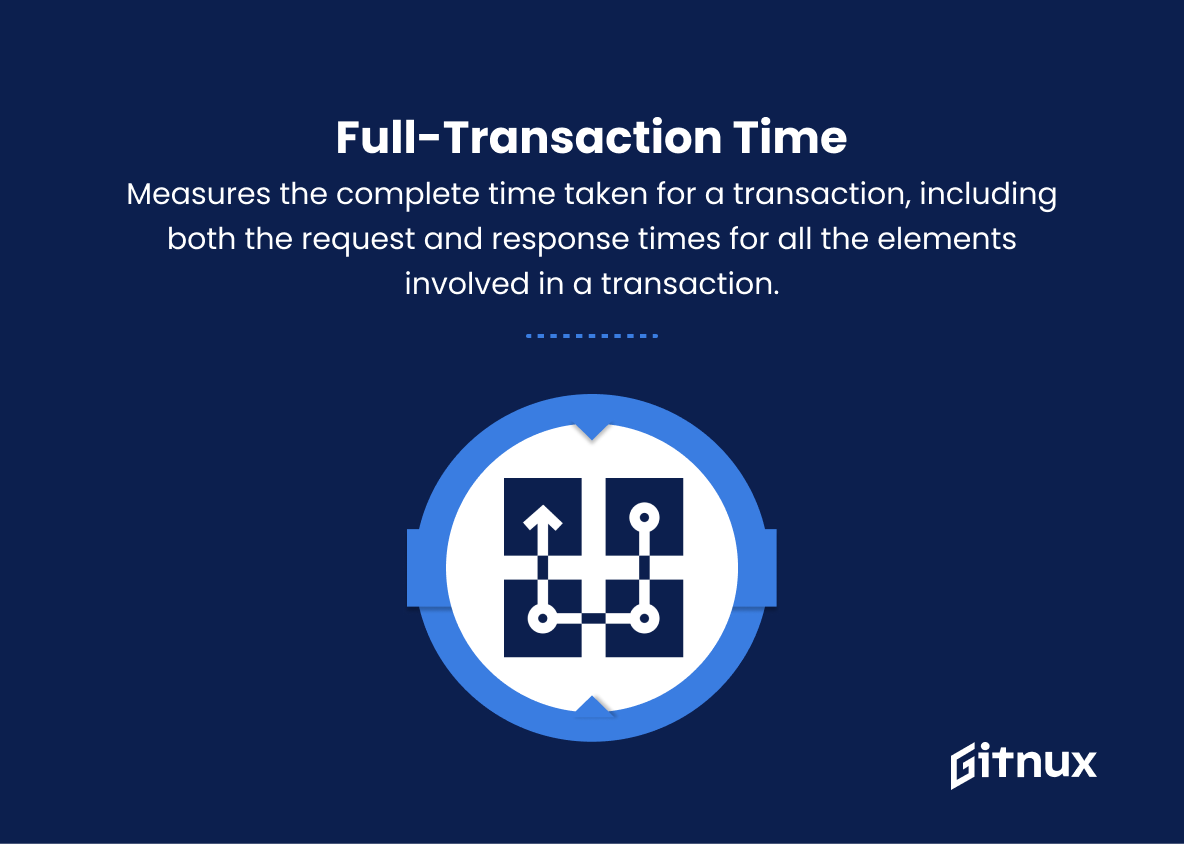
10. Full-Transaction Time
This metric measures the complete time taken for a transaction, including both the request and response times for all the elements involved in a transaction. It is a comprehensive measurement to analyze real-life user experiences as they include the overall transactional journey.
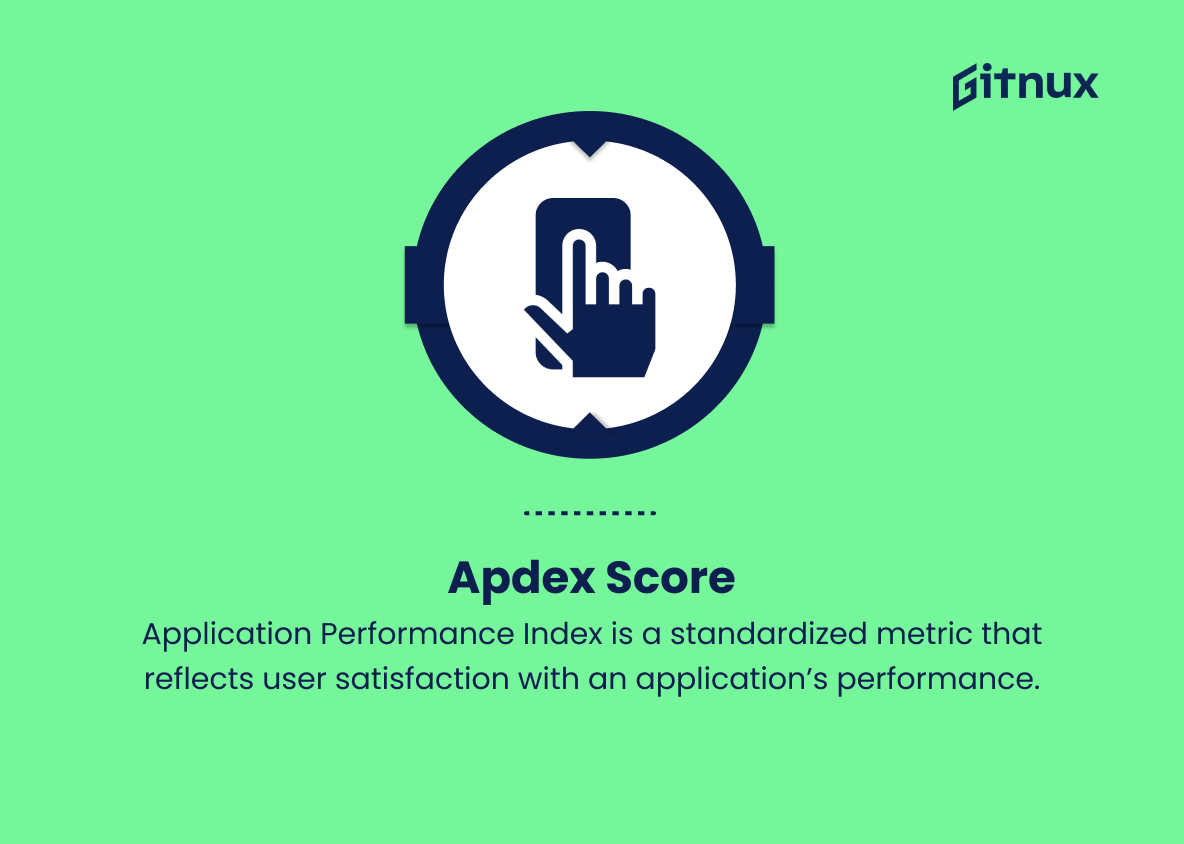
11. Apdex Score
Application Performance Index (Apdex) is a standardized metric that reflects user satisfaction with an application’s performance. It categorizes response times as either satisfactory, tolerable, or frustrating based on customizable threshold levels, and then calculates a single score on a scale from 0 to 1, with 1 being the best.
Response Time Metrics Explained
Response time metrics are crucial for evaluating the performance of a system or service and ensuring a smooth user experience. The Average Response Time provides insight into the overall efficiency of a system, while the Median Response Time helps offer a more accurate depiction by eliminating the impact of outliers. The Maximum and Minimum Response Times help identify areas of concern and optimal performance, respectively. Percentile Response Time is useful for understanding response times under various load conditions and removing extreme values that may affect the average.
Time to First Byte indicates network latency and server efficiency, while Time to Interactive and First Contentful Paint focus on load times and user perception. Round-Trip Time measures general network performance and latency, and Full-Transaction Time offers a comprehensive view of the user experience. Lastly, the Apdex Score provides a standardized metric to quantify user satisfaction, allowing for easy comparison and analysis of application performance.
Conclusion
In summary, understanding and effectively utilizing response time metrics is crucial for businesses aiming to enhance their user experience and overall performance. By establishing benchmarks, regularly monitoring these metrics, and employing optimization strategies, businesses can significantly improve their digital platforms’ responsiveness, leading to happier customers and increased conversions.
It’s essential to remember that no single metric can provide a complete picture of your platform’s performance; therefore, a holistic approach that considers multiple response time metrics is the key to ensuring an excellent user experience in today’s fast-paced digital landscape.
